Abstract
In a general scenario, while attending a scene containing multiple faces or looking towards a group photograph, our attention does not go equal towards all the faces. It means, we are naturally biased towards some faces. This biasness happens due to availability of dominant perceptual features in those faces. In visual saliency terminology it can be called as ‘salient face’. Human’s focus their gaze towards a face which carries the ‘dominating look’ in the crowd. This happens due to comparative saliency of the faces. Saliency of a face is determined by its feature dissimilarity with the surrounding faces. In this context there is a big role of human psychology and its cognitive science too. Therefore, enormous researches have been carried out towards modeling the computer vision system like human’s vision. This paper proposed a graphical based bottom up approach to point up the salient face in the crowd or in an image having multiple faces. In this novel method, visual saliencies of faces have been calculated based on the intensity values, facial areas and their relative spatial distances. Experiment has been conducted on gray scale images. In order to verify this experiment, three level of validation has been done. In the first level, our results have been verified with the prepared ground truth. In the second level, intensity scores of proposed saliency maps have been cross verified with the saliency score. In the third level, saliency map is validated with some standard parameters. The results are found to be interesting and in some aspects saliency predictions are like human vision system. The evaluation made with the proposed approach shows moderately boost up results and hence, this idea can be useful in the future modeling of intelligent vision (robot vision) system.
Keywords: Prominent face, Relative visual saliency, Spatial distance, Intensity, Visual attention
Introduction
Humans are proficient to remark visually dominating regions in a scene comfortably and rapidly. In the context of attending a scene of crowd or multiple faces, humans do not visit all the individual faces with the same focus. In other words, we attend few selected faces only. This biasness takes place due to availability of some perceptual dominant features in those faces. In visual saliency terminology these faces can be called as ‘salient face’. Human visual system has limited processing capacity, so it cannot deal with all the faces at a time. They attend only some salient faces (noticeable or important faces), from the scene of crowd. In the cognitive science terminology such process (in which one or a few sensory objects or regions are attended and other ones are getting ignored) is called selective attention (Pal 2014; Frintrop et al. 2010; Koch and Ullman 1987; Itti and Koch 2001). We constantly gathering information through our five senses (Pal 2014) and interacting with nearby things. All the sensory information is routed to the upper level of the brain. After analysis and interpretation, human brain intelligently filters the unwanted visual information and only the selective information goes to the deeper level of the brain for the further process where, way of thinking and decision making takes place. Based on this judgment and decision making, detection, identification and recognition takes place (Pal 2014; Frintrop et al. 2010). Attention is guided by something called visual saliency (Pal 2014; Itti and Koch 2000; Itti et al. 1998).
An object may be salient due to various specific features. Therefore, with respect to these features, numerous saliency models have been developing regularly. Besides eye fixates, many state of art methods for salient object detection are available in the literature. Some of them are: Group Saliency in Image Collections (Cheng et al. 2014), A multi-scale rarity-based saliency detection (Riche et al. 2013), Kalman filter based Saliency detection (Roy and Mitra 2016), Global Contrast based Saliency Detection (Cheng et al. 2015), Visual Saliency with Statistical Priors (Li et al. 2014), Exploiting Local and Global Patch Rarities for Saliency Detection (Borji and Itti 2012), Variational Laws of Visual Attention for Dynamic Scenes (Zanca and Gori 2017), Saliency-based Intelligent Camera (Kumar et al. 2018) etc.
In the context of attending multiple faces in a scene, some faces are more salient, due to their dominating perceptual properties (Pal 2014; Itti and Koch 2001) in terms of low level features (colour, intensity, orientation, texture etc.) and geometrical features (shape, size, structure etc.). In order to find the salient face, first, there is a requirement of detecting the faces. Computer vision researchers have come up with numerous face detection approaches (Zhao et al. 2003; Tolba et al. 2006; Jafri and Arabnia 2009). Some well-known methods are; Geometrical approach to detect the eyes and mouth in real scene (Wang et al. 2007), Characterization of human faces (Kirby and Sirovich 1990), Active Shape Model (Cootes et al. 1995), Convolution Neural Network (Lawrence et al. 1997), Hidden Markov Model (Nefian and Hayes 1998) etc. Many hybrid methods have also been introduced which are like Component-based model (Heisele et al. 2003), Modular Eigen faces (Gottumukkal and Asari 2004), etc.
Computational neuroscience researchers have boosted up the face detection task by including the term visual saliency. But, till now very few researches have been carry out so far. Some of them are: Attention capture by faces (Langton et al. 2008), Saliency map augmentation with facial detection (Kucerova 2011), Selective attention-based method for face recognition (Salah et al. 2002), Visual perception based on eye movements (Martinez-Conde et al. 2004), Facial expression recognition and expression intensity estimation (Yang 2011) etc. Moreover, saliency distributions and its variations among the faces in the crowd or over the set of multiple face images have also been estimated in some literatures (Langton et al. 2008; Kucerova 2011; Salah et al. 2002; Martinez-Conde et al. 2004; Kumar RKGarain et al. 2015; Kumar et al. 2015). Overviews of some of the literatures of visual saliency have been described in Table 1.
Table 1.
Overview of literatures
| Study | Database source/ characteristic | Work | Significance/objective | Finding |
|---|---|---|---|---|
| Attention capture by faces (Langton et al. 2008) | Face-present and face-absent stimulus | Experiments present facts of a stimulus-driven capture of attention by faces capturing attention while in contest with other non-face objects | Determining dominance of face over other objects in terms of capturing attention under unsupervised conditions | Measurement of Distraction in the presence and absence of faces |
| Saliency map augmentation with facial detection (Kucerova 2011) | Visual Object Classes database | Face Detection based on attention cue. It combines colour, intensity and texture features to get saliency map | To detect faces using local context inhibition of multiple cues | Detection of salient face in the observed scene |
| Selective attention-based method for face recognition (Salah et al. 2002) | 12*12 down sampled low resolution digit images, Low Resolution Face images | Simulate the saliency model based on both bottom up and top down attention mechanism of the human vision system. In between, these mechanisms, there is a neural network that evaluates image parts and generates posterior probabilities as remarks to the Markov model | A serial model for visual pattern recognition | Handwriting and Face recognition for low resolution, down sampled images |
| The Role Of Fixation Eye Movements In Visual Perception (Martinez-Conde et al. 2004) | In this paper the role of brain towards the fixation of eye movements has been studied. Human visual system has works in such a way that we have to fix our gaze to look over the minute details of the visual world, but our fixation is not perfectly over that minute location were to fixate perfectly to prevent the fade from the entire visual world | Determining how visible perception is encoded by neurons in various visual areas of the brain | To understand the foundations of visual awareness | |
| Enlighten the effect of neighbor faces in crowd (Kumar RKGarain et al. 2015) | Set of multiple faces having high and low contrast images | Explained how the saliency of a face is changing with its neighbouring faces. In this method, distribution of visual saliency has been calculated based on intensity values and respective spatial distances among the faces | To illustrate the saliency of a face can be affected by its neighbour faces | Relative Impact of faces among them due to feature differences and proximity |
| Normalized Attention of faces using Relative Visual Saliency (NRVS) (Kumar et al. 2015) | Set of multiple faces having high and low contrast images | Proposes a novel method to measure, how human’s attention is more regulated towards a particular faces in the crowd. Normalized relative visual saliencies (NVRS) of faces are calculated for obtaining the similar and dissimilar attentive faces in the crowd | To model computer vision system that can identify similar salient faces based on Feature Difference, Proximity preference and Similarity preference | Identifying similar and dissimilar attentive faces in terms of their relative saliencies |
| Degree Centrality Model (Pal et al. 2010) | IIT Kharagpur, Lab image database containing one or two salient objects in a scene | A multiscale, complex network-based approach for determining saliency. It uses degree centrality over a network of image regions to form a saliency map. The regions used in the network are multiscale in nature with scale selected automatically | Saliency of a region of an image has been computed based on degree centrality of a node (region) | Forming bottom-up saliency network based model using low-level attributes (intensity and orientation) |
| Graph based visual saliency (Harel et al. 2006) | Wolfgang Einhäuser for his offering of natural images. Source: http://visionlab.ece.uiuc.edu/datasets.html | Authors have proposed a Graph-Based Visual Saliency (GBVS) using Bottom-Up mechanism. It involves two steps: 1st forming activation maps on some feature channels and 2nd normalizes them in a way which highlights conspicuity and concedes combination with other maps | This paper proposes a method of computing bottom-up saliency maps which illustrates a remarkable consistency with human’s gaze prediction | The model is simple and biologically conceivable in so far as it is naturally parallelized |
| Context-Aware Saliency Detection (Goferman et al. 2012) | Database consists of various kinds like, images containing single object with an monotonous background, Images with immediate salient surroundings and images having complex scenes | Present a detection algorithm which is based on low level features, high level factors (like human faces), local contrast and global contrast observed in the psychological literature | To Achieve the goal to either classify fixation points or detect the dominant object | Covers all the important salient regions of the scene whatsoever was missed in the classical saliency algorithms |
| Frequency-tuned Salient Region Detection (Achanta et al. 2009) | 60,000+ images having a salient object or a typical foreground object. Out of which 20,840 images selected for labelling. Excluded the images have a extremely large salient object | Introduce a method for salient region detection that outputs full resolution saliency maps with well-defined boundaries of salient objects. These boundaries are preserved by retaining substantially more frequency content from the original image than other existing techniques. Our method exploits features of color and luminance, is simple to implement, and is computationally efficient | Presented a frequency tuned approach of computing saliency in images using low level features of colour and luminance | Provides full resolution saliency maps. Deficiencies of these techniques arise from the use of an inappropriate range of spatial frequencies |
Related works
Visual Saliency is subjective perceptual quality to decide the focus of attention towards any object, face or a region. Visual attention is a complex process because it is associated and perceived with various aspects like cognitive, vision and semantic cues etc. In the last few years, a lots of saliency detection models have been proposed. But, different communities of researchers have explored different aspects of salient features. Therefore, there is a huge gap in the association among the various aspects. For example, many literatures are available based on the cognitive aspect. Some literatures applied the classical computational method, i.e. well-known graphical approaches. In recent times, numerous ‘semantic cues’ are being added in the saliency model to improve its efficiency. For example, now a days, ‘face cues’ are becoming more popular due to having the enormous semantic information inside it. Most of the saliency models based on the graphical approach and cognitive science approach have been explored for general objects only. Till now, to the best of our knowledge, these aspects have not been incorporated in the more semantic objects like faces. In order to make better understanding of the current studies, some recent works with the various aspects like cognitive aspect, graphical based and the face related saliency models has been explained in the following sub-sections.
Cognitive aspects based saliency models for general objects
In a recent work (Urakawa et al. 2017), authors identified the perceptual alternation in the bi-stable image using visual change process. They established a model that measures the electroencephalographic brain response to reflect the visual change detection, during participants constantly look at the bi-stable image.
In the research (Zommara et al. 2018), gaze likelihood analysis for the ‘Iowa Gambling Task’, has been done in a two-choice version (Using ‘mouse click’ and ‘button press’). System is trained by active learning approach for the different choice options. In the first experiment, volunteers were asked to choose between two decks with different structures, and to give their responses using mouse clicks (eye-hand coordination). In the second experiment, volunteers were asked to give responses using a key press (without any influence from eye-hand coordination). In the both experiments, attention was found to be biased towards the choice, although the real gaze fixations (i.e. ground truth data) focus on the different spatial positions of choice options.
In Binocular Rivalry (BR), two eyes are concurrently stimulated by two inconsistent images. Scale-freeness of the BR perception of two dominant monocular states and the piecemeal transition is analyzed in the method (Bakouie et al. 2017).
Inspired from the physiological characteristics of biological neurons, method (Wei et al. 2017), proposed the neural circuit based on some control rules, for the development of better decision making.
Single Synapse Activity is highly responsible for learning and memory. In the manuscript (Di Maio et al. 2018), authors have measured the impact of active synaptic pools on the single synaptic event.
In order to deeper analysis of the consciousness and cognition, entropy and complexity has been measured in the work (Mateos et al. 2018).
Graphical approach based saliency models for general objects
In order to measure the visual saliency in more robust and dynamic way, graph based approaches are introduced in many works. Graph models exhibit well-suited representation and learning experience for visual saliency of general objects. Many such works are discussed in (Zhu et al. 2018; Wang et al. 2016; Zhang et al. 2017a, b; Tang et al. 2017).
In a method (Zhu et al. 2018), researchers have proposed a bottom-up saliency model using affinity graph learning and weighted manifold ranking. An unsupervised learning approach is applied to learn the affinity graph. In another graph based technique (Wang et al. 2016), an unsupervised bottom-up approach is established using graph structure and background priors. In this method, input image is signified as an undirected graph where superpixels are considered as nodes. In most of the model, the contrast between salient objects and their neighboring regions has been considered for saliency computation. In another work (Zhang et al. 2017a), both foreground and background cues have been considered for computing the saliency. Here, authors have compared and ranked the image regions or objects with foreground or background cues using graph-based manifold ranking.
A weighted low-rank matrix recovery (WLRR) model (Tang et al. 2017) has been developed for detecting the salient object. In this method a high-level background prior map is estimated based on the color, location, and boundary connectivity. Now, this prior map is represented into a weight matrix which signifies the probability of belongingness of each image region to the background.
In the work (Zhang et al. 2017b), a graph-based optimization framework has been established for the detection of salient objects. At first, based on the different image properties, multiple graphs are created to represents the complex information of the scene. Next, in order to make this model more appropriate, the concept of visual rarity (a cognitive property) is incorporated in the optimization framework.
Facial cue based saliency models
To figure out and explore the capabilities of various graph based visual saliency models for different computer vision and robotic applications such as measurement of visual saliency of facial images could have potential utilization in intelligent systems design. But, until recent time, to the best of our knowledge, such works are not available in literatures in compared to general objects. However, in few literatures ‘face cues’ have been applied in the saliency models, but these models followed the non-graphical approach.
Due to high semantic information, faces drag our attention more rapidly than the other objects. But, most of the available attention models have been developed for the general objects only. However, some of the recent works are available in the literature, which explores the face saliency with limited features. As various factors about human faces have been proved to persuade the visual attention, researchers initiate to combine face cues into saliency modeling. In the literatures (Min et al. 2017a; Kant Kumar et al. 2018), authors have built an attention model mainly for the face images. They combined the low-level features (Computed by some existing saliency models) with high-level facial features. Võ et al. (2012) experimentally found that, in a scene containing human faces, our gaze is vigorously directed towards the facial components like eyes, nose, or mouth. In the conversation scenes classical models gets fail to predict the salient face because it required auditory information. Therefore, in the work (Min et al. 2017b), researchers have suggested to consider the auditory information also. They have shown that, apart from of the auditory situation, people look more at faces, and mainly at talking faces. Jiang et al. (2014) have proposed a visual attention model by incorporating the crowd information. In this approach, low-level and high-level crowd features are combined through multiple kernel learning (MKL). The crowd features are the face related cues like size, density, pose etc. Using Convolution neural network (Zhao et al. 2016), authors have proposed a system that can have a capability to learn the saliency features, from the face regions. Based on the saliency features, faces can be detected and recognized.
The above mentioned methods described in Sections “Cognitive aspects based saliency models for general objects”, Section “Graphical approach based saliency models for general objects” and Section “Facial cue based saliency models” are good for the particular aspects of saliency. The researchers have found that the cognitive and graphical aspects are very effective for the general-object based saliency model. But, these important aspects have not been applied over the faces to the best of our knowledge. Another problem is; most of the existing methods mainly focus on pixels wise pattern variation in terms of low level or high level features; as a result, it does not provide a good output that can resemble a whole face as salient. Furthermore, in these methods, spatial proximities among the faces have also not been taken into account, so they are not considering the impact of saliency due to the spatial locations among the faces.
For solving these issues, this work attempted to incorporate the cognitive as well as the classical vision aspects (using graph based approach), for finding the salient face among the multiple faces. It is basically graph based visual saliency model (GBVS) influenced by bottom-up saliency mechanism (Itti 2000). In this research, gray scale images have been taken as the input image in which, intensity, size and positional proximity among the faces are considered as the main parameters to estimate the saliency score. Other features have been ignored to make the experiment simple and suitable with the gray scale images.
The contribution of this paper is organized as follows: In Section “Mathematical formulation of problem based on the real observation of human”, a mathematical formulation for calculating the saliency score of faces is discussed. The proposed approach is briefly described in Section “Proposed approach”. Database description, experimental validation and results of the proposed method are presented in Section “Database description, experimental validation and results”. In Section “Saliency variation with random position change”, variation of saliency of the target face with respect to its changed location is tested. Merits and limitations of the proposed method have been pointed out in Section “Merits and limitations of proposed method”. Finally, Section “Conclusion” draws the concluding remark.
Mathematical formulation of problem based on the real observation of human
The main focus of this work is to contribute a basic idea towards modeling a computer vision system as like human’s vision using bottom up mechanism (Itti 2000).
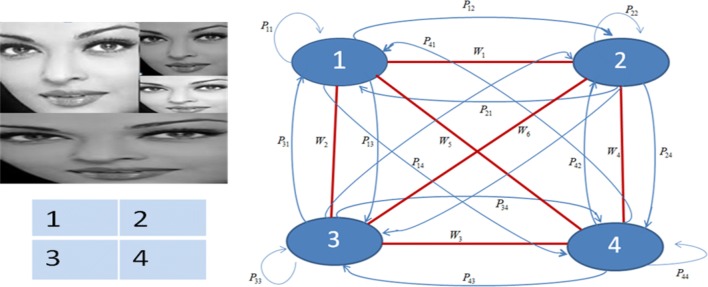
While attending multiple faces in a scene, first, we are feeling the presence of faces (In a normal scene, at a very first glance, we are giving more importance to human faces). In the proposed approach, faces are detected using Viola Jones Face detection algorithm (Viola and Jones 2004). Next, our brain searches for the salient face by visiting and comparing some features through all the faces. It means there are two-way path for direct connection with each other faces. To make this representation, we have introduced the concept of complete graph where every face is considered as a vertex. The connectivity among all the faces has been considered as edges of the graph. Human attend a particular face due to its dominating ‘perceptual features’ with respect to other nearby faces. The ‘perceptual weight’ or ‘edge weight’ of a face is calculated based on perceptual feature difference and spatial distance. The face having the highest ‘perceptual weight’ will be the most salient face in the crowd. Dominance of a face in terms of low level features (intensity, colour, orientation, texture etc.), geometrical features (shape, size etc.) are responsible for making them salient. Experiment has been carried out on gray-scale images of crowd. Therefore, intensity is considered as main feature. Orientation and other features contributing to saliency have been ignored at this stage of experiment. Face size is chosen as the geometrical feature. The graphical representation of attending the faces of an input image has been shown in Fig. 1.
Fig. 1.
Left top: input image, left bottom: face numbering, right: graphical representation of the input image
In an image set, that have ‘n’ number of faces, the probability of going from face ‘i’ to face ‘j, Pij = (Edge Weight between ‘i’ and ‘j’/Edge Weight between ‘i’ to all ‘n’ faces).
| 1 |
where ‘Wij’ is ‘Edge Weight’ or ‘Perceptual Weight’ and has been described in the Eqs. (6) and (7). ‘Net perceptual weight’ (NPW) can be obtained by Eqs. (8) and (9).
In an image, attention of a region is determined by its feature dissimilarity (contrast) with their surrounding locations. In models (Pal et al. 2010; Harel et al. 2006), contrast of an object is evaluated on the basis of feature dissimilarities and their respective positional proximity with other objects. As a result, it has been found that the dissimilarity with nearby regions contributes more in the saliency. This paper motivated from graph based model (Pal et al. 2010) and proposed a new graphical method using probabilistic approach for computing the saliency. Feature Dissimilarity (FD) and corresponding Edge Weight or Perceptual Weight (W) between two face ‘i’ and ‘j’ has been formulated as below:
| 2 |
And the Spatial Distance (SD) between face ‘i’ and ‘j’ is calculated as:
| 3 |
Area (Area covered by face) difference (AD) of the faces ‘i’ and ‘j’ can be described as:
| 4 |
where (fi, fj) are the feature values and (Ai, Aj) are the respective area of faces ‘i’ and ‘j’. Dij is spatial distance (Cartesian Distance) between the corresponding faces and ‘σ’ is the standard deviation.
Note 1 The reason of formulating the feature difference in the logarithmic form, because, nature of this function is to gradually increasing and providing a constant value after reaching a certain value. The human visual perception also has a certain level, beyond that it treats all the variation as same. Next, as the logarithmic function gives a very lesser values so making it significant we have modulated this function with the feature difference. Since, feature difference occurs due to any two faces ‘i’ and ‘j’ therefore, for getting the individual effect over each other, feature difference has been divided by 2.
Saliency score of a face is computed by its feature difference and positional proximity (i.e. spatial distance) with the other faces. In real scenario, we also observe that the same face may grab different level of attention with the different proximities of its neighbor faces. Therefore, positional proximity (spatial distance) is also included in our saliency computation formula. Finally, we are comparing the features among all the faces and saliency is estimated. The ‘Edge Weight’ or ‘Perceptual Weight’ between faces ‘i’ and ‘j’ is calculated based on feature and area difference modulated with the spatial distance. Therefore, the Edge Weight (Wij) is proposed as:
| 5 |
Specific form of the above equation is described as:
| 6 |
| 7 |
Note 2 In the first part of Eqs. (6) and (7), feature dissimilarity and corresponding area difference of faces ‘i’ and ‘j’ has been accumulated for getting their combined effect. In the real world, the effect of one object due to presence of other object decreases exponentially with respect to their relative distance and vice versa. We have also incorporated the relative effect of accumulated features along with the spatial distances among the faces. Therefore, accumulated feature differences have been modulated with the Gaussian function.
For the same feature values of two faces i and j, their relative saliency value will be zero. It means positional proximity between nodes ‘i’ and ‘j’ do not participate in the contribution of calculating the saliency. Hence Eq. (5) is not suitable for such cases. In order to yielding the contribution of positional proximity for such situation, the new-fangled equation for calculating relative saliency is proposed in Eqs. (6) and (7). Therefore, the generalised mathematical expression is further proposed as:
‘Net perceptual weight’ (NPW) of a face ‘i’ due to all other faces has been formulated as below:
| 8 |
| 9 |
In the crowd having ‘n’ number of faces, probability of going to face ‘j’ from a particular face ‘i’, Pij = (Edge Weight between ‘i’ and ‘j’ / Edge Weight between ‘i’ to all ‘n’ faces)
| 10 |
Proposed approach
A face can be salient due to many factors like its structural features (i.e. shape, size, expressions) or low level features (colour, intensity etc.). In the initial stage, experiment has been performed on grayscale images of the faces with frontal view. Therefore, intensity has been considered as a key parameter for the dominating feature.
Different people may tend to focus their gaze towards different face among a multiple face in the crowd, due to their cognition with experience, when they attend them with top down attention mechanism (Itti 2000). There are two types of attention mechanism called as bottom up mechanism and top down mechanism (Itti 2000). When we are attending a visual scene based on the direct visual information coming out from the stimulus and we don’t have any prior knowledge or previous experience of the scene, is called bottom up attention mechanism. On the other hand, if we are applying some prior knowledge or previous experience of a scene while visiting it, is called top down attention mechanism. Here, we are assuming that visitor doesn’t have any previous knowledge of the scene and saliency estimation is purely stimulus based. Hence, we are following bottom mechanism for the attention and therefore, here saliency is less subjective.
In the faces, normally, high level cue highly matters when relative saliency is measured among different faces or with faces having different expressions. Face components (eye, nose and mouth) are the most responsible regions for generating the cues and it varies with the different faces or different expressions of the same or different faces. In this experiment, parameters to measure saliency due to variation of facial expression have not been taken. Therefore, in this work, we have created the simple dataset of different set of images, where every set consist of multiple images of same face with same expression but different in facial area and average intensity. Therefore, there is no difference in the structure of the face, its components and their expression. Due to this reason we have not considering the high-level cue. In addition to this, chance of saliency distraction due to background has also been resolved by taking the input image without any background.
The main goal of our experiment is to establish the graph-based technique that estimate the relative saliency of faces based on their average intensity values, facial sizes and positional proximities among them. In the real scenario, at very first, human observe and virtually connect all the faces available in a visual scene then compute the feature difference among them. Finally, our gaze goes toward the face which maintains the maximum feature difference. In this work, we are trying to model this concept based on graph based probabilistic approach. Experiment has been conducted on gray scale images, so intensity has been considered as the central feature. Moreover, we can consider many other features, but the overall idea will be the same. Only the other features will be replaced or accumulated with the intensity values.
In order to obtain the saliency values of faces in the crowd input image and to find out the most salient face among them, the following procedure has been proposed.
First Viola Jones Algorithm (Viola and Jones 2004) has been applied to detect all the faces in the input image.
Find the centre co-ordinates of the detected faces of the input image.
Extract all the faces of the input images and segment these individual faces into a set of homogeneous regions using (Comaniciu and Meer 2002).
To find the mean intensity values for all the faces by using intensity values of corresponding segments of that face images.
Finding the ‘Perceptual weight’ or ‘Edge weight’ of the faces using Eqs. (5), (6) and (7).
Obtaining the ‘Net perceptual weight’ of the faces and considering the highest ‘Net perceptual weight’ as the most salient face using Eqs. (8) and (9).
Compute the probability values of attending a face from the other faces by using Eq. (10).
The face having the most ‘cumulative probability value’ will be viewed as the most salient face in the crowd.
The details of the proposed steps are described in the following subsections.
Face detection using Viola Jones algorithm
Here, we have followed the human’s way of attending a scene which contains multiple faces. In a general scenario, while attending a normal scene containing faces, we are giving more importance to human faces rather than other object or background. The main reason is; as human’s faces is our species, therefore, we can understand and interprets much more meaningful information from the faces rather than other species or objects. Human faces are almost always the focus of visual attention because of the rich semantic information therein. So, first we are detecting the faces and just ignoring the other objects or background.
Next, our brain searches for the salient face after comparing the relevant features with respect to spatial distances among all the faces. It means, face detection is the primary task in the estimation of saliency among the faces. In similar way, in this proposed method, first faces are detected using Viola Jones Face detection algorithm (Viola and Jones 2004).
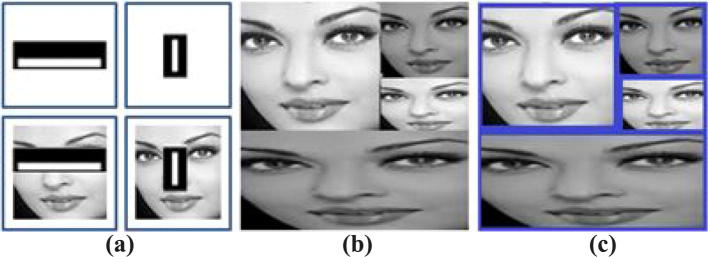
‘Viola Jones Face Detector’ had been developed by forming a ‘training classifier’ based on trained it by non-facial and facial features. In the first step, Haar-Like Features (Viola and Jones 2004) are extracted. Haar-Like Features are features extracted through various masks which are used for object characterization. Next, concept of integral image (Cordiner et al. 2009) is applied to decrease the computational calculation. More than 160,000 features are generated using Haar functions but all of them are not relevant. Irrelevant features are discarded by using Adaboost algorithm (Viola and Jones 2004). The relevant selected features works as Weak Classifier (Viola and Jones 2001). These weak classifiers are linearly combined to builds a strong classifier. Finally, multistage processes are done with a strong classifier to generate Cascade Classifier (Viola and Jones 2001). At each stage, it makes a decision about sub-window consider as a face or a non-face. Haar features elected by Adaboost algorithm are applied over face image as shown in Fig. 2a. The first feature quantifies the intensity variation between eyes and its lower cheek areas. It finds that the eye section is darker than cheeks regions. Second feature decide the intensity variation between the eye regions and bridge of the nose.
Fig. 2.
(a) Haar features, (b) input image and (c) detected faces using (Viola and Jones 2004)
Note Cascade classifiers (Viola and Jones 2001) sometimes criticize the possibility of data inflating. But, same time there is a huge advantage of cascade classifier in terms of accuracy and time complexity The main advantage of cascade classifier is in that scenario where a large no of weak classifiers are available. Features are selected to form a weak classifier if they can at least perform better than random guessing i.e., they detect more than half of the cases. In other words, weak classifier must work at least with 51% accuracy. It rejects the many samples in first level with an efficient time. In the process of face detection, cascade classifier rejects those weak features (which are not effective) very fast. Hence, performance is enhanced in terms of accuracy and time complexity.
Finding centre for all the faces of the input images
Centre (C) of the input image is found as C(r/2, c/2), where r = no of rows, c = no of columns of the input image. Centre of all the detected faces are found using coordinates of the bounding boxes created by Viola Jones Algorithm (Viola and Jones 2004). Obtained centre coordinates for all the faces of the input image are described in Table 2.
Table 2.
Obtained center points of faces
| Face no | X-coordinate | Y-coordinate |
|---|---|---|
| 1 | 55.2000 | 57.0000 |
| 2 | 147.2000 | 38.0000 |
| 3 | 147.2000 | 95.0000 |
| 4 | 92.0000 | 147.2000 |
Face extraction and segmentation
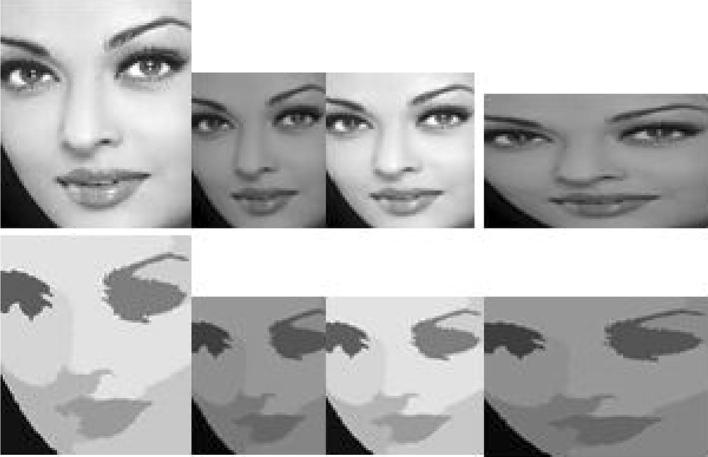
Mean shift segmentation technique (Comaniciu and Meer 2002) has been applied for segmenting the detected faces. The experiment has been conducted on grayscale images. Therefore, intensity is considered as the central feature. In technique (Comaniciu and Meer 2002), segmentation is performed based on the intensity, spatial bandwidth (neighborhood in the pixel domain), minimum region (The minimal area for segmented regions in terms of pixels). As all the human faces are the similar objects, so the similar values of the parameters can be set. Here, the values of the parameters are set as; spatial bandwidth = 7, minimum region = 20. Extracted Faces from the input image and their corresponding segmented faces are shown in Fig. 3.
Fig. 3.
Extracted faces and their segmented image
Segmentation has been applied for fast and efficient extraction of features. In a face, distinct features are available in its main components i.e. eyes, nose, lip and cheek area. While visiting a face, we are mainly extracting features from these areas. Segmentation, divides the images into meaningful homogeneous regions called segments. A homogeneous region (segment) contains almost the same features. Therefore, every time, instead of extracting the features from each and every pixels of a face, only one feature value is extracted correspond to a segment. It means, total no of feature values are equal to the total no of homogeneous regions or segments. The feature vector size with and without segmented input images (Mentioned in Figs. 17, 18, 19, 20, 21, 22, 23) have been mentioned in Table 3.
Fig. 17.
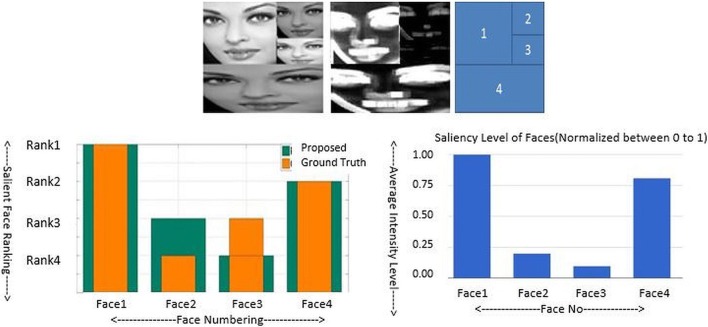
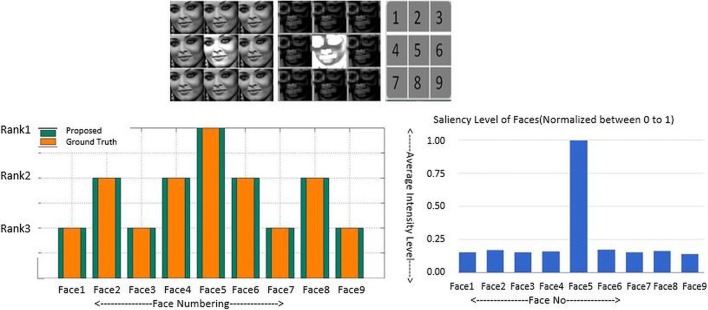
Top Row—Left: input image, Middle: proposed saliency Map, Right: face numbering. Bottom Row—Left: bar graph using proposed method (highlighted in green) and based on volunteers perception or ground truth (highlighted in orange colour), Right: intensity bar graph of generated saliency map. (Color figure online)
Fig. 18.
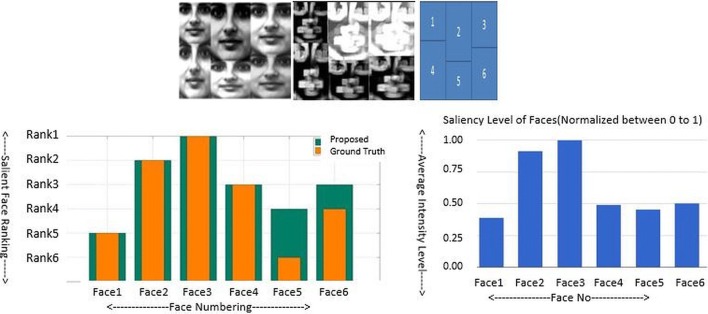
Top Row—Left: input image, Middle: proposed saliency map, Right: face numbering. Bottom Row—Left: bar graph using proposed method (highlighted in green) and based on volunteers perception or ground truth (highlighted in orange colour), Right: intensity bar graph of generated saliency map. (Color figure online)
Fig. 19.
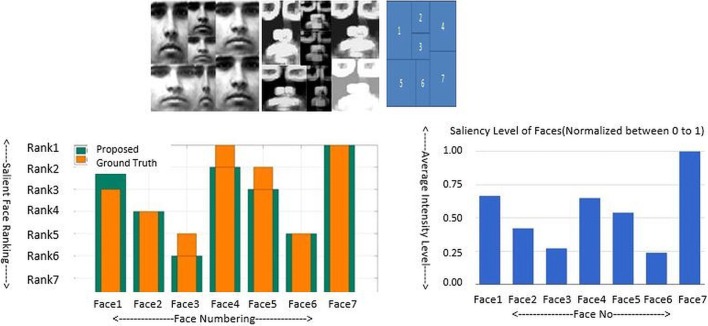
Top Row—Left: input image, Middle: proposed saliency map, Right: face numbering. Bottom Row—Left: bar graph using proposed method (highlighted in green) and based on volunteers perception or ground truth (highlighted in orange colour), Right: intensity bar graph of generated saliency map. (Color figure online)
Fig. 20.
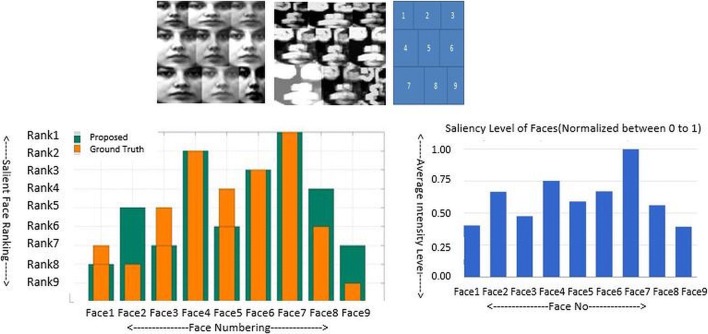
Top Row—Left: input image, Middle: proposed saliency map, Right: face numbering. Bottom Row—Left: bar graph using proposed method (highlighted in green) and based on volunteers perception or ground truth (highlighted in orange colour), Right: intensity bar graph of generated saliency map. (Color figure online)
Fig. 21.
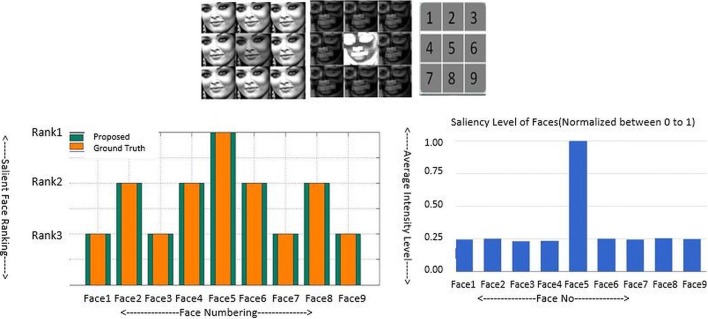
Top Row—Left: input image, Middle: proposed saliency map, Right: face numbering. Bottom Row—Left: bar graph using proposed method (highlighted in green) and based on volunteers perception or ground truth (highlighted in orange colour), Right: intensity bar graph of generated saliency map. (Color figure online)
Fig. 22.
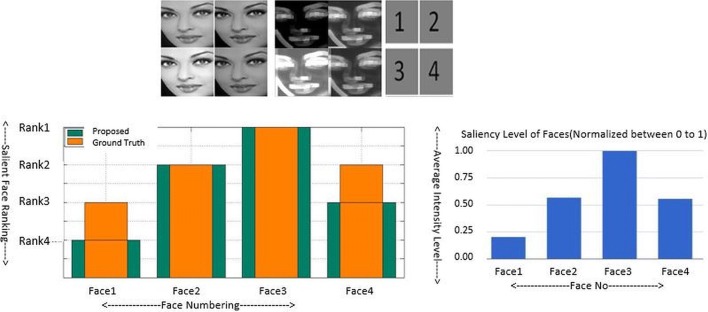
Top row—Left: input image, Middle: proposed saliency map, Right: face numbering. Bottom Row—Left: bar graph using proposed method (highlighted in green) and based on volunteers perception or ground truth (highlighted in orange colour), Right: intensity bar graph of generated saliency map. (Color figure online)
Fig. 23.
Top Row—Left: input image, Middle: proposed saliency map, Right: face numbering. Bottom Row—Left: bar graph using proposed method (highlighted in green) and based on volunteers perception or ground truth (highlighted in orange colour), Right: intensity bar graph of generated saliency map. (Color figure online)
Table 3.
Feature vector size with and without segmented image
| Input image | 1 | 2 | 3 | 4 | 5 | 6 | 7 |
|---|---|---|---|---|---|---|---|
| Feature vector size (without segmentation) | 6956 | 17,717 | 19,737 | 19,910 | 29,241 | 29,241 | 29,880 |
| Feature vector size (with segmentation) | 1063 | 1984 | 2106 | 2049 | 4629 | 3887 | 2303 |
As the feature vector size are reduces after the segmentation, therefore, processing time also get reduces during the saliency computation. Hence it makes the system more efficient and also reduces the time and space complexities.
Determining the average intensity, area and spatial distance of faces
Every pixel belonging to a segment has more or less equal intensity value. The intensity value of a particular segment is determined by the average intensity of all its belonging pixels. In order to find out the intensity value of a face image, average intensity value with respect to all the segments and their belonging pixels are calculated. Mean intensity (I) value of a face is calculated by using Eq. (11) as below:
| 11 |
where Seg (i) represents the ith segment of a face. Average Intensity for all the faces of the input image (Fig. 4), are described in Table 4.
Fig. 4.
(a) Input image, (b) centre of the faces and (c) face numbering
Table 4.
Obtained intensity values of faces (row wise)
| Face no | 1 | 2 | 3 | 4 |
|---|---|---|---|---|
| Avg. intensity | 171 | 119 | 171 | 119 |
Obtained absolute feature (Intensity) differences among the faces are calculated. All these values are normalized by dividing it by the maximum value. The normalized intensity values differences are depicted in Table 5.
Table 5.
Obtained feature difference (normalized) matrix of faces (row wise)
| Face no | 1 | 2 | 3 | 4 |
|---|---|---|---|---|
| 1 | 0.0000 | 0.9539 | 0.0064 | 0.9081 |
| 2 | 0.9539 | 0.0000 | 1.0000 | 0.0064 |
| 3 | 0.0064 | 1.0000 | 0.0000 | 0.9539 |
| 4 | 0.9081 | 0.0064 | 0.9539 | 0.0000 |
The area difference matrix is shown in Table 6.
Table 6.
Obtained area difference (normalized) matrix of faces
| Face no | 1 | 2 | 3 | 4 |
|---|---|---|---|---|
| 1 | 0 | 0.5091 | 0.5780 | 0.2104 |
| 2 | 0.5091 | 0 | 0.0688 | 0.7195 |
| 3 | 0.5780 | 0.0688 | 0 | 0.7883 |
| 4 | 0.2104 | 0.7195 | 0.7883 | 0 |
Once the center point (Table 2) of each faces of an input image is known, spatial distances among all the faces are calculated. Spatial distance between two faces is the Cartesian distance from their centers. The normalized spatial distance (Table 7) is obtained by dividing all the values by the maximum value.
Table 7.
Obtained spatial distance (normalized) matrix of faces
| Face no | 1 | 2 | 3 | 4 |
|---|---|---|---|---|
| 1 | 0 | 0.7678 | 0.8135 | 0.7962 |
| 2 | 0.7678 | 0 | 0.4658 | 1.0000 |
| 3 | 0.8135 | 0.4658 | 0 | 0.6209 |
| 4 | 0.7962 | 1.0000 | 0.6209 | 0 |
Mapping mean intensity values to the corresponding faces
The average intensity values of all the belonging segments of faces (Obtained by Eq. 11) are considered as the mean or regular intensity of the corresponding faces of the input image. The centre points and the mean intensities of the faces are the main parameters for calculating the relative saliency of the faces.
Obtaining saliency value of the faces
Humans are enforced to focus a particular face in the crowd (or multi-faced image) if that face has more ‘relative perceptual connectivity’ with respect to other face. Relative perceptual connectivity can be estimated by their probability of connectivity. ‘Probability of connectivity’ depends on the perceptual features weight or edge weight of the respective faces. The graphical representation of ‘Probability of connectivity’ is shown in Fig. 1 (Right) and can be obtained as below:
For a crowd having four faces, n = 4. Therefore, complete graph with 4 nodes will be formed.
The Edge Weight between all the vertices can be calculated using Eqs. (5), (6) and (7). The probabilities of visiting from one node (face) to another node (outgoing) (Shown in Fig. 1, Right), are calculated as below.
Where
The Probability Matrix is described as Table 8.
Table 8.
Obtained probability values of visiting faces (any face to other face)
| Face no | 1 | 2 | 3 | 4 |
|---|---|---|---|---|
| 1 | 0 | 0.3627 | 0.0941 | 0.2583 |
| 2 | 0.4890 | 0 | 0.4187 | 0.0806 |
| 3 | 0.1690 | 0.5581 | 0 | 0.6611 |
| 4 | 0.3420 | 0.0792 | 0.4872 | 0 |
The Cumulative Probability (CP) of going from one face to rest all the faces are shown in the Table 9. Here Cumulative Probability (CP) is the summation of outgoing probability from one face to all other faces. Therefore, sum of probabilities may exceed more than 1.
Table 9.
Cumulative outgoing probability
| 1 → (1,2,3,4) | 2 → (1,2,3,4) | 3 → (1,2,3,4) | 4 → (1,2,3,4) |
|---|---|---|---|
| 0.7150 | 0.9883 | 1.3883 | 0.9084 |
Therefore, Total Cumulative Probability (TCP) of all the faces can be calculated as:
Now, Incoming Cumulative Probability (ICP) = TCP − ICP.
Normalized incoming cumulative probability of each face can be obtained by dividing Incoming Cumulative Probability (ICP) by its maximum values. The normalized values (lying between 0 and 1) are nothing but the relative saliency values of all the faces (shown in Table 10).
Table 10.
Obtained Saliency values of faces of input image (row wise)
| Face 1 | Face 2 | Face 3 | Face 4 |
|---|---|---|---|
| 1.0000 | 0.1965 | 0.0946 | 0.9837 |
Generation of saliency map
We considered the following points for generating the saliency map:
Attention towards the salient face.
Uniformly emphasize whole salient region of the face.
Establish Saliency map based on intensity differences, spatial distances and covering areas of salient faces.
Displaying all the faces in the saliency map based on their individual appealing.
Saliency map has been generated based on obtained saliency values of the faces. The overall steps for generating the saliency map are as below:
Detect all the faces using Viola Jones Face Detector (Viola and Jones 2004).
Compute saliency scores of the faces using our proposed approach (Section “Proposed approach”).
Map the saliency scores to the belonging pixels of the corresponding faces.
Apply Range filter (Bailey and Hodgson 1985) to highlight the dominating pixels in a certain local range.
Obtain the saliency map.
Saliency at a given location is determined by measuring the dissimilarity of a particular location from its surround in terms of some features like intensity and color. In computer vision, a saliency map is an image that exhibits those pixels having unique quality. Computing saliency means, to compute and populate each pixel’s unique quality in the new image, this image is called saliency map. The goal of a saliency map is simplified and changes the representation of an image into something that is more meaningful and easier to analyze.
First Viola Jones Algorithm (Viola and Jones 2004) has been applied to detect all the faces in the input image. Saliency scores of the faces are computed using Eqs. (8) and (9).
In order to resembling a whole face as a salient; average saliency scores of the faces (obtained through this experiment) has been populated to the entire pixels of the corresponding faces. Directly mapping of same saliency scores (i.e., obtained through the proposed method) to the whole pixels of the corresponding faces makes the facial surface flat and smooth. Therefore, face components (i.e. eye, nose, mouth) vanish from the faces. In the direction of preserving the textures of facial components and look-and-feel its pattern on the faces, the obtained saliency value is added to every individual pixels of the corresponding face.
As in this approach, normalized saliency scores lie between 0 and 1, therefore in order to populating of these scores to the corresponding faces with significant effect, these saliency scores have been mapped in such a way that it lies in the range of 0 to 100.
As, the experiment has been performed on gray scale images, after mapping of these saliency scores,
The modified intensity values of the pixels, it should not go beyond 0 to 255.
Once, the appropriate mapping of saliency score is done, the range filter (Bailey and Hodgson 1985) has been applied to find out the salient pixels (dominating pixels in a certain local range). The range filter is a local filter whose output for a pixel is a function of the input values inside the range of the neighborhood of the corresponding pixel. It filters the image by substituting every pixel by the difference of the maximum and minimum in its range-neighborhood. In this work window or mask of filter has been taken with the size of 9*9.
The local sub range is calculated by ordering the N pixels within the window according to feature (here intensity) i.e. (f1, f2, f3… fn).
| 12 |
and then subtracting the intensity values for two selected positions (i and j) within this ordered list such that range
| 13 |
When this is performed over the whole image, it may be represented by
| 14 |
where ‘g’ is the output image.
Thus the range filter is an extension of another local nonlinear filter, the rank filter, defined as
| 15 |
When this is performed over the whole image, it may be represented by
| 16 |
Therefore, subtracting Eqs. (14)–(16) gives
| 17 |
‘Saliency map’ generated by of our proposed technique has been shown in Fig. 5.
Fig. 5.
Top: input image, Bottom: saliency map generated by our proposed approach
When we are visiting the faces, first, attention and then recognition comes into the picture. Visual attention is more concern about the early vision. Therefore, in the process of visual attention, global features are more responsible than the local region features. But for the recognition, local region features are more important. In this work, saliency has been estimated on grayscale images containing multiple faces, therefore, intensity value is considered as central feature. Size of the faces is also considered for covering the intensity values over whole faces. Definitely, saliency modelling can be enhanced after considering many other features like colour, orientation, texture etc., but the overall proposed approach will be the same. Only the other features may be replaced or assembled with the intensity values.
Obtaining most salient face based on saliency comparison
Saliency score of the ‘Face 1’ is greater than rest all the faces of the input image as shown in Table 9. This indicates that Face 1 in the input image draws attention and hence giving more attraction to the viewers. So, in the process of face recognition, Face 1 will give more focus to viewer due to greater saliency and therefore our recognition ability will be enhancing towards this face (Fig. 6: Inscribed in Green Box).
Fig. 6.
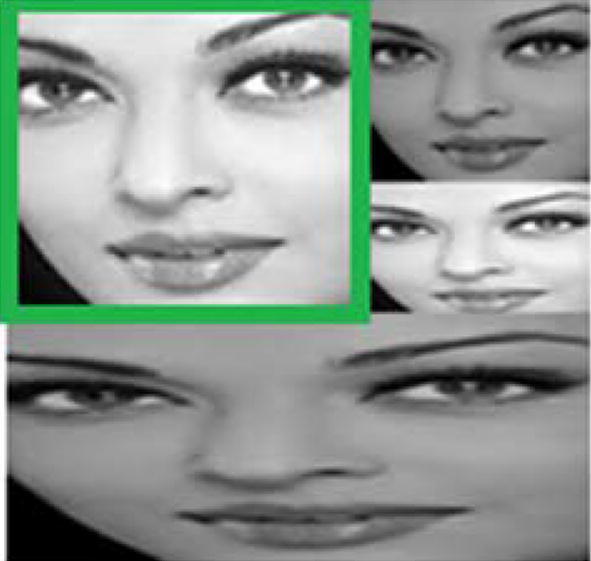
Most attentive face in crowd (inscribed in green box). (Color figure online)
Database description, experimental validation and results
Database description and experimental validation based on volunteers predictions
Database has been prepared after collecting the frontal face images from World Wide Web (WWW) and FEI dataset (Thomaz and Giraldi 2010). Saliency of the faces may vary with its different arrangements. This proposed method is applicable for any resolution of images with the condition that Viola Jones Algorithm (Viola and Jones 2004), is capable to detect the faces. In this experiment, the whole image resolution is varying between 240*240 pixels to 600*600 pixels and face resolutions varying between 25*25 pixels to 200*200 pixels. As Viola Jones algorithm perform well with the faces having resolution range between 24*24 pixels to 600*600 pixels. Regarding face selection, it should be mostly frontal, and not tilted by more than 45 degree of angle. Background objects critically affect the saliency of the faces, so image set of multiple faces have been prepared without any background so that it would be relevance and more right for this experiment.
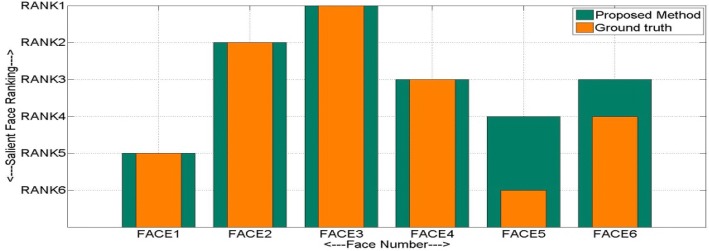
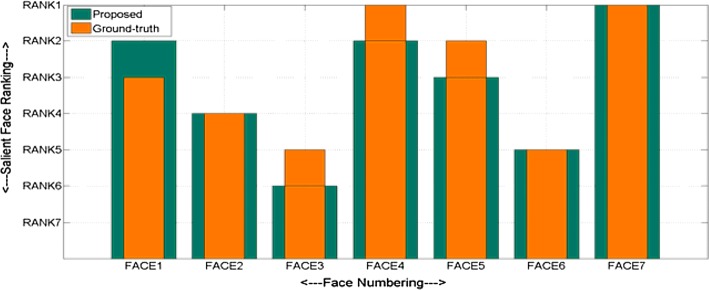
In order to validate the experiment with human vision system, ground truth data for all the input images has been prepared based on 75 person’s perceptions. The average saliency values of some input crowd image set based on human’s perception (Face Ranking by Volunteers) has been shown in Table 11. Human’s focus goes towards a face due to various low level and high-level features along with different facial emotions and expressions. In this preliminary stage of experiment, saliency of faces has been determined based on three parameters intensity, size and relative spatial distances. Parameters for handling the saliency due to face emotions and expressions have not been considered for the simplicity. Therefore, the database has been prepared with same faces of different sizes and intensities values. The reason for this is to maintaining the same expression and structure of faces. In this manner, we had made proper justification with our experiment in which saliency has been obtained without considering the expression and structure variations of faces. The saliency values of all the faces of some of the input image set using proposed method has been depicted in Table 12. For the better interpretation and comparison between the proposed technique with the prepared ground truth (Based on Volunteers perception), the saliency ranking of the corresponding faces has also been depicted in the ‘Ranking Graph’ (Figs. 8, 10, 12, 14) respectively.
Table 11.
Saliency of each face of the input image based on volunteers (ground truth)
Table 12.
Saliency of each face of the input image based on proposed method
Fig. 8.
Saliency ranking of faces depicted in Fig. 7, using proposed method (highlighted in green) and based on volunteers perception or ground truth (highlighted in orange colour). (Color figure online)
Fig. 10.
Saliency ranking of faces depicted in Fig. 9, using proposed method (highlighted in green) and based on volunteers perception or ground truth (highlighted in orange color). (Color figure online)
Fig. 12.
Saliency ranking of faces depicted in Fig. 11, using proposed method (highlighted in green) and based on volunteers perception or ground truth (highlighted in orange colour). (Color figure online)
Fig. 14.
Saliency ranking of Faces depicted in Fig. 13, using proposed method (highlighted in green) and based on volunteers perception or ground truth (highlighted in orange colour). (Color figure online)
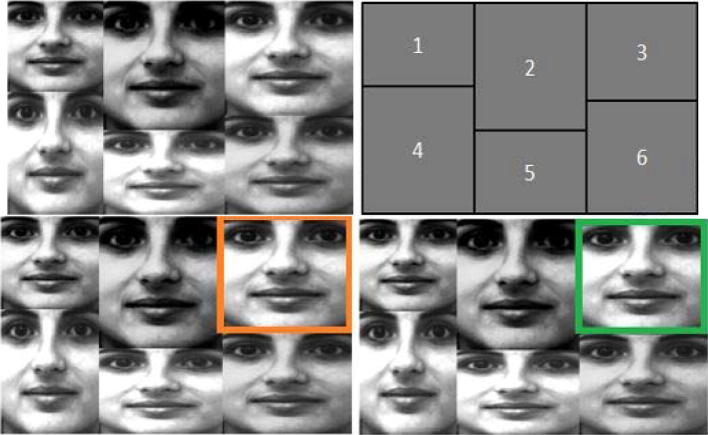
In Fig. 8, the saliency value of Face 1 has achieved the highest score. It means that based on overall effect of intensity, face area and intensity differences ‘Face 1’ is recommended as most salient among all the faces using proposed approach. On the basis of human perception (Ranking by Volunteers), ‘Face 1’ has also been achieved the highest saliency score.
Similarly, saliency ranking of faces (Figs. 10, 12, 14) based on the prepared ground truth along with our proposed approach have been shown for some more input images (Figs. 9, 11, 13). Saliency values of all the belonging faces (based on prepared ground truth and by proposed approach) have also been described in the Tables 11, 12.
Fig. 9.
Left top: input crowd image, right top: face numbering, left bottom: most salient face (inscribed in orange box) based on prepared ground truth, right bottom: most salient face (inscribed in green box) using proposed method. (Color figure online)
Fig. 11.
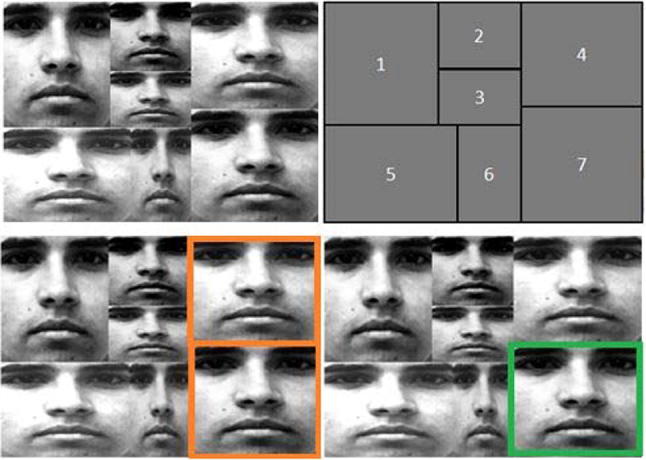
Left Top: input crowd image, Right Top: face numbering, Left Bottom: most salient face (inscribed in orange box) based on prepared ground truth, Right Bottom: most salient face (inscribed in green box) using proposed method. (Color figure online)
Fig. 13.
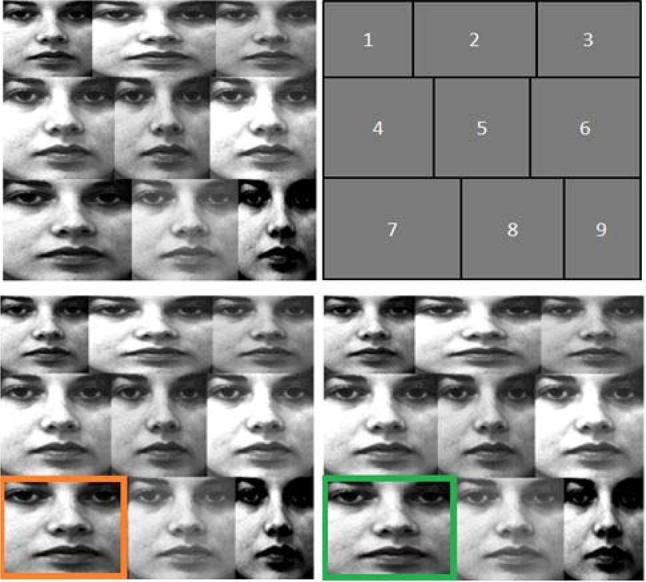
Left Top: input crowd image, Right Top: face numbering, Left Bottom: most salient face (inscribed in orange box) based on prepared ground truth, Right Bottom: most salient face (inscribed in green box) using proposed method. (Color figure online)
Saliency scores of all the faces in the given input crowd image on the basis of perception of volunteers (ground truth) has been depicted in Table 11. The percentage of number of volunteers selecting a face is considered as its ground truth saliency score. Human vision system is enough intelligent to find out the most salient, next most salient faces and so on. However, sometimes human visual system gets confused in the selection of most salient face among the multiple faces. Therefore, they are not very clear to assign the correct and exact saliency ranking for some of the faces in the crowd (or in a set of multiple faces). In this situation, some faces has been assigned same ranking in the volunteer’s view. So, for calculating ranking of faces, same volunteers may predict same ranking to many faces.
Normalized saliency scores (The maximum saliency score has been assign as ‘1’) of all the faces in the given input crowd image on the basis of proposed approach has been depicted in the Table 12.
In Table 11 (Based on Volunteer’s perception) and Table 12 (Based on our Method), it is found that Face 1, Face 3, Face 7 and Face 7 are the most salient faces corresponding to Figs. 7, 9, 11 and 13 respectively. In the ground truth (Table 11), for input image Fig. 11, Face 3 and Face 7 are equally most salient whereas using proposed method (Table 12), Face 7 is the most salient face. Therefore, for the given set of input crowd images proposed technique is almost achieving the similar accuracy with the prepared ground truth (Based on volunteer’s perception).
Fig. 7.
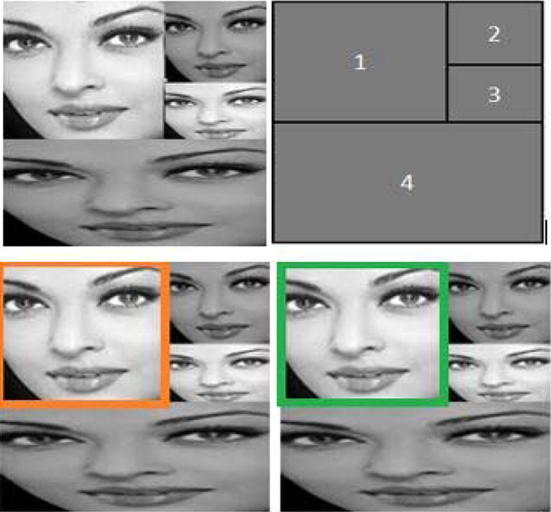
Left Top: input crowd image, Right Top: face numbering, Left Bottom: most salient face (inscribed in orange box) based on prepared ground truth, Right Bottom: most salient face (inscribed in green box) using proposed method. (Color figure online)
In the proposed technique relative saliency of faces has been calculated, which is not only based on face contrast difference (i.e. feature difference) but it also includes spatial arrangement and area covered by the faces. In Fig. 7, Face 1 is most salient after overall effect of relative face area, intensity differences and its impact due to proximity (Cartesian distances) with other faces in the crowd. Though the area of Face 4 is the largest among all other faces, Face 1 is found to the most salient due to significant domination of its intensity value with respect to other faces. Similarly, in Fig. 9, Face 3 has obtained the highest saliency value due to overall domination in intensity, area and impact of other faces over it. In Fig. 13, Face 7 is found as most salient among other faces due to significant domination in its larger face area, even though Face 6 has achieved the larger intensity difference than the rest of the faces.
Results obtained through our approach are validated with the volunteer’s perception and it exhibits satisfactory results.
Issues with existing methods
Observation 1
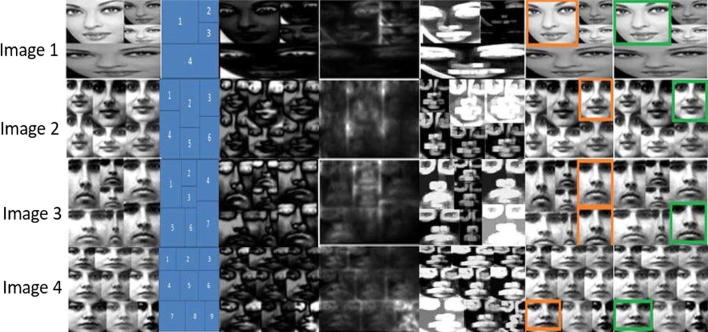
Computer modeling for finding the most salient face in the crowd is still a challenging task for the researchers. Saliency model for dealing with the faces has not been developed up to the mark. As far as saliency of object is concerned, many such models are available; those are described in the literature survey (Table 1). But while applying these models in the context of faces, they are not covering the whole individual face as a salient. The saliency maps of some of the state of art are depicted below, which are not indicating a complete face area as a salient. In these techniques (Goferman et al. 2012; Achanta et al. 2009), only the part of the faces are found to be salient. Therefore, these techniques are suitable for determining the saliency of regions but not the faces. As far as human vision system is concern, while attending salient face in the crowd, it does not focus some salient regions on the face but considers a whole particular face as a prominent. In deeper level of recognition of a particular face, it may focuses over the dominating components. Human vision system does not attend some salient locations on different faces at a time. Therefore, in the most of the cases results are not matching with the ground truth prepared based on human’s vision in the context of set of multiple faces.
In the above Fig. 15, saliency map using (Goferman et al. 2012; Achanta et al. 2009), has been depicted. In these state of art saliency models, the whole face part has not been signified as salient. But in our proposed saliency map, the salient face has been shown prominent as a whole face.
Fig. 15.
Input Image, corresponding face numbering, saliency map using (Achanta et al. 2009), saliency map using (Goferman et al. 2012), most salient face based on volunteers perception or ground truth (highlighted in orange box), most salient face using proposed method (highlighted in green box). (Color figure online)
Observation 2
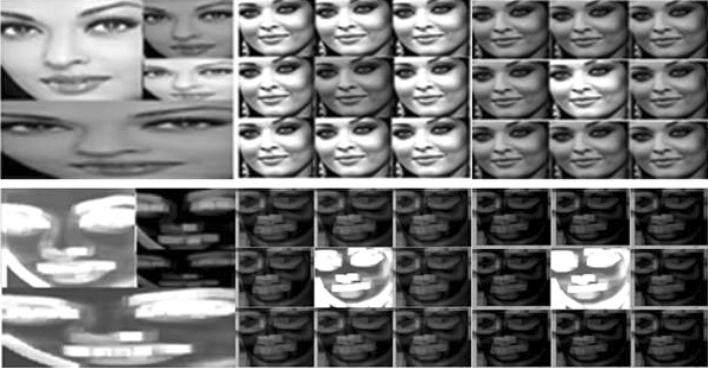
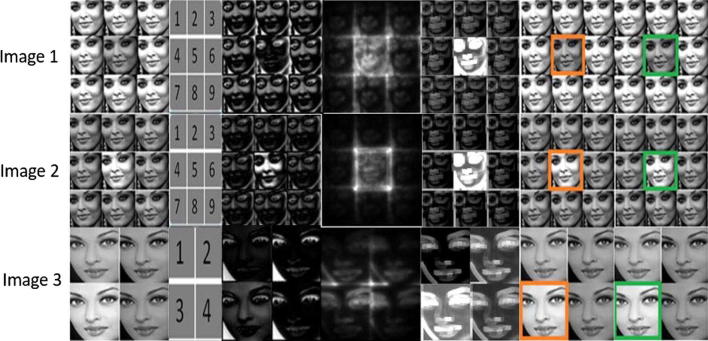
For validating this experiment more appropriately and accurately, the proposed approach has been tested with the set of multiple face images, which contain same size of faces having only two different values of intensities. In these images, same face (same size, but different intensity than the surrounding faces) has been taken at the centre as well as the surrounding (same size and intensities) places and vice versa. In this case, input image is more appropriate for validating the results obtained from our method with other existing methods.
In the first row of Fig. 16, as per the ground truth, central face (i.e. Face 5) is the most salient. But in the saliency map using (Achanta et al. 2009), it is shown as the least salient. In the second row of Fig. 16, along with our proposed method, both state-of-art methods (Goferman et al. 2012; Achanta et al. 2009) are also showing the good results. But in the last input image using Context Aware Saliency (Goferman et al. 2012), it is very difficult to visualize the most salient face. In this entire situation, salient face obtained through our proposed system is more arousal than the existing methods.
Fig. 16.
Input Image, corresponding face numbering, saliency map using (Achanta et al. 2009), saliency map using (Goferman et al. 2012), most salient face based on volunteers perception or ground truth (highlighted in orange box), most salient face using proposed method (highlighted in green box). (Color figure online)
Validating the saliency map based on intensity level of faces
We have validated our experiment in three levels. First level validation has been accomplished by comparing the ranking of the faces based on the obtained saliency scores with respect to score given by the volunteers (i.e. Ground truth). The first level validation has been briefly explained in the Section “Database description and experimental validation based on volunteers predictions”. In the second level of validation, intensity level of the faces in the obtained saliency map has been compared with the ranking of saliency scores (i.e. based on volunteer’s scores) as well as the saliency score obtained from our method. Saliency map represents the salient regions of a scene in terms of variation in intensity levels. Regions having the higher intensity values are considered as more salient. In order to testing and validating our saliency map, average intensity values of all the faces are computed. The normalized values of average saliency of the faces have been depicted in the Table 13. The corresponding bar graph of the obtained saliency map has been shown in Figs. 17, 18, 19, 20, 21, 22 and 23. As, from the concept of saliency map, we know that, the regions having the higher intensity level, resembles as more salient regions.
Table 13.
Intensity of each face of the proposed saliency map
| Proposed Saliency Map | Face 1 | Face 2 | Face 3 | Face 4 | Face 5 | Face 6 | Face 7 | Face 8 | Face 9 |
|---|---|---|---|---|---|---|---|---|---|
| Figure 17 (saliency map) | 1.00 | 0.19 | 0.09 | 0.80 | |||||
| Figure 18 (saliency map) | 0.39 | 0.91 | 1.00 | 0.49 | 0.45 | 0.50 | |||
| Figure 19 (saliency map) | 0.66 | 0.42 | 0.27 | 0.65 | 0.54 | 0.24 | 1.00 | ||
| Figure 20 (saliency map) | 0.40 | 0.67 | 0.47 | 0.75 | 0.59 | 0.67 | 1.00 | 0.56 | 0.39 |
| Figure 21(saliency map) | 0.24 | 0.25 | 0.23 | 0.23 | 1.00 | 0.25 | 0.24 | 0.26 | 0.25 |
| Figure 22 (saliency map) | 0.15 | 0.17 | 0.15 | 0.16 | 1.00 | 0.17 | 0.15 | 0.16 | 0.14 |
| Figure 23 (saliency map) | 0.20 | 0.57 | 1.00 | 0.56 |
In the part of cross validation, for most of the figures (Figs. 17, 18, 19, 20, 21, 22, 23), the generated saliency maps have been verified with obtained saliency score. The intensity score of the faces in the saliency maps has been found according as the saliency score ranking of the corresponding faces. For some other input image (Fig. 21), the intensity values of hardly one or two of the faces are little bit varies with the actual saliency ranking. But as this is a complex vision problem, so the marginal variation may be considered and acceptable at this basic level of experiment.
Validation of proposed saliency map based on evaluation metrics
In this section, proposed saliency map is validated on the basis of some standard saliency evaluation metrics namely Average Discrimination Ratio (ADR) (Hu et al. 2005) and Normalized Saliency (NS) (Peters and Itti 2007). In the perspective of this discussion Average discrimination ratio (ADR), is used to evaluate the distinctiveness between the salient and non salient faces. Here, the face having the highest saliency score (obtained through our technique) is considered as salient. Mathematically, ADR is expressed as:
| 18 |
where A and B stand for the set of pixels in the salient face and rest other faces, respectively. M (i, j) is 2D function which determines the pixel location in the saliency map. Here, i and j are discrete quantities. Moreover, the value of the function at any coordinate is any real value in the set of real numbers R.
In the context of our experiment, Normalized Saliency (NS) (Peters and Itti 2007), is similar to the average saliency score of pixels of the face when the saliency map has been normalized to comprise zero mean and unit standard deviation. Normalized Saliency (NS) is mathematically defined as:
| 19 |
where μM and σM are mean and standard deviation of the saliency map M, respectively.
In Table 14, ADR and NS values of the most salient faces obtained through methods (Achanta et al. 2009), (Goferman et al. 2012) and through our method are shown. We observe that for all the input images ADR and NS score of the salient face obtained through our method is higher than the methods (Achanta et al. 2009) and (Goferman et al. 2012). It shows the good performance and efficacy of our technique.
Table 14.
Normalized ADR and NS values comparision
| Figure no. | Most salient face based on ground truth (face no) | Saliency map using (Achanta et al. 2009) | Saliency map using (Goferman et al. 2012) | Our proposed saliency map | |||
|---|---|---|---|---|---|---|---|
| ADR | NS | ADR | NS | ADR | NS | ||
| 15 (Image 1) | 1 | 0.4913 | 0.2036 | 0.3743 | 0.1718 | 0.6734 | 0.8287 |
| 15 (Image 2) | 3 | 0.4678 | 0.6800 | 0.4277 | 0.4615 | 0.6154 | 2.0680 |
| 15 (Image 3) | 4 | 0.4269 | 0.5413 | 0.2978 | 0.3959 | 0.4582 | 1.1367 |
| 7 | 0.3938 | 0.5109 | 0.3678 | 0.3699 | 0.4327 | 1.0859 | |
| 15 (Image 4) | 7 | 0.4257 | 0.6302 | 0.4277 | 0.1903 | 0.5195 | 2.0906 |
| 16 (Image 1) | 5 | 0.4604 | 0.5678 | 0.8026 | 1.4742 | 0.7753 | 2.3466 |
| 16 (Image 2) | 5 | 0.7086 | 0.9233 | 0.8363 | 1.0340 | 0.8398 | 2.4379 |
| 16 (Image 3) | 3 | 0.6576 | 0.2361 | 0.6207 | 0.2212 | 0.6813 | 0.9418 |
Saliency variation with random position change
Attending a salient face in a set of multiple faces is a problem of relative saliency. It means saliency of a face gets affected by its surrounding or nearby faces. Therefore, a face may be salient in a particular arrangement of faces, which may not be as same salient, in the different arrangement. In other words, with random changes in the position of target face or the surrounding faces, saliency of all the faces may get changed or disturbed.
In Figs. 24, 25 and 26, position of the target face (highlighted in red boundary) has been changed. Attention of a face is highly affected by its feature dissimilarity and positional proximity with the neighbor faces. Therefore, this concept is incorporated in our saliency formulation.
Fig. 24.
Left: Input Image containing Target face at position 3 (inscribed in red boundary), middle: Input Image containing Target face at position 2 (inscribed in red boundary), right: face numbering. (Color figure online)
Fig. 25.
Left: input image containing target face at position 5 (inscribed in red boundary), First Middle: input image containing Target face at position 6 (Inscribed in red boundary), Second Middle: input image containing target face at position 9 (inscribed in red boundary), Right: face numbering. (Color figure online)
Fig. 26.
Left: input image containing target face at position 5 (inscribed in red boundary), First Middle: input image containing target face at position 6 (inscribed in red boundary), Second Middle: input image containing target face at position 9 (inscribed in red boundary), Right: face numbering. (Color figure online)
In our results (Tables 15, 16), we have also found the variation in the saliency score with the random change in location of the target face. Moreover, saliencies scores of other faces are also get affected due to changes in the position of the target face.
Table 15.
Saliency of target face (marked in red) of Fig. 24
| Face position | 1 | 2 | 3 | 4 |
|---|---|---|---|---|
| Saliency (Left Image) | 1.0000 | 0.1965 | 0.0946 | 0.9837 |
| Saliency (Right Image) | 1.0000 | 0.0632 | 0.1563 | 0.9078 |
Table 16.
| Face position | 1 | 2 | 3 | 4 | 5 | 6 | 7 | 8 | 9 |
|---|---|---|---|---|---|---|---|---|---|
| Saliency (left image) | 0.3647 | 0.4575 | 0.3647 | 0.4550 | 1.0000 | 0.4550 | 0.3647 | 0.4575 | 0.3647 |
| Saliency (middle image) | 0.4130 | 0.5452 | 0.4720 | 0.5139 | 0.6745 | 1.0000 | 0.4130 | 0.5452 | 0.4720 |
| Saliency (right image) | 0.4911 | 0.6305 | 0.5262 | 0.6265 | 0.8126 | 0.6997 | 0.5242 | 0.7015 | 1.0000 |
In Fig. 24, position of target face (indicated in red boundary) of left and right side images are available at location 3 and 2 respectively. In Table 15, we can easily observe that the saliency score of the target face has been drastically changed (from 0.0946 to 0.0632) with it changed position. As saliency is a relative term, therefore, saliency score of other faces also get affected due to changed position of the target face, which can also be observed in the Table 15. Saliency score has been normalized after dividing it by maximum value, therefore, maximum saliency is taken as 1.
Similarly, in Figs. 25 and 26, saliency score of the corresponding non salient faces is varying with its changed positions of the target faces 5, 6 and 9 (indicated in red boundary) respectively, which is described in the Table 16. Saliency score of the target face is found to be maximum at every location. Since the saliency scores has been normalized after dividing it by maximum value, therefore, everywhere it is found to be 1. Saliency of the corresponding faces of Figs. 25 and 26 are found to be same, because aggregated feature differences as well as spatial distances are same. It is also well justified through a real time example that a black bird is salient in the white sky as similar as white bird is found to be salient in the black sky.
Merits and limitations of proposed method
Merits
The merits of our proposed method over existing methods lie in the following points.
Unlike existing state of art (Which shows the salient regions over some discrete pixels of a face), saliency map generated by our gives visualization of the whole face.
Saliency function has been modelled in the combination of logarithmic and exponential form that gives clear picture of relatively increasing or decreasing nature of saliency, which gives better visualization of “cause and effect”(Explained in Section “Mathematical formulation of problem based on the real observation of human”, Notes 1 and 2).
In addition of low level features, spatial proximities and size differences among the faces have also been considered.
In the formation of saliency map, saliency score of the faces has been mapped to every pixel of the concerned faces as a result it provides good results with respect to ground truth.
Limitations
The proposed algorithm works with the set of multiple faces (Arrangement of faces) images. It doesn’t work with the face images in the complex crowd. The main problem is in detecting the faces and therefore face size, intensity and their spatial proximities cannot be determined.
Proposed method has been developed for gray scale face images only.
Conclusion
This paper proposed an innovative technique for attending the salient face in the set of multiple faces. Relative saliency of faces has been calculated based on feature differences, face area difference and modulated with the spatial distances. Perceptual connectivity graph has been formed which determine to focus a particular face in the crowd which has more ‘relative perceptual connectivity’ with respect to other face. This proposal is a small attempt to mimic the way; human’s attention goes towards the salient face while attending a crowd. Trial has been conducted on the gray-scale images. Therefore, intensity is measured as the central feature. Supplementary features like colour, orientation etc., contributing to the saliency have been ignored, in this work, for the simplicity. At this stage impact on saliency due to face expressions and background distraction has also been ignored. So, database has been prepared with same face expression, without any background but with variation in intensity, face area and the spatial location. The ground truth data has been prepared based on volunteer’s perception. Experiment has been validated at three levels. In the first level, obtained results have been validated with the ground truth data. In the second level of validation, cross validation has been done for the generated saliency map. In the third level, the results are validated with some standard saliency evaluator parameters known as Average Discrimination Ratio (ADR) and Normalized Saliency (NS). The proposed technique have achieved good accuracy with the prepared ground truth in terms of finding the most salient face in the given set of faces.
With the gray scale image, feature (intensity), this experiment giving an effective result. So future work can be extending with colour image by including others saliency feature like orientation, RGB value, texture etc.
Contributor Information
Ravi Kant Kumar, Email: vit.ravikant@gmail.com.
Jogendra Garain, Email: jogs.cse@gmail.com.
Dakshina Ranjan Kisku, Email: drkisku@gmail.com.
Goutam Sanyal, Email: nitgsanyal@gmail.com.
References
- Achanta R, Hemami S, Estrada F, Susstrunk S (2009) Frequency-tuned salient region detection. In: IEEE conference on computer vision and pattern recognition, 2009. CVPR 2009. IEEE, pp 1597–1604
- Bailey DG, Hodgson RM. Range filters: localintensity subrange filters and their properties. Image Vis Comput. 1985;3(3):99–110. [Google Scholar]
- Bakouie F, Pishnamazi M, Zeraati R, Gharibzadeh S. Scale-freeness of dominant and piecemeal perceptions during binocular rivalry. Cognit Neurodyn. 2017;11(4):319–326. doi: 10.1007/s11571-017-9434-4. [DOI] [PMC free article] [PubMed] [Google Scholar]
- Borji A, Itti L (2012) Exploiting local and global patch rarities for saliency detection. In: 2012 IEEE conference on computer vision and pattern recognition (CVPR). IEEE, pp 478–485
- Cheng MM, Mitra NJ, Huang X, Hu SM. Salientshape: group saliency in image collections. Vis Comput. 2014;30(4):443–453. [Google Scholar]
- Cheng MM, Mitra NJ, Huang X, Torr PH, Hu SM. Global contrast based salient region detection. IEEE Trans Pattern Anal Mach Intell. 2015;37(3):569–582. doi: 10.1109/TPAMI.2014.2345401. [DOI] [PubMed] [Google Scholar]
- Comaniciu D, Meer P. Mean shift: a robust approach toward feature space analysis. IEEE Trans Pattern Anal Mach Intell. 2002;24(5):603–619. [Google Scholar]
- Cootes TF, Taylor CJ, Cooper DH, Graham J. Active shape models-their training and application. Comput Vis Image Underst. 1995;61(1):38–59. [Google Scholar]
- Cordiner A, Ogunbona P, Li W (2009) Face detection using generalised integral image features. In: 2009 16th IEEE international conference on image processing (ICIP). IEEE, pp 1229–1232
- Di Maio V, Santillo S, Sorgente A, Vanacore P, Ventriglia F. Influence of active synaptic pools on the single synaptic event. Cognit Neurodyn. 2018;12(4):391–402. doi: 10.1007/s11571-018-9483-3. [DOI] [PMC free article] [PubMed] [Google Scholar]
- Frintrop S, Rome E, Christensen HI. Computational visual attention systems and their cognitive foundations: a survey. ACM Trans Appl Percept (TAP) 2010;7(1):6. [Google Scholar]
- Goferman S, Zelnik-Manor L, Tal A. Context-aware saliency detection. IEEE Trans Pattern Anal Mach Intell. 2012;34(10):1915–1926. doi: 10.1109/TPAMI.2011.272. [DOI] [PubMed] [Google Scholar]
- Gottumukkal R, Asari VK. An improved face recognition technique based on modular PCA approach. Pattern Recognit Lett. 2004;25(4):429–436. [Google Scholar]
- Harel J, Koch C, Perona P (2006) Graph-based visual saliency. In: NIPS, vol 1, no 2, p 5
- Heisele B, Ho P, Wu J, Poggio T. Face recognition: component-based versus global approaches. Comput Vis Image Underst. 2003;91(1):6–21. [Google Scholar]
- Hu Y, Rajan D, Chia LT (2005) Adaptive local context suppression of multiple cues for salient visual attention detection. In: 2005 IEEE international conference on multimedia and expo. IEEE, p 4
- Itti L (2000) Models of bottom-up and top-down visual attention. Doctoral dissertation, California Institute of Technology
- Itti L, Koch C. A saliency-based search mechanism for overt and covert shifts of visual attention. Vis Res. 2000;40(10):1489–1506. doi: 10.1016/s0042-6989(99)00163-7. [DOI] [PubMed] [Google Scholar]
- Itti L, Koch C. Computational modelling of visual attention. Nat Rev Neurosci. 2001;2(3):194–203. doi: 10.1038/35058500. [DOI] [PubMed] [Google Scholar]
- Itti L, Koch C, Niebur E. A model of saliency-based visual attention for rapid scene analysis. IEEE Trans Pattern Anal Mach Intell. 1998;20(11):1254–1259. [Google Scholar]
- Jafri R, Arabnia HR. A survey of face recognition techniques. JIPS. 2009;5(2):41–68. [Google Scholar]
- Jiang M, Xu J, Zhao Q (2014) Saliency in crowd. In: European conference on computer vision. Springer, Cham, pp 17–32
- Kant Kumar R, Garain J, Ranjan Kisku D, Sanyal G (2018) Estimating attention of faces due to its growing level of emotions. In: Proceedings of the IEEE conference on computer vision and pattern recognition workshops, pp 1952–1960
- Kirby M, Sirovich L. Application of the Karhunen-Loeve procedure for the characterization of human faces. IEEE Trans Pattern Anal Mach Intell. 1990;12(1):103–108. [Google Scholar]
- Koch C, Ullman S. Shifts in selective visual attention: towards the underlying neural circuitry. In: Vaina LM, editor. Matters of intelligence. Dordrecht: Springer; 1987. pp. 115–141. [PubMed] [Google Scholar]
- Kucerova J (2011) Saliency map augmentation with facial detection. In: Proceedings of the 15th Central European seminar on computer graphics
- Kumar RKGarain J, Kisku DR, Sanyal G (2015) A novel approach to enlighten the effect of neighbor faces during attending a face in the crowd. In: TENCON 2015-2015 IEEE Region 10 conference. IEEE, pp 1–4
- Kumar RK, Garain J, Sanyal G, Kisku DR. Estimating normalized attention of viewers on account of relative visual saliency of faces (NRVS) Int J Softw Eng Appl. 2015;9(7):85–92. [Google Scholar]
- Kumar RK, Garain J, Kisku DR, Sanyal G. Constraint saliency based intelligent camera for enhancing viewers attention towards intended face. Pattern Recognit Lett. 2018 [Google Scholar]
- Langton SR, Law AS, Burton AM, Schweinberger SR. Attention capture by faces. Cognition. 2008;107(1):330–342. doi: 10.1016/j.cognition.2007.07.012. [DOI] [PubMed] [Google Scholar]
- Lawrence S, Giles CL, Tsoi AC, Back AD. Face recognition: a convolutional neural-network approach. IEEE Trans Neural Netw. 1997;8(1):98–113. doi: 10.1109/72.554195. [DOI] [PubMed] [Google Scholar]
- Li J, Tian Y, Huang T. Visual saliency with statistical priors. Int J Comput Vis. 2014;107(3):239–253. [Google Scholar]
- Martinez-Conde S, Macknik SL, Hubel DH. The role of fixational eye movements in visual perception. Nat Rev Neurosci. 2004;5(3):229–240. doi: 10.1038/nrn1348. [DOI] [PubMed] [Google Scholar]
- Mateos DM, Erra RG, Wennberg R, Velazquez JP. Measures of entropy and complexity in altered states of consciousness. Cognit Neurodyn. 2018;12(1):73–84. doi: 10.1007/s11571-017-9459-8. [DOI] [PMC free article] [PubMed] [Google Scholar]
- Min X, Zhai G, Gu K, Liu J, Wang S, Zhang X, Yang X. Visual attention analysis and prediction on human faces. Inf Sci. 2017;420:417–430. [Google Scholar]
- Min X, Zhai G, Gu K, Yang X. Fixation prediction through multimodal analysis. ACM Trans Multimedia Comput Commun Appl (TOMM) 2017;13(1):6. [Google Scholar]
- Nefian AV, Hayes MH (1998) Hidden Markov models for face recognition. In: Proceedings of the 1998 IEEE international conference on acoustics, speech and signal processing, 1998, vol 5. IEEE, pp 2721–2724
- Pal R, Mukherjee A, Mitra P, Mukherjee J. Modelling visual saliency using degree centrality. IET Comput Vis. 2010;4(3):218–229. [Google Scholar]
- Pal R. Computational models of visual attention: a survey. In: Srivastava R, Singh SK, Shukla KK, editors. Research developments in computer vision and image processing: methodologies and applications. 1. USA: IGI Global; 2014. pp. 54–76. [Google Scholar]
- Peters RJ, Itti L (2007) Beyond bottom-up: Incorporating task-dependent influences into a computational model of spatial attention. In: IEEE conference on computer vision and pattern recognition, 2007. CVPR’07. IEEE, pp 1–8
- Riche N, Mancas M, Duvinage M, Mibulumukini M, Gosselin B, Dutoit T. A multi-scale rarity-based saliency detection with its comparative statistical analysis. Signal Process Image Commun. 2013;28(6):642–658. [Google Scholar]
- Roy S, Mitra P (2016) Visual saliency detection: a Kalman filter based approach. arXiv preprint arXiv:1604.04825
- Salah AA, Alpaydin E, Akarun L. A selective attention-based method for visual pattern recognition with application to handwritten digit recognition and face recognition. IEEE Trans Pattern Anal Mach Intell. 2002;24(3):420–425. [Google Scholar]
- Tang C, Wang P, Zhang C, Li W. Salient object detection via weighted low rank matrix recovery. IEEE Signal Process Lett. 2017;24(4):490–494. [Google Scholar]
- Thomaz CE, Giraldi GA. A new ranking method for principal components analysis and its application to face image analysis. Image Vis Comput. 2010;28(6):902–913. [Google Scholar]
- Tolba AS, El-Baz AH, El-Harby AA. Face recognition: a literature review. Int J Signal Process. 2006;2(2):88–103. [Google Scholar]
- Urakawa T, Bunya M, Araki O. Involvement of the visual change detection process in facilitating perceptual alternation in the bistable image. Cognit Neurodyn. 2017;11(4):307–318. doi: 10.1007/s11571-017-9430-8. [DOI] [PMC free article] [PubMed] [Google Scholar]
- Viola P, Jones M (2001) Rapid object detection using a boosted cascade of simple features. In: Proceedings of the 2001 IEEE computer society conference on computer vision and pattern recognition, 2001. CVPR 2001, vol 1. IEEE, pp I–I
- Viola P, Jones MJ. Robust real-time face detection. Int J Comput Vis. 2004;57(2):137–154. [Google Scholar]
- Võ MLH, Smith TJ, Mital PK, Henderson JM. Do the eyes really have it? Dynamic allocation of attention when viewing moving faces. J Vis. 2012;12(13):3. doi: 10.1167/12.13.3. [DOI] [PubMed] [Google Scholar]
- Wang J, Yin L, Moore J. Using geometric properties of topographic manifold to detect and track eyes for human-computer interaction. ACM Trans Multimed Comput Commun Appl (TOMM) 2007;3(4):3. [Google Scholar]
- Wang Q, Zheng W, Piramuthu R (2016) Grab: visual saliency via novel graph model and background priors. In: Proceedings of the IEEE conference on computer vision and pattern recognition, pp 535–543
- Wei H, Dai D, Bu Y. A plausible neural circuit for decision making and its formation based on reinforcement learning. Cognit Neurodyn. 2017;11(3):259–281. doi: 10.1007/s11571-017-9426-4. [DOI] [PMC free article] [PubMed] [Google Scholar]
- Yang P (2011) Facial expression recognition and expression intensity estimation. Doctoral dissertation, Rutgers University-Graduate School-New Brunswick
- Zanca D, Gori M (2017) Variational laws of visual attention for dynamic scenes. In: Proceedings of the 2017 neural information processing systems, 2017, NIPS 2017, pp 3823–3832
- Zhang L, Yang C, Lu H, Ruan X, Yang MH. Ranking saliency. IEEE Trans Pattern Anal Mach Intell. 2017;39(9):1892–1904. doi: 10.1109/TPAMI.2016.2609426. [DOI] [PubMed] [Google Scholar]
- Zhang J, Ehinger KA, Wei H, Zhang K, Yang J. A novel graph-based optimization framework for salient object detection. Pattern Recognit. 2017;64:39–50. [Google Scholar]
- Zhao W, Chellappa R, Phillips PJ, Rosenfeld A. Face recognition: a literature survey. ACM Comput Surv (CSUR) 2003;35(4):399–458. [Google Scholar]
- Zhao Q, Ge SS, Ye M, Liu S, He W. Learning saliency features for face detection and recognition using multi-task network. Int J Soc Robot. 2016;8(5):709–720. [Google Scholar]
- Zhu X, Tang C, Wang P, Xu H, Wang M, Chen J, Tian J. Saliency detection via affinity graph learning and weighted manifold ranking. Neurocomputing. 2018;312:239–250. [Google Scholar]
- Zommara NM, Takahashi M, Ounjai K, Lauwereyns J. A gaze bias with coarse spatial indexing during a gambling task. Cognit Neurodyn. 2018;12(2):171–181. doi: 10.1007/s11571-017-9463-z. [DOI] [PMC free article] [PubMed] [Google Scholar]


