Abstract
Aims:
We provide evidence that the use of perfusion imaging reveals the neuroanatomical basis for a behaviourally demonstrated cognitive deficit that is not revealed via standard neuroradiological imaging techniques.
Methods & Procedures:
We present a case study of a 52-year-old female stroke survivor (16 years post onset) whose speech was fluent and grammatical with some word-finding difficulties that were typically overcome with common circumlocution strategies. Based on standardised measures, the patient’s clinical diagnosis was anomie aphasia. In addition to word-finding deficits, it was discovered that this patient also demonstrated difficulties in reading; while able to eventually read and understand text, there was extreme difficulty in completing such tasks. A series of experimental findings exploring this reading deficit are presented. This patient’s lesion, as revealed via structural brain imaging, did not involve a brain region typically implicated in reading dysfunction. This behaviour-lesion inconsistency was explored via perfusion MRI technology as a means of assessing whether other neural regions not directly implicated in the structural scans (such as the angular gyros) could in fact show some level of dysfunction.
Outcomes & Results: Behavioural.
Analysis of the patient’s overall reading time demonstrated that as compared to a matched control, this patient took significantly more time in reading paragraphs both silently and aloud. In addition, the patient produced more errors (fillers, pauses, elongations) than the matched control during the reading paragraphs aloud and story-retelling conditions. There were no differences exhibited between the patient and control with respect to content accuracy produced during these conditions.
Outcomes & Results: Neuroradiological.
Structural images demonstrate damage to the left basal ganglia and surrounding white matter with sparing of the left insular cortex. Collection of perfusion images (pulsed arterial spin labelling) clearly demonstrates hypoperfusion in the seemingly intact brain regions of the left angular gyros and the left supramarginal gyrus.
Conclusions:
This paper presents evidence from a detailed case study that the use of perfusion imaging successfully reveals the neural basis for a reading deficit in a stroke survivor that is not revealed via standard “structural” neuroradiological imaging techniques. We argue for more standardised use of perfusion imaging, in that it reveals a brain basis for “functional lesions”, which less sensitive neuroimaging measures often fail to capture.
With the advent of modern neuroimaging technologies, researchers have become able to provide increasingly detailed characterisations of neural architecture underlying cognitive function in the human brain. However, the ever-increasing library of neuroimaging techniques brings with it considerable variety in the level of sensitivity to behavioural/cognitive function. In the work presented in this paper, we provide evidence that the use of perfusion imaging (a direct quantitative measure of regional cerebral blood flow) reveals the brain basis for a behaviourally demonstrated cognitive deficit that is not revealed via standard neuroradiological (structural, magnetisation prepared rapid gradient echo [MPRAGE]) imaging techniques. We argue for more standardised use of perfusion imaging, in that it is sensitive to subtle cognitive disruptions caused by slowed or reduced blood distribution to a neural region that does not appear to be damaged when viewed via standard structural scans. This slowed and/or reduced blood flow can result in “functional lesions” with serious cognitive consequences, producing behavioural deficits that may have no obvious neural basis when examined via standard structural imaging techniques.
In particular, we present a case study of a stroke survivor with a reading impairment whose lesion, as revealed via structural brain imaging, did not involve a brain region typically implicated in reading dysfunction. This behaviour-lesion inconsistency was explored via perfusion MRI technology as a means of assessing whether other neural regions not directly implicated in the structural scans (such as the angular gyrus) could in fact show some level of dysfunction. In this case, perfusion imaging did in fact reveal hypoperfusion in the angular gyrus of this patient, an area that has been highly implicated in various components of the complex reading process such as orthography-to-phonology conversion, lexical-semantics, and the orthographic input lexicon (Demonet et al., 1992; Goodglass & Wingfield, 1997; Hillis et al., 2001; Small, Flores, Kendall, & Noll, 1998).
CASE REPORT
Patient EN1 was referred to the Laboratory for Research on Aphasia and Stroke (LRAS) at The University of California at San Diego (UCSD) with the major complaint of continuing word-finding difficulties following stroke. EN sustained a unilateral left hemisphere infarct in 1982, 16 years prior to testing at LRAS. As a result of the stroke, EN has a right side hemiparesis that requires a brace on the right leg, allowing EN to walk without the assistance of a cane. There is also marked weakness in EN’s right arm. EN’s education level was 14 years (2 years of college had been completed) and was 52 years old at the time of testing. Neuroradiological findings from standard magnetic resonance imaging (MPRAGE), performed upon examination at LRAS, revealed damage to the left basal ganglia and surrounding white matter with sparing of the left insular cortex (see Figure 1).
Figure 1.
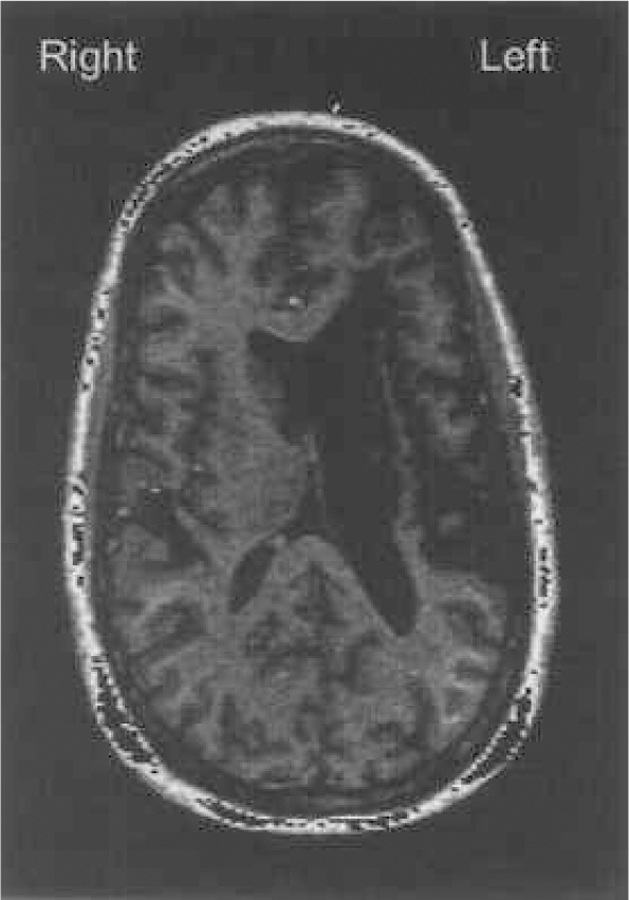
Axial MPRAGE image collected on a GE 1.5T SIGNA scanner at UCSD Medical Center. This representative slice is taken at inferior 41.7mm (slice 84/124). The enlarged dark area adjacent to the left ventricle represents the damaged regions (including the basal ganglia and deep white matter) that have been replaced by CSF. Note the sparing of the insula which appears as a thin ribbon of tissue.
As part of established behavioural protocol, the patient’s cognitive abilities were assessed with a large range of standardised measures that are widely used to diagnose behavioural and linguistic deficits resulting from neural trauma. These assessments included (among many others) the Boston Diagnostic Aphasia Examination (Goodglass & Kaplan, 1972), the Boston Naming Test (Goodglass & Kaplan, 1972), Albert’s Test of Spatial Neglect (Albert, 1973), and the Subject relative, Object relative, Active, Passive screening battery (SOAP) (Love & Oster, in press). The most relevant parts of these measures are reported next.
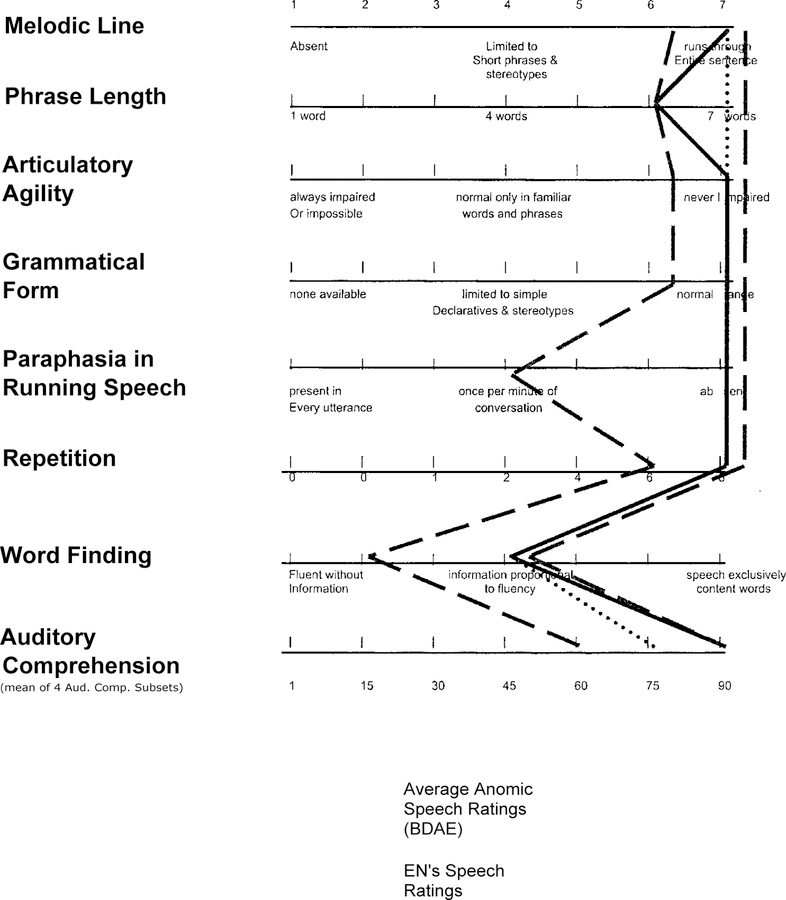
At the time of language testing, EN’s speech was fluent and grammatical with some word-finding difficulties which were typically overcome with common circumlocution strategies, warranting a score on the BDAE Aphasia Severity Rating Scale of 4 (some obvious loss of fluency in speech without significant limitation on ideas expressed or form of expression). As can be seen on the BDAE profile (Figure 2), EN’s performance on the auditory comprehension sections of the BDAE was flawless, with scoring of 100% on the repetition section for both high- and low-frequency phrases. On the reading subtests, EN scored 30/30 on word reading, 10/10 on oral sentence reading, and 9/10 on word-picture matching. EN correctly named 47 of 60 items in the Boston Naming Test (Goodglass & Kaplan, 1972) under a first-response criterion, although it was noted that the latency in subject response increased approximately three-fold for the last third of the test items (as compared to the average latency over the first two-thirds of the items).
Figure 2.
Boston Diagnostic Aphasia Examination Rating Scale Profile of Speech Characteristics. The dashed lines represent the range of ratings on the Speech Profiles characteristics of this disorder. The dotted line represents the mean ratings of anomie aphasics from the BDAE. The solid line represents EN’s BDAE profile.
The standard profile based on these measures suggested that EN was an anomic aphasic (see BDAE profile, Figure 2) with spared spatial functioning (e.g., see Figure 3), and with generally normal auditory syntax and language comprehension and use (e.g., see Figure 4).
Figure 3.
Visual Spatial Tests. Left to right: Albert’s Line Crossing Task; BDAE Clock; Scene Copy Task. These demonstrate EN’s intact visuo-spatial abilities.
Figure 4.
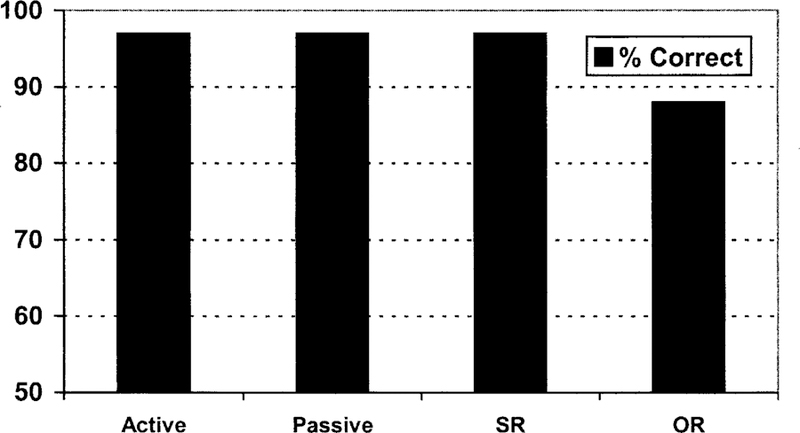
EN’s performance on the S.O.A.P. syntax battery-an assessment tool that measures the syntactic comprehension abilities of brain-damaged populations on four syntactic construction types: active, passive, subject relative (SR), and object relative (OR). In all conditions (including the object-relative condition), EN demonstrated unimpaired syntactic comprehension.
DETAILED INVESTIGATION OF READING DISRUPTION
One troubling aspect of this participant’s behavioural repertoire that was not directly reflected in any of the standardised tests, but which stood out to clinical observers/testers, was a specific type of difficulty in reading; while EN was able to eventually successfully read and understand text in the standardised tests, she had extreme difficulty in completing such tasks (EN took between three and four times the “normal” reading time to complete these tasks). EN did not evidence any equivalent time-to-completion difficulties in any testing area that did not involve reading. Again, this characteristic, while apparent to clinicians and investigators, was not easily quantifiable in standard language assessments (e.g., the BDAE), as the demonstrated difficulties did not “officially” warrant a label of alexia, etc.
In order to better understand these reading comprehension difficulties, a special reading comprehension test was designed which would allow us to better assess the patient’s timing and comprehension in both silent and reading-aloud situations.
Methods
Materials.
Stimuli were adapted from reading passages in a normed discourse comprehension battery (Brookshire & Nicholas, 1993). The adaptation involved creating two matched sets of “short” paragraphs and two matched sets of “long” paragraphs. Each of the “short” sets contained two paragraphs averaging 51 words. Each of the “long” sets contained two paragraphs averaging 200 words. One of the matched “short” sets and one of the matched “long” sets were presented in each of the silent and reading-aloud conditions. Thus EN and an unimpaired control subject (age 53, high-school graduate) received a total of eight passages (two short silent reading; two short reading-aloud; two long silent reading; two long reading-aloud). The control subject was randomly chosen from an age- and socioeconomic-matched population.
Procedure.
All conditions were videotaped. After completing each reading condition (silent or aloud), the participants were instructed to retell the story (without looking back for reference). The amount of time it took to complete the reading of the paragraphs (both silent and aloud) was recorded. In addition, the types of errors in the reading-aloud and retell conditions were also recorded and categorised in terms of content accuracy (main ideas and details) and production errors: number of hesitations (pauses), reading errors such as fillers (“um”), extra pauses, elongation of words, and false starts.
Behavioural results
Timing
Analysis of the reading time evidenced in this study verified the previous clinical observation that EN took significantly more time in completing both the silent reading and reading-aloud tasks than did the matched (unimpaired) control participant.2 As can be seen in Table 1, EN’s reading time varied between two and four times longer than the matched control, depending on condition. As shown in Table 1, there is an overall significant effect of reading time in each of the basic reading conditions (reading silently, t = 2.28, p = .05; and reading aloud, t = 2.58, p = .04). This effect is also significant in three of the four individual conditions (short paragraph, reading silently, t1 = 1.429, p < .2; short paragraph, reading aloud, t1 > 636.619, p < .0001; long paragraph, reading silently, t1 = 51.667, p < .006; long paragraph, reading aloud, t1 = 299.0, p < .001).
TABLE 1.
Reading times for both the silent and reading-aloud conditions in seconds
| EN |
Control |
|||
|---|---|---|---|---|
| Short | Long | Shorl | Long | |
| Reading silently | 20 | 110 | 10 | 32 |
| Reading aloud | 43 | 200 | 13 | 51 |
Average time (seconds) begin to end.
Comprehension retell
There were no significant differences between the unimpaired control subject’s and EN’s ability to retell the main ideas and details (content accuracy) specified in the short or long paragraphs for both the silent reading and the reading-aloud conditions (t5 = 9.167, p = .2157; t5 = 7.667, p = .1084, respectively) (see Figure 5). Therefore, as far as a measure of comprehension via retelling of content accuracy in stories, EN shows no impairment in fact comprehension.
Figure 5.
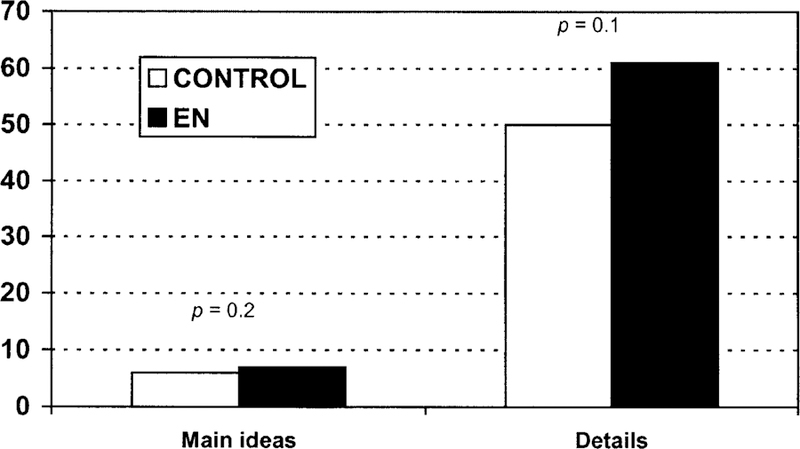
Patterns of comprehension for main ideas and details for both short and long paragraphs. The significance values are posted above each comparison between EN’s performance and that of an age-matched control subject.
Production errors in verbal output
Reading-aloud condition.
There was a dramatic difference in the number and types of production errors EN produced in both the short and long paragraphs, in comparison to the unimpaired control subject. Figure 6 demonstrates that in the relevant reading-aloud conditions (two short paragraphs and two long paragraphs), EN produced significantly more fillers, pauses (number of interclausal pauses lasting more that 1 minute), and elongations, with a trend towards more false starts as compared to the control participant (t3 = 2.941, p < .03; t3 = 2.721 p < .04; t3 = 3.518, p < .02; t3 = 1.890, p < .077 respectively).
Figure 6.
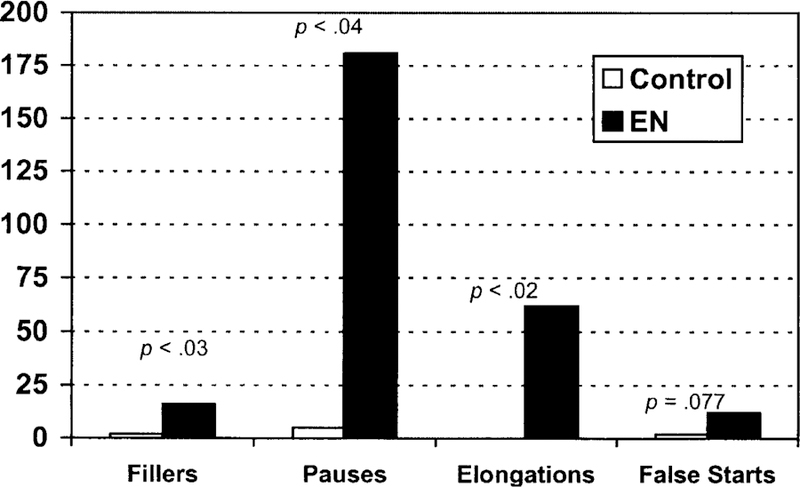
Patterns of errors on the reading-aloud task. Significance values are posted above each comparison between EN’s performance and that of an age-matched control subject.
Retelling of stories.
In looking at the types of production errors described earlier in the relevant conditions (reading-aloud: two short paragraphs and two long paragraphs; reading silently, two short paragraphs and two long paragraphs) a similar pattern of effects is demonstrated during the retell portion of the study.
Figure 7 demonstrates that EN produced significantly more fillers, pauses (number of interclausal pauses lasting more that 1 minute), and elongations as compared to the age-matched control (t3 = 4.416, p < .01; t3 = 3.111, p < .03; t3 = 4.284, p < . 02, respectively). No significant effect was found with the number of false starts produced by EN (t3 = 1.269, p = .15).
Figure 7.
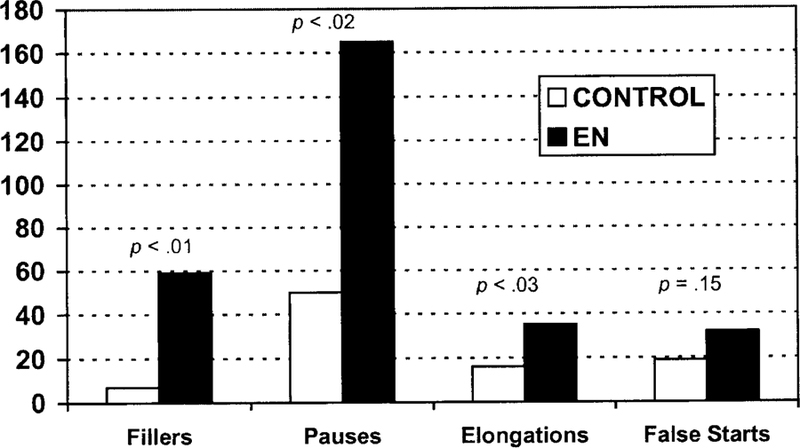
Patterns of errors on the retell task across short and long paragraphs. The significance values are posted above each comparison between EN’s performance and that of an age-matched control subject.
In order to rule out the possible confound that EN simply couldn’t repeat what had been read aloud due to some type of task “interference” related to producing speech, a follow-up study was performed a number of months after the initial exposure to these materials. In this study, EN was read two of the long paragraphs from the study line by line and was simply asked to repeat what was heard verbatim. EN made fewer than 6% production errors on this repetition task, with the errors mainly consisting of substitution errors (“she” for “the woman” or “a job” instead of “their job”). Thus the problems demonstrated in the reading task are not those of interference in task performance.
The clear and easily observable reading difficulty demonstrated by EN was not seen in other parts of the language-processing protocols that did not involve reading. Additionally, there was no damage obvious from the structural (MPRAGE) images to areas generally associated with reading, and thus the basis for this reading difficulty was not definable. One working hypothesis we decided to examine further was the role of blood flow and oxygen delivery to relevant brain areas. Our preliminary hypothesis was that there might be a “functional brain lesion” caused by decreased oxygen/blood availability to reading-sensitive brain areas, which was not observable in the structural scans. We therefore examined EN with perfusion imaging and contrasted those findings with the structural MPRAGE results.
Perfusion imaging and functional lesions
Perfusion imaging is a technique that allows researchers to gain a direct measurement of regional cerebral blood flow (CBF). Other methods in the field of nuclear medicine (PET studies for example) accomplish this by injecting a diffusible contrast agent (such as H2 150) and measuring the delivery of the agent to the tissue of interest. The advantage of using MRI is that contrast agents need not be injected into the bloodstream. Arterial spin labelling (ASL) techniques have been developed that are similar in principle to those used in nuclear medicine (Detre, Leigh, Williams, & Koretsky, 1992; Edelman et al., 1994; Wong, Buxton, & Frank, 1998). With these techniques, the water of the arterial blood is tagged magnetically with MR pulses and the tagged water is then delivered to the brain slices. Images of relevant brain regions are then acquired.
The basic method behind this ASL technique is fairly straightforward: Two images are acquired an image of the brain region of interest after the arterial blood has been inverted (the tag image) and an image of the same section without tagging the arterial blood (the control image). The two images are subtracted and the difference image represents the level of arterial blood that has been delivered during a specified time interval to the brain region of interest.3
For the tagged image, the magnetisation of the water of the arterial blood is inverted before it reaches the slice of interest by applying a 180° RF pulse to the prior slice. After a sufficient delay to allow for the tagged blood to reach the brain “slice” of interest, the tagged image is acquired. For the control image, the same procedure holds, except that the magnetisation of arterial blood is not inverted.
Collection of perfusion images
Imaging was performed on a GE 1.5T SIGNA scanner fitted with a three-axis local head gradient coil (Wong, Bandettini, & Hyde, 1992). Structural MPRAGE T2-weighted images were acquired: echo time (TE) of 5.2 min at 1.5 mm thick for a total of 124 slices. Other relevant scanning parameters include: matrix size = 256 × 192; relaxation time (TR) = 10.6; FOV = 24cm; flip angle = 10°. During the same scanning session, perfusion images were acquired using pulsed arterial spin labelling techniques (PASL) with the acquisition of five contiguous slices, each 8mm thick (zero skip). A PICORE/ QUIPSS II (Wong et al., 1997, 1998) pulse sequence was employed with TR = 2 see; TE = 30 msec; 64 × 64 matrix size; FOV = 24 cm and a voxel size of 3.75 × 3.75 × 8; TI 1 = 600 msec; T12 = 1600 msec.
Slice-matched anatomical (MPRAGE) images and Perfusion (CBF) images are presented in Figure 8. The set of images on the left side of the figure are the structural images reflecting the damaged sites from EN’s stroke. The set of images on the right of the figure are the perfusion images. Both sets of representative axial images were collected at the following locations: the upper image at inferior 41.7mm (image 84/124) and the lower image at inferior 29.5mm (image 96/124). In the MPRAGE images, damaged tissue appears as black. In the perfusion images, areas in black represent regions with decreased blood flow at the time the images were acquired. It is noted that the spared ribbon of tissue (insula) clearly appears as having normal CBF in the top right perfusion image. Comparisons of the bottom right hand quadrant (left posterior temporoparietal region) of both sets of MPRAGE and perfusion images are the best view of reduced blood flow in a seemingly intact brain area. These images clearly demonstrate hypoperfusion of the left angular gyros and the supramarginal gyros.
Figure 8.
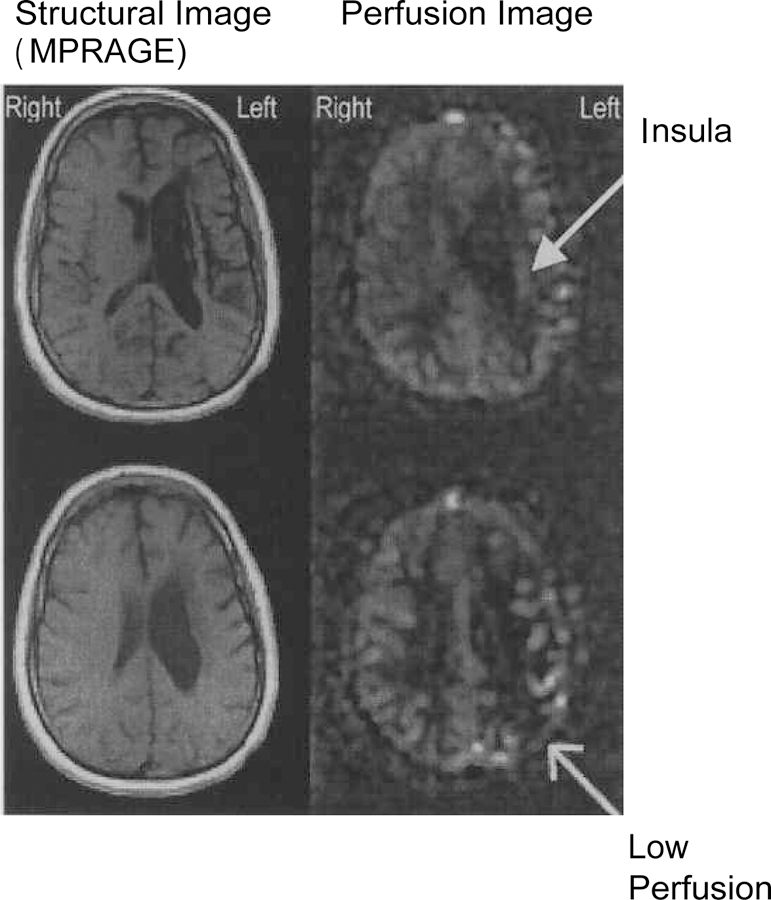
Perfusion images demonstrating a large perfusion defect in the affected area of EN. MPRAGE images show an enlarged dark area adjacent to the left ventricle that represents the damaged regions (including the basal ganglia and deep white matter) that have been replaced by CSF. In the perfusion images, the damaged regions also appear black. The spared insula shown in the structural image as being intact also appears to show perfusion (white ribbon) in the top right image-demonstrating normal CBF. Note the area of low perfusion in the lower right perfusion image that appears normal in the corresponding structural image.
DISCUSSION
The perfusion MRI mapping technique demonstrates a reduction in blood flow in the posterior regions of the left hemisphere-those regions generally associated with reading (i.e., the angular gyros). This “functional” lesion is not evident in the structural MRI scans. The demonstration of slowed or reduced perfusion in an area directly implicated in reading correlates well with behavioural evidence of “slowed” and laboured reading preserved in this patient, providing a brain-behaviour basis for what first appeared to be an unexplained difficulty. These findings give us insight into two issues. First, the way in which tissue is involved in reading is not an all-or-none phenomenon. In addition to the successful (or unsuccessful) decoding of the basic print-to-memory representation (and all of the stages therein), certain aspects of reading such as rate may also have localisable neural sites. Research following this hypothesis is continuing. Second, by using perfusion imaging we have the opportunity to investigate neural regions not obviously implicated (via standard imaging) in the neural trauma of a stroke survivor that appear to have impacted some subtle aspects of cognitive performance.
Prior research investigating regions of dysfunctional neural tissue responsible for reading have focused on how hypoperfusion in the acute and subacute stages of stroke can cause reading disabilities (see, for example, Hillis et al., 2001). Here, we present evidence demonstrating that hypoperfusion can account for cognitive deficits in chronic stroke.
These issues of hypoperfusion in chronic stroke also give rise to questions regarding the length of time a region of the brain can be hypoperfused and still be viable. The evidence presented here suggests that neural tissue can have reduced blood for a lengthy period of time (in this case 16 years) and still be “intact”.
Overall, the perfusion MRI technique may often be more sensitive than structural MRI scans alone in pinpointing potential loci of behavioural deficits. Perfusion MRI provides additional critical information about “functional” lesions that allows for a more accurate evaluation of brain-behaviour classifications, and we feel it is increasingly important that perfusion becomes included as part of standardised brain imaging.
Acknowledgments
The authors are grateful to NIH for the grants that funded this project: DC 02984 and DC 03681. Special thanks to Edgar Zurif, Greg Hickok, and some anonymous reviewers for advice during the write-up of this report and to Elizabeth Oster, Vikki Bouck, and Matt Walenski for their assistance in data collection and analysis.
Footnotes
For purposes of patient confidentiality, the initials do not directly reflect the patient’s name.
We note informally that the control subject read at a “normal rate” comparable to that of other control subjects who were run on this test for other purposes.
Perfusion can be defined as the process of delivering arterial blood to a capillary bed in the tissue. Cerebral blood flow (CBF) is defined as the rate of delivery of arterial blood to the capillary beds of a particular tissue region. In order to get a direct measurement of blood flow (as represented by the inverted magnetisation of the tagged water in the blood) to a particular brain region, the static magnetisation of extra vascular water needs to be subtracted out. Hence, images are acquired that represent the untagged, existing extra vascular magnetisation (the control image).
REFERENCES
- Albert ML (1973). A simple test of visual neglect. Neurology, 23(6), 658–664. [DOI] [PubMed] [Google Scholar]
- Brookshire RH, & Nicholas LE (1993). A system of quantifying the informativeness and efficiency of the connected speech of adults with aphasia. Journal of Speech & Hearing Research, 36(2), 338–350. [DOI] [PubMed] [Google Scholar]
- Demonet J-F, Chollet F, Ramsay S, Cardebat D, Nespoulous J-L, Wise R, Rascol A, & Frackowiak R (1992). The anatomy of phonologic and semantic processing in normal subjects. Brain, 115, 1753–1768. [DOI] [PubMed] [Google Scholar]
- Detre JA, Leigh JS, Williams DS, & Koretsky AP (1992). Perfusion imaging. Magnetic Resonance in Medicine, 23, 37–45. [DOI] [PubMed] [Google Scholar]
- Edelman RR, Siewert B, Darby DG, Thangaraj V, Nobre AC, Mesulam MM, & Warach S (1994). Qualitative mapping of cerebral blood flow and functional localization with echo-planar imaging and signal targeting with alternating radio frequency. Radiology, 192, 513–520. [DOI] [PubMed] [Google Scholar]
- Goodglass H, & Kaplan E (1972). The assessment of aphasia and related disorders Philadelphia: Lea & Febiger. [Google Scholar]
- Goodglass H, & Wingfield A (1997) Word-finding deficits in aphasia: Brain-behavior relations and clinical symptomatology. In Goodglass H & Wingfield A (Eds.), Anomia: Neuroanatomical and cognitive correlates San Diego, CA: Academic Press Inc. [Google Scholar]
- Hillis A, Kane A, Barker P, Beauchamp N, Gordon B, & Wityk R (2001). Neural substrates of the cognitive processes underlying reading: Evidence from magnetic resonance perfusion imaging in hyperacute stroke. Aphasiologv, 15 (10–11), 919–931. [Google Scholar]
- Love T, & Oster E (in press). On the categorization of aphasic typologies: The S.O.A.P. A test of syntactic complexity. Journal of Psycholinguistic Research [DOI] [PubMed]
- Small S, Flores D, Kendall D, & Noll D (1998). Different neural circuits subserve reading before and after therapy for acquired dyslexia. Brain and Language, 62(2), 298–308. [DOI] [PubMed] [Google Scholar]
- Wong EC, Bandettini PA, & Hyde JS (1992). Echo-planar imaging of the human brain using a three axis local gradient coil. Proceedings of Society of Magnetic Resonance in Medicine 11th Annual Meeting, 105. [Google Scholar]
- Wong EC, Buxton RB, & Frank LR (1997). Implementation of quantitative perfusion imaging techniques for functional brain mapping using pulsed arterial spin labeling. NUR in Biomedicine, 10, 237–249. [DOI] [PubMed] [Google Scholar]
- Wong EC, Buxton RB, & Frank LR (1998). Quantitative imaging of perfusion using a single subtraction (QUIPSS and QUIPSS II). Magnetic Resonance in Medicine, 39, 702–708. [DOI] [PubMed] [Google Scholar]


