

Abstract
A simple and specific hydrophilic interaction liquid chromatography-tandem mass spectrometry (HILIC-MS/MS) method was developed for the simultaneous determination of C18-L-threo-sphinganine (safingol, an anti-neoplastic in phase I trials) and its diastereomer, C18-D-erythro-sphinganine (sphinganine), in human plasma. Sample pretreatment involved a protein precipitation with methanol using 25 μL aliquots of plasma. Chromatographic separation of the diastereomers and C17 D-erythro-sphinganine, an internal standard, was achieved on a Xbridge HILIC (3.5 μm, 100 × 2.1 mm) using isocratic elution with the mobile phase of 2mM ammonium bicarbonate in water (pH 8.3) and acetonitrile at a flow rate of 0.3 mL/min. Electrospray ionization (ESI) mass spectrometry was operated in the positive ion mode with multiple reaction monitoring (MRM). The calibration curves obtained were linear over the concentration range of 0.2–-100 ng/mL with a lower limit of quantification of 0.2 ng/mL. The relative standard deviation of intra-day and inter-day precision was below 8.27%, and the accuracy ranged from 92.23 to 110.06%. The extraction recoveries were found to be higher than 93.22% and IS-normalized matrix effect was higher than 90.92%. The analytes were stable for the durations of the stability studies. The validated method was successfully applied to the analyses of pharmacokinetic samples from patients treated with safingol and all-trans-N-(4-hydroxyphenyl)retinamide; (fenretinide, 4-HPR) in a current phase I clinical trial (SPOC-2010-002, ClinicalTrials.gov Identifier: NCT01553071).
Keywords: safingol, sphinganine, HILIC, LC-MS/MS
1. Introduction
Safingol (C18-L-threo-dihydrosphingosine; L-threo-sphinganine) is a synthetic sphingolipid with anticancer activities [1]. Reported safingol activities include inhibition of sphingosine kinase (SK) [2, 3] and a typical protein kinase C’s (PKC), and safingol induces autophagy through inhibition of the PI3 -kinase pathway at higher concentrations in vitro [4–6].
Safingol as a single agent has shown promising anti-cancer activity in various human cancer cell lines but has demonstrated limited ported in vivo [6–8]. Synergistic cytotoxicity has been reported for safingol in combination with other chemotherapeutic agents, including 1-ß-D- arabinofuranosylcytosine (ara-C), mitomycin-C, doxorubicin, vinblastine, and cisplatin in preclinical studies in vitro [5, 8–11]. Safingol in combination with all-trans-N-(4- hydroxyphenyl)retinamide (fenretinide) demonstrated synergistic cytotoxicity in various cancer cell lines, including neuroblastoma, melanoma, lung cancer, colon cancer, prostate cancer, and pancreatic cancer [12]. Rodent-specific toxicities of safingol limit in vivo human-murine xenograft experiments to suboptimal safingol exposure [7, 13]. However, phase I studies of safingol in combination with cisplatin or doxorubicin showed that the drug can be safely administered in humans [8, 14]. Currently, safingol is being tested in combination with fenretinide delivered intravenously in a phase I clinical trial in relapsed lymphomas and solid tumors (SPOC 2010-002, ClinicalTrials.gov Identifier NCT01553071). Thus, an accurate and reliable analytical assay of safingol in clinical samples is essential to determine the therapeutic levels of the agent.
Structurally, safingol is the L-threo-stereoisorrier of naturally occurring C18-D-erythro-sphinganine caused by two asymmetric carbons on an aliphatic chain [1, 15]. The analysis of safingol in biological samples is difficult due to the lack of a ready chromophore or fluorophore in the sphingoid-base backbone of sphingolipids, as well as, the presence of an endogenous isomer with similar chemical properties. Several analytical methods of safingol, including chromatography after fluorescent [16] or radioactive derivatization [17, 18] and enzyme-based assays [19], have been preferred methods for quantitation of safingol. We have previously reported a high performance liquid chromatography (HPLC)-fluorescence detector (FLD) method after naphthalene-2,3-dicarboxyaldehyde (NDA) derivatization for the determination of safingol in human plasma [20]. However, HPLC-based methods for aliphatic compounds typically require pre- or post-column derivatization to address the associated with detection or separation. Further, while derivatization can increase sensitivity and resolution, it has the drawback of being labor-intensive and cleanup procedures are time-consuming. Recent advancements in mass spectrometry (MS) have facilitated the detection of non-derivatized sphingolipids with improved sensitivity and specificity [21, 22], but MS-only techniques are inadequate to differentiate stereoisomeric compounds with qualitatively similar fragmentations, and thus should be combined with chromatographic separation. As separation of diastereomers by reverse phase (RP) chromatography based on the achiral stationary phases may provide insufficient resolution, long run times of at least 45 min per sample on a 25 cm-column may be required to achieve adequate resolution [23–25]. Hydrophilic interaction liquid chromatography (HILIC) is an alternative approach to RP chromatography for the profiling of sphingolipids [26]. HILIC is primarily used for the separation of relatively polar or ionizable compounds and can produce acceptable selectivity for positional and conformational isomers [23, 27–29]. Interestingly, HILIC appears particularly useful for separating diastereomeric compounds, such as hexosylceramides, including glucosylceramide and galactosylceramide as well as ephedrines, including ephedrine and pseudoephedrine [30, 31]. Furthermore, eluent rich in organic solvent in HILIC may enhance detection sensitivity using MS by increasing electrospray ionization (ESI).
In the present study, a simple HILIC-MS/MS method for distinguishing and quantitating safingol and its diastereomer, sphinganine in human plasma was developed and validated, and then successfully applied to plasma samples from Phase I patients treated with intravenous safingol + fenretinide.
2. Experimental
2.1. Chemicals and reagents
Safingol, sphinganine and C17-sphinganine were from Avanti Polar Lipids, Inc (Alabaster, AL, USA). Ammonium acetate, ammonium formate, ammonium bicarbonate, acetic acid and formic acid were from Sigma-Aldrich (St Louis, MO, USA). LC-MS-grade acetonitrile was from Fisher Scientific (Pittsburgh, PA, USA). Ultrapure water was prepared by using a Synergy water purification system equipped with a 0.22 μm membrane cartridge and UV lamp (Millipore, Bedford, MA, USA). Drug-free heparinized human plasma from healthy donors was provided by Transfusion Services at University Medical Center (Lubbock, TX).
2.2. Liquid chromatographic conditions
The analytes were chromatographically separated on a Shimadzu Prominence HPLC System (Shimadzu Scientific Instruments, INC., Columbia, MD, USA) consisting of a binary pump, an online degasser, an autosampler and a column oven. A Xbridge HILIC column (3.5 μm, 100 × 2.1 mm i.d., Waters, Torrance, CA, USA) protected with KrudKatcher Ultra In-Line filter (0.5 μm, phenomenex, USA) was applied for all analyses at 30°C. The mobile phases consisting of 2 mM ammonium bicarbonate in water (A) and 100% acetonitrile (B) were delivered under the isocratic condition of 90% B (v/v) for 12 min at a flow rate of 0.3 mL/min. Subsequently, the column was cleaned for 2 min at 50% B following the decrease to 50% B over 1 min. The mobile phase composition was finally returned to the initial condition of 90% B in 0.1 min and re-equilibrated for 5 min. The column eluent within the time window of 5-15 min was diverted to a mass spectrometer using a switching valve (Valeo Instruments Co. Inc., Houston, TX, USA). The autosampler temperature was kept at 4°C and the injection volume was 2 μL.
2.3. Mass spectrometer conditions
Mass spectrometric detection was performed on a Sciex 4000 QTRAP system (AB Sciex, Concord, Canada) equipped with an electrospray ionization (ESI) source in positive ion mode. Quantification was achieved by using multiple reaction monitoring (MRM) transitions of m/z 288.2 → 270.2 for C17-sphinganine (IS) and m/z 302.3 → 284.2 for both safingol and sphinganine. Quadrupole Q1 and Q3 were set on unit resolution with a dwell time of 200 ms for each MRM transition. The optimal declustering potentials (DP), collision energy (CE) and collision cell exit potential (CXP) were 65 V, 20 eV and 18 V, respectively. The operating conditions were optimized as follows: ionspray voltage, 5000 V; source temperature, 350 °C; curtain gas, 20 psi; nebulizer gas, 50 psi; turbo gas, 50 psi; and collision gas, medium. All data acquired were processed by using Analyst software 1.6.3 (AB Sciex).
2.4. Preparation of standard and quality control (QC) samples
Stock solutions at 1 mg/mL were prepared by dissolving each standard compound in methanol. Working solutions were prepared by serially diluting their corresponding stock solutions with methanol to proper concentrations. Working solution for IS was prepared at concentration of 500 ng/mL. All solutions were stored at −20 °C and brought to room temperature prior to use.
Calibration standards were prepared by spiking 5 μL of the working solutions into 25 μL of blank human plasma to yield the nominal concentrations of 0.2, 0.4, 1, 5, 10, 20, 50 and 100 ng/mL for safingol and sphinganine. Quality control (QC) samples were prepared at 0.2, 0.6, 30 and 80 ng/mL, respectively, representing the lower limit of quantification (LLOQ), low (LQC), medium (MQC) and high (HQC) quality controls. All calibration standards and QC samples were freshly prepared on each analysis day.
2.5. Sample preparation
Five μL of internal standard (C17-sphinganine, 500 ng/mL) and 470 μL of chilled methanol were added to a 25 μL aliquot of human plasma in a 1.5 mL microcentrifuge tube. The mixture was vortex-mixed for 1 min and then centrifuged at 13,000 × g for 5 min to precipitate proteins. The supernatant was transferred into an autosampler vial and a 2 μL aliquot was injected into the LC-MS/MS system.
2.6. Method validation
According to the US Food and Drug Administration (FDA) guidance on bioanalytical method validation [32], the developed method was validated for selectivity, linearity, precision, accuracy, recovery, matrix effect, dilution integrity and stability before applying it to quantitate the clinical levels of analytes.
The selectivity of the method was evaluated by analyzing six individual sources of blank plasma based on the absence of potential interferences at the expected retention times of analytes and IS. The selectivity was considered to be acceptable when the response of interfering components was less than 20% of LLOQ for analytes and 5% for IS. Carryover was assessed by consecutively analyzing the double blank sample following the upper limit of quantitation (ULOQ) sample.
The calibration curves between 0.2 to 100 ng/mL were constructed by plotting the peak area ratio (y) of analyte to IS versus the nominal concentration of the analytes (x) using a linear least-squares regression with a weighing factor of 1/x2. LLOQ was defined as the concentration, at which satisfy all of the criteria including the precision and accuracy ≤ 20%, and the signal-to-noise ratio (S/N) ≥ 10. Precision was expressed as a relative standard deviation (RSD %). The accuracy was assessed as the percentage deviations of the measured concentration to the nominal concentration. Intra-day precision and accuracy were determined through the analysis of the six replicates of LLOQ and QC (low, medium, and high) samples at four different concentrations on same day, whereas inter-day precision and accuracy were evaluated on the LLOQ and QC samples on six consecutive days. Acceptance criteria for precision and accuracy are ≤ 15%, except at LLOQ where ≤ 20% is applicable. The subtraction calculation method involved adjustments of the endogenous sphinganine from the determination. The endogenous sphinganine amount in blank matrix was initially determined using standard addition method.
The extraction recovery and matrix effect were evaluated in six replicates at three different QC concentrations (low, medium and high) for the two analytes and at the method concentration (10 ng/mL) for IS. Recovery were evaluated by comparing the peak area of the extracted QC samples to those of analyte spiked into the extracted blank plasma. The matrix effect was assessed by the ratio of the peak areas of analytes spiked into extracted blank plasma to those of neat standard. The IS normalized matrix factor is defined as the matrix factor of the analyte divided by the matrix factor of the IS. The area of endogenous sphinganine in blank sample was subtracted from the total observed sphinganine area in the pre-spike and post-spike samples.
Dilution integrity was evaluated with spiking analytes at high concentrations (400 ng/mL and 800 ng/mL) above the upper limits of quantification (ULOQ) followed by 5- and 10-fold dilution with blank matrix. Accuracy within ±15% and precision less than 15% based on analysis of six replicates per dilution factor were considered acceptable.
The stabilities assessments were conducted by analyzing three replicates of QC samples stored under the processing or storage conditions during assay development. The bench-top stability was assessed after keeping at room temperature for 12 h. The post-preparative stability was determined when processed samples were stored in an autosampler at 4 °C for 24 h. Freeze (−80°C)-thaw (room temperature) stability was assessed after three cycles with freezing for 24 h between thaws. For long-term stability, the QC samples were stored at −80 °C and evaluated up to 2 months.
2.7. Application to analyses of clinical samples
The validated method was applied to pharmacokinetic (PK) samples from a phase I clinical trial of intravenous fenretinide (4-HPR) plus intravenous safingol for patients with relapsed malignancies (SPOC-2010-002, ClinicalTrials.gov Identifier: NCT01553071) conducted in the South Plains Oncology Consortium (www.SPONC.org). The plasma concentrations of fenertinide were measured using a previously described LC-MS/MS assay as previously described [33]. Written informed consent was obtained from all patients or their legal guardians before participating the clinical trial. The trial protocol was approved by the Institutional Review Board at each site where patients provided blood samples for PK and by the Texas Tech University Health Sciences Center (TTUHSC), Lubbock, Texas.
Patients received a safingol phospholipid emulsion by continuous intravenous infusion at a dose of 210 mg/m2/day for 48 h on Days 1 and 2 of each 21 days cycle according to the SPOC-2010-002 Phase I study protocol, Dosing Level 1 (ClinicalTrials.gov Identifier NCT01553071). Currently, fenretinide (4-HPR) oil-in-water emulsion was administered by continuous intravenous infusion at doses of 600 mg/m2/day for 24 h on Day 1, followed by 1000 mg/m2/day for 96 h on Days 2-5. Approximately 4 mL of blood was drawn at 0, 12, 24, 36, 48 h during and at the end of the safingol infusion, and then at +1, +4, +24, +48, +72, +74, and +120 h, after the stop of the safingol infusion. Blood samples were immediately protected from light and centrifuged at 3000 × g for 5 min at 4 °C within 1 h following collection. The resulting plasma was transferred to an amber polypropylene tube in order to prevent light-induced degradation of fenretinide and were kept at −80 °C until analysis. The safingol and fenretinide plasma concentration–time curves of individual patients were constructed from 0 to +168 h.
3. Results and Discussion
3.1. Method development
3.1.1. Mass spectrometry
All analytes and IS generated protonated precursor ions [M+H]+. The two sphinganine diastereomers showed identical fragmentation pattern (Fig. 1 A&B). The dominant product ions of safingol and sphinganine were observed at m/z 284.2 corresponding to neutral loss of water from the precursor molecular ion at m/z 302.3. Likewise, the mass spectra of IS revealed protonated precursor ions [M+H]+ at m/z 288.2 and major product ion at m/z 270.2 with a fragmentation pathway similar to C18-sphinganine (Fig. 1C). Cleavage of the C2–C3 bond of the sphinganine backbone using higher collision energy (40 eV) lead to notable product ions at m/z 60 for the three components, which are specific to the saturated species derived from sphinganines. Thus, MRM transitions for the quantification were set in m/z 302.3 → 284.2 for safingol and sphinganine. Minor product ions at m/z 60.0 were used as qualifier to confirm both safingol and sphinganine. Ion transitions for IS were m/z 288.2 → 270.2 for the quantification and m/z 288.2 → 60.0 for the qualification, respectively. The optimal DP, CE and CXP values for major ion transitions of diastereomers were identical for each of them. Also, the optimal parameters for IS were indistinguishable from those for safingol and sphinganine.
Fig. 1.
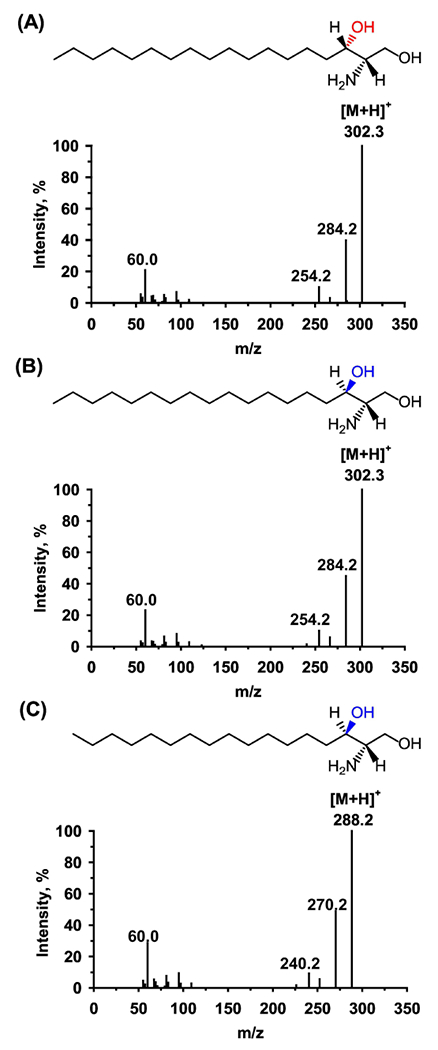
Product ion mass spectra of C18-L-threo-sphinganine (safingol, A), C18-D-etylhro-sphinganine (sphinganine, B) and the internal standard (IS) C17-sphinganine (C).
3.1.2. Chromatography
Diastereo-seletive separation of safingol and sphinganine was achieved using an unbonded hybrid silica HILIC column by optimizing salt additives, buffer concentration, acetonitrile content, and column temperature.
Mobile phase pH was a major factor controlling the separation. Initially, acetonitrile–water systems with three kinds of volatile modifiers (2 mM ammonium formate (pH 6.4), 2 mM ammonium acetate (pH 6.9) or 2 mM ammonium bicarbonate (pH 8.3)) were investigated under the HILIC mode (Fig.2). The sphinganines are positively charged under experimental pH due to presence of amino group (≈pKa 9.5) in their C2 positon, while silanol groups (≈pKa 3.8-4.5) on the surface of the stationary phase are deprotonated at neutral and moderately basic pH. Therefore, increasing pH enhanced electrostatic attractions between oppositely charged analytes and silanol groups of the stationary phase, and consequently improved the selectivity of diastereomers with increased retention and baseline resolution. The similar phenomenon was observed in tests performed using the acetate buffer by adjusting pH with acetic acid/or ammonium hydroxide.
Fig. 2.
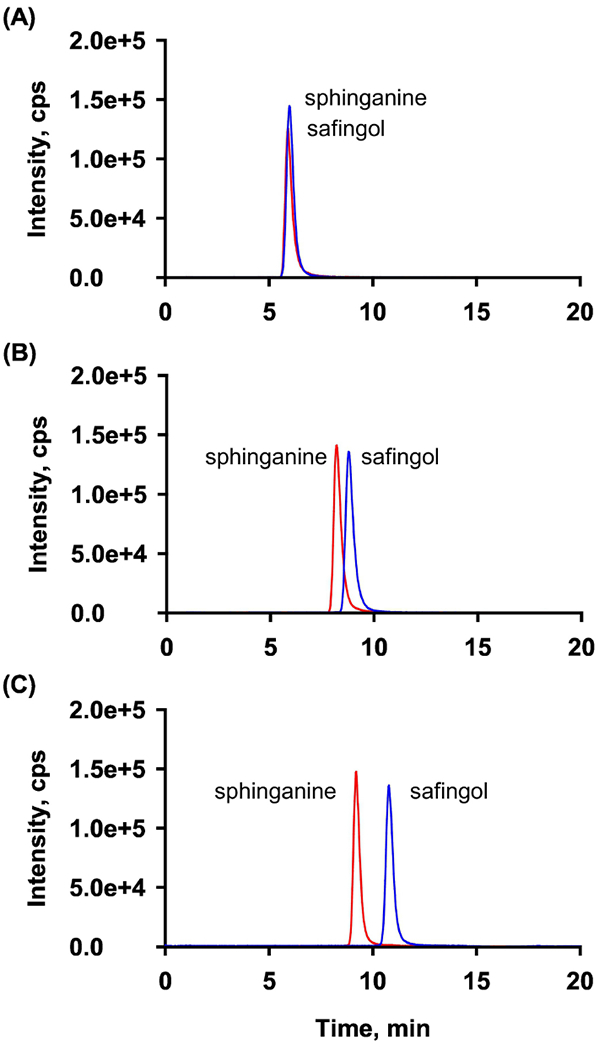
Separation of safingol and sphinganine using different buffers based on ammonium formate at pH 6.4 (A), ammonium acetate at pH 6.9 (B), or ammonium bicarbonate at pH 8.3 (C). HILIC was performed using 90:10 (v/v) acetonitrile:2 mM buffer at 30 °C.
Retention of analytes was also regulated by variation in ionic strength of mobile phase (2, 2.5, 3, 5 and 10 mM with ammonium bicarbonate in water). Higher concentration of modifiers (>5 mM) led to poor resolution with earlier elution and reduced signal response (>30%) for analytes (Fig. 3A). This retention behavior may be attributed to the competition between analyte ions and counter ions in buffer for the ion-exchanger on the silica surface. Thus, 2 mM ammonium bicarbonate without titration was selected as aqueous mobile phase providing optimal resolution (Rs>1.5) with acceptable signal intensity and reproducibility.
Fig. 3.
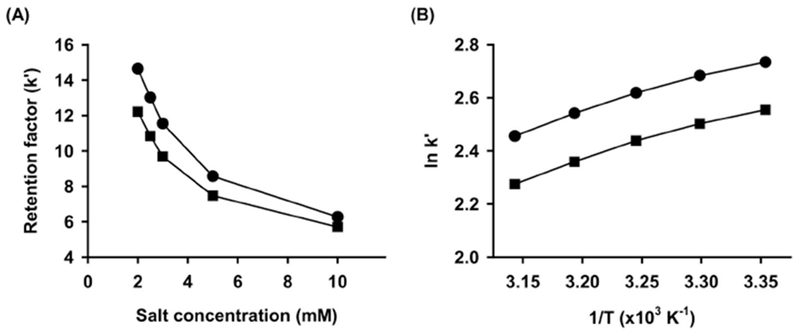
Effects of the buffer concentration at 30 °C in acetonitrile: ammonium bicarbonate buffer (90:10, v/v) (A) and the column temperature in acetonitrile:2 mM ammonium bicarbonate buffer (90:10, v/v) (B) on the retention factors. Observed data are indicated by the closed circles for safingol and the closed squares for sphinganine.
Typical eluents for HILIC contain a high percentage of organic solvent. Contrary to RPLC, in HILIC, acetonitrile is the most favored weak solvent that provides an increase in retention, whereas water provides quicker elution. Safingol and sphinganine were resolved well under isocratic conditions with 85-95% acetonitrile in selected buffer. Meanwhile, the ionization efficiency for analytes were sensitive to acetonitrile content in the eluate. Since 5% reduction in acetonitrile decreased signal response by 30%, and higher organic solvent content (>90%) resulted in peak broadening, 90% acetonitrile in aqueous buffer represented the best compromise between peak intensity and shape. However, because maintaining the isocratic elution at the weak elution strength caused ion suppression in the next injection due to the accumulation of late-eluting matrix components, a washing step by increasing elution strength was introduced after the complete elution of all analytes in order to remove the interference.
The effects of column temperature on the retention factor were investigated at 25 to 45°C for the mobile phase condition selected above (Fig. 3B). Positive slopes of van’t Hoff plots for both analytes were obtained with slight curvature, which suggest exothermic processes of transferring analytes from the mobile phase to the stationary phase. Classically, the relationship between In k’ and 1/T is linear by the consistent retention mechanism. However, the non-linear relationship observed in experimental plot indicates that the retention of safingol and sphinganine might be controlled by mixed retention mechanisms over the studied temperature range. Although increasing the column temperature slightly reduced the elution time and peak width with the selected mobile phase, the column temperature was kept at 30°C to avoid dissolution of packing materials caused by elevated temperatures and high pH.
Under the optimized HILIC conditions, safingol, sphinganine and IS were separated with suitable retention time of 9.2, 10.8 and 9.4 min, respectively (Fig. 4).
Fig. 4.
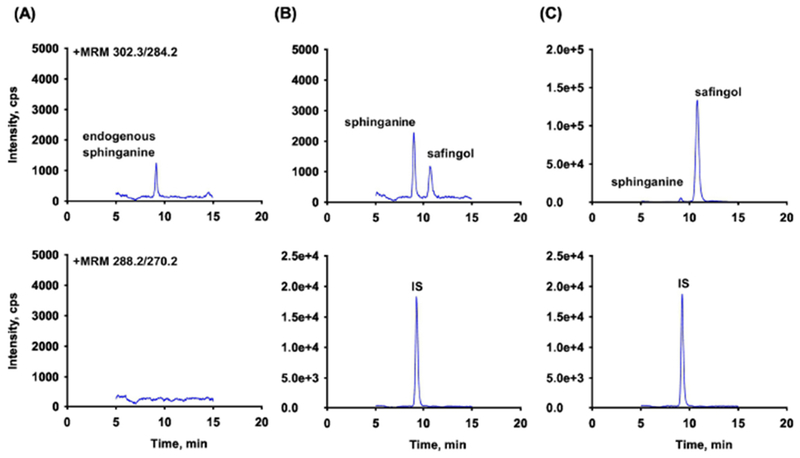
Extracted ion chromatograms of safingol, sphinganine and C17-sphinganine (IS) in human plasma (top to bottom): (A) blank plasma; (B) plasma spiked with analytes at 0.2 ng/mL (LLOQ) and IS at 10 ng/mL; (C) patient sample after intravenous administration of safingol at 210 mg/m2/day as 48 hr infusion, RT: safingol (10.8), sphinganine (9.2) and IS (9.4).
3.1.3. Sample preparation
Numerous modifications of Folch [34], as well as, the method of Bligh and Dyer [35] based on liquid-liquid extraction (LLE) with a blend of chloroform-methanol are well documented and commonly used for lipid sample preparation. However, multi-step procedures that consist of repeated extraction and drying steps followed by reconstitution are time and labor intensive
In the present study, a simple protein precipitation using chloroform-free solvents was chosen for rapid sample preparation. Different solvents were evaluated for monophasic extraction, including ethanol, methanol, isopropanol, and acetonitrile. To estimate the extraction efficiency, the peak area of each analyte in extracts was normalized by the average peak area from standard solution. Acetonitrile precipitation resulted in an efficiency of less than 80% with wide variations between plasma samples. Although overall precipitation by alcohols offered a highly consistent and effective extraction (>80%), ethanol extraction exhibited a relatively low efficiency compared to methanol and isopropanol methods. All analytes were extracted by isopropanol with comparable efficiencies relative to methanol precipitation (approximately 85%), however, the injection of isopropanol extracts caused higher column back pressure and broader peak width compared to other solvent extraction. Thus, methanol was selected as the solvent that yielded high extraction efficiency, as well as, favorable variability in reproducibility.
The injection of a sample diluent that is not the same composition as mobile phases may influence chromatographic behaviors, and thus the effect of sample diluent on chromatography was investigated using methanol extracts diluted with acetonitrile at 100:0, 50:50, 30:70, and 15:85 ratio (methanol/acetonitrile, v/v). The different percentage of methanol within the sample diluent resulted in no significant differences on retention or peak shapes. Therefore, the methanol precipitation was selected as a preferred one-step sample preparation method, enabling the efficient extraction of safingol and sphinganine from human plasma samples followed by direct injection of the supernatant.
3.2. Method validation
One issue in developing an assay to measure safingol in plasma is the endogenous diastereomer sphinganine. The lack of analyte-free matrix impedes preparing calibration curves and QC samples for quantitative determination of endogenous sphinganine. This study employed background subtraction based on the approach using true analytes and matrix. To select human plasma for calibration curves and QC samples, several lots were screened and a lot consisting of the low endogenous levels of sphinganine was selected as blank matrix for preparation of calibration curves and QC samples.
3.2.1. Selectivity and carry-over
The selectivity for safingol or IS was evaluated using six different lots of blank plasma. No endogenous interference derived from plasma was observed at the retention times of safingol or IS. The selectivity could not be tested for sphinganine due to its endogenous levels that were observed at the level between LLOQ and LQC (0.2 - 0.5 ng/mL). Typical chromatograms of blank plasma, blank plasma spiked with analytes at LLOQ and the IS, and a plasma sample drawn after intravenous administration of safingol at 210 mg/m2/day for 48 hrs are shown in Fig. 4. Carry-over was evaluated by analyzing a blank sample following the ULOQ. No carry-over was observed using the present conditions.
3.2.2. Linearity and LLOQ
The calibration curves fitted linearly to the eight calibration point over the concentration range of 0.2 - 100.0 ng/mL for both analytes. The back-calculated concentrations were within ±15% of the nominal values at each level. The regression equations and correlation coefficients were y = 0.2447x − 0.0116, r = 0.9975 for safingol, and y = 0.2535x + 0.0203, r = 0.9976 for sphinganine. The quantification of sphinganine was performed by subtracting the endogenous amount of sphinganine in blank matrix, which was determined using a standard addition method. The LLOQ for both analytes was 0.2 ng/mL with the acceptable accuracy and precision, indicating that this method was suitable to determine safingol and sphinganine in the clinical study.
3.2.3. Precision and accuracy
The accuracy and precision were evaluated by intra- and inter-day assays at LLOQ, low, medium, and high QC levels and summarized in Table 1. The intra-day accuracy was 92.23–110.06% with a precision less than 5.60%. The inter-day accuracy was 93.74–107.25% with a precision less than 8.27%. Thus the assay was reliable and reproducible for the determination of safingol sphinganine in human plasma.
Table 1.
Precision and accuracy for the analysis of safingol and sphinganine
| Analyste | Nominal conc. (ng/mL) | Within-run (n=6) |
Between-run (n=6) |
||||
|---|---|---|---|---|---|---|---|
| Observed conc. (ng/mL, Mean ± SD) | Accuracy (%) | Precision (RSD %) | Observed conc. (ng/mL, Mean ± SD) | Accuracy (%) | Precision (RSD %) | ||
| Safingol | 0.2 | 0.22 ± 0.01 | 110.06 | 3.47 | 0.21 ± 0.01 | 107.10 | 4.45 |
| 0.6 | 0.58 ± 0.02 | 97.41 | 3.35 | 0.56 ± 0.04 | 93.74 | 7.28 | |
| 30 | 31.56 ± 1.45 | 105.20 | 4.61 | 31.45 ± 1.81 | 104.84 | 5.75 | |
| 80 | 73.78 ± 2.21 | 92.23 | 3.00 | 79.57 ± 6.58 | 99.47 | 8.27 | |
| Sphinganine | 0.2 | 0.21 ± 0.01 | 104.30 | 5.60 | 0.21 ± 0.01 | 107.25 | 6.98 |
| 0.6 | 0.62 ± 0.01 | 103.63 | 1.95 | 0.57 ± 0.04 | 95.09 | 6.78 | |
| 30 | 31.48 ± 0.87 | 104.92 | 2.78 | 30.97 ± 0.88 | 103.22 | 2.84 | |
| 80 | 76.39 ± 0.81 | 95.48 | 1.06 | 78.17 ± 3.37 | 97.71 | 4.31 | |
3.2.4. Recovery and matrix effect
The extraction recovery and matrix effect are presented in Table 2. Recovery and matrix effect for sphinganine were evaluated by comparing the peak areas derived from the background subtraction. The mean recoveries at each QC level were between 93.22% and 96.23% for safingol and between 93.89% and 97.85% for sphinganine, respectively. The recovery of IS was 97.96% at the experimental concentration of 5 ng/mL.
Table 2.
Recovery and matrix effect of analytes and internal standard (n=6)
| Compounds | Nominal conc. (ng/mL) | Recovery | Matrix effect | IS-normalized matrix effect | |||
|---|---|---|---|---|---|---|---|
| Mean ± SD (%) | RSD (%) | Mean ± SD (%) | RSD (%) | Mean ± SD (%) | RSD (%) | ||
| Safingol | 0.6 | 95.31 ± 7.89 | 8.28 | 82.37 ± 3.81 | 4.63 | 90.92 ± 3.66 | 4.02 |
| 30 | 96.23 ± 3.67 | 3.82 | 88.00 ± 2.48 | 2.82 | 103.18 ± 4.49 | 4.35 | |
| 80 | 93.22 ± 1.86 | 1.99 | 82.43 ± 1.42 | 1.73 | 92.60 ± 1.64 | 1.77 | |
| Sphinganine | 0.6 | 97.85 ± 5.49 | 5.61 | 90.61 ± 4.83 | 5.33 | 100.00 ± 4.48 | 4.48 |
| 30 | 93.89 ± 3.04 | 3.24 | 85.00 ± 2.65 | 3.11 | 99.59 ± 1.39 | 1.40 | |
| 80 | 96.06 ± 2.27 | 2.37 | 84.58 ± 2.31 | 2.73 | 94.99 ± 1.31 | 1.38 | |
| IS | 5 | 97.96 ± 3.68 | 3.75 | 85.36 ± 2.47 | 2.89 | - | - |
Co-eluting compounds originating from plasma matrix caused a mild ion suppression within the range of 82.37-90.61% for all analytes. Since the ion suppression degree between the target analytes and IS was similar, the IS-normalized matrix effect of all QC samples was greater than 90%.
3.2.5. Dilution integrity
Dilution integrity was evaluated with the accuracy and precision based on six replicates following 5- and 10-fold dilutions with blank matrix. The accuracy ranged from 96.32% to 96.35% for safingol and from 96.37% to 97.26% for sphinganine. The precision was within 4.43% for safingol and 1.98% for sphinganine. The results demonstrate that samples with concentrations exceeding the ULOQ could be diluted by 10 fold with no impact on the analytical result.
3.2.6. Stability
The stability of the analytes was assessed at low, medium, and high QC concentrations levels under the experimental conditions and presented in Table 3. The analytes were stable in plasma for 24 h at room temperature and for 2 months at −80 °C. Moreover, the analytes remained stable after three freeze-thaw cycles and after post-preparation storage in the autosampler at 4 °C for 24 h.
Table 3.
Stability of safingol and sphinganine in matrix at different conditions (n=3)
| Storage Conditions | Nominal conc. (ng/mL) | safingol |
sphinganine |
||
|---|---|---|---|---|---|
| Mean ± SD (%) | RSD (%) | Mean ± SD (%) | RSD (%) | ||
| Freeze-thaw stabilitya | 0.6 | 95.89 ± 4.51 | 4.70 | 94.16 ± 3.35 | 3.26 |
| 30 | 108.16 ± 3.19 | 2.95 | 100.70 ± 0.67 | 0.67 | |
| 80 | 96.03 ± 1.98 | 2.06 | 90.89 ± 0.50 | 0.55 | |
| Short-term stabilityb | 0.6 | 90.67 ± 1.91 | 2.11 | 109.50 ± 6.97 | 6.36 |
| 30 | 102.18 ± 1.69 | 1.65 | 99.73 ± 0.34 | 0.34 | |
| 80 | 93.89 ± 2.94 | 3.13 | 93.63 ± 1.61 | 1.72 | |
| Long-term stabilityc | 0.6 | 89.05 ± 2.67 | 3.00 | 97.91 ± 3.01 | 3.07 |
| 30 | 94.21 ± 1.62 | 1.72 | 97.39 ± 1.97 | 2.02 | |
| 80 | 92.50 ± 1.13 | 1.22 | 95.54 ± 0.76 | 0.80 | |
| Post-preparative stabilityd | 0.6 | 100.72 ± 5.55 | 5.51 | 104.53 ± 2.90 | 2.77 |
| 30 | 105.50 ± 3.30 | 3.12 | 105.55 ± 1.22 | 1.16 | |
| 80 | 98.35 ± 2.10 | 2.13 | 96.57 ± 0.78 | 0.81 | |
Storage from −80°C to 25°C through three cycles.
Storage at room temperature for 24 h.
Storage for 2 months at −80°C.
Storage in processed samples in the autosampler at 4°C for 24 h.
3.3. Analysis of plasma samples from a clinical study
The validated LC–MS/MS method was applied for the simultaneous quantification of safingol and sphinganine in plasma samples obtained from patients in the SPOC-2010-002 Phase I study at safingol Dosing Levels 1 and 2. Assayed plasma safingol profiles in randomly selected patient samples are presented in Fig. 5. The plasma safingol concentration rapidly increased up to 24 h during the first day of the 48 hr continuous safingol infusion when fenretinide was given concomitantly at 600 mg/m2/day. However, when the fenretinide dosing was increased to 1000 mg/m2/day starting at +24 h, safingol levels declined somewhat despite maintaining the infusion up to hour +48. Explanations for this may include that fenretinide, a stimulator of de novo dihydroceramide synthesis, may stimulate cells to increase their uptake of safingol, the stereochemical analog of sphinganine, the normal precursor of dihydroceramide synthesis. Alternatively, total serum lipase capacity might be increasing in the first 24 hours of the combined emulsion infusion as serum lipases tethered to the endothelial surfaces of the capillary beds of muscle and fat tissues are stripped and activated by the emulsion particles – simulating the effect of chylomicrons on serum lipase capacity. The increased serum lipase capacity might then increase the degradation of the phospholipid safingol emulsion thereby accelerating the plasma clearance of liberated (free) safingol. Safingol delivered in the phospholipid emulsion used in the SPOC-2010-002 phase I clinical trial has been previously reported to have an initial plasma elimination half-life of ~1 hr when delivered as a bolus in combination with cisplatin [14].
Fig. 5.
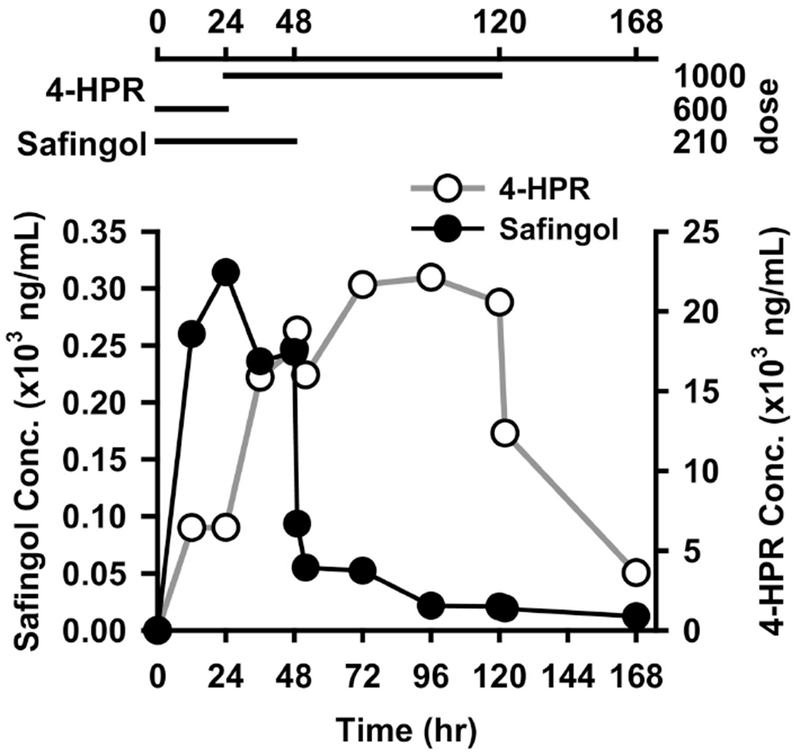
Individual plasma concentration-time profile of safingol and fenretinide following continuous intravenous co-administration. Dose: mg/m2/day.
Overall, the analytical method developed was sufficiently sensitive and specific in order to monitor traces of safingol residues in plasma for up to 120 h (5 days) after stopping the infusion. A wide linear range allowed the measurement of the agent in the majority of the patient samples without dilution. Endogenous sphinganine was observed consistently at low concentrations between LLOQ and LOQ in all patient samples.
4. Conclusions
In the present study, an LC–MS/MS method was developed and validated for the assay of safingol and sphinganine in human plasma. The separation of diastereomers based on hydrophilic interaction chromatography achieved baseline resolution without use of a chiral column or derivatization procedure. The developed method allows the simple and efficient sample pretreatment as well as the accurate and reliable assay with acceptable linearity, precision, accuracy, recovery characteristics and a faster run time. The method was successfully applied to the analysis of safingol in human plasma samples from a clinical trial of 4-HPR plus safingol. The established method will be utilized for pharmacokinetic study or therapeutic monitoring of safingol in plasma samples from the patients treated with the agent.
Highlights.
Simultaneous determination of safingol (C18-L-threo-sphinganine) and its naturally occurring diastreomer C18-D-erythro-sphinganine (sphinganine) in human plasma
Application of novel separation methods for sphingolipid diastreomers using hydrophilic interaction liquid chromatography with isocratic mobile phase.
Quantitation of safingol and sphinganine using the assay to analyze human samples from a phase I clinical trial of safingol + fenretinide combination in cancer patients.
Demonstration of one of the mechanisms of synergy for safingol + fenretinide: safingol being a potential substrate of fenretinide
Acknowledgements
Funding: This work was supported by National Cancer Institute grants CA161889 to C Patrick Reynolds, CA183316 to William J Simpson, and Cancer Prevention and Research Institute of Texas (RP150416) to Barry J. Maurer.
Footnotes
Publisher's Disclaimer: This is a PDF file of an unedited manuscript that has been accepted for publication. As a service to our customers we are providing this early version of the manuscript. The manuscript will undergo copyediting, typesetting, and review of the resulting proof before it is published in its final citable form. Please note that during the production process errors may be discovered which could affect the content, and all legal disclaimers that apply to the journal pertain.
Conflict of interest
C. P. Reynolds and B.J. Maurer are co-inventors on issued patents for intravenous formulations of fenretinide and safingol with financial interests through institutional intellectual property revenue sharing agreements, and are also consultants to, and own stock in, CerRx, Inc., that licenses this technology. M. H. Kang is a consultant for CerRx, Inc
References
- [1].Rajewski RA, Kosednar DG, Matches TA, Wong OS, Burchett K, Thakker K, Stereo-specific analysis of a novel protein kinase C inhibitor, J. Pharm. Biomed. Anal, 13 (1995) 247–253. [DOI] [PubMed] [Google Scholar]
- [2].Olivera A, Kohama T, Tu Z, Milstien S, Spiegel S, Purification and Characterization of Rat Kidney Sphingosine Kinase, J. Biol. Chem, 273 (1998) 12576–12583. [DOI] [PubMed] [Google Scholar]
- [3].Reynolds CP, Maurer BJ, Kolesnick RN, Ceramide synthesis and metabolism as a target for cancer therapy, Cancer Lett, 206 (2004) 169–180. [DOI] [PubMed] [Google Scholar]
- [4].Hannun YA, Loomis CR, Merrill AH, Bell RM, Sphingosine inhibition of protein kinase C activity and of phorbol dibutyrate binding in vitro and in human platelets, J. Biol. Chem, 261 (1986) 12604–12609. [PubMed] [Google Scholar]
- [5].Sachs CW, Safa AR, Harrison SD, Fine RL, Partial Inhibition of Multidrug Resistance by Safingol Is Independent of Modulation of P-glycoprotein Substrate Activities and Correlated with Inhibition of Protein Kinase C, J. Biol. Chem, 270 (1995) 26639–26648. [DOI] [PubMed] [Google Scholar]
- [6].Coward J, Ambrosini G, Musi E, Truman J-P, Haimovitz-Friedman A, Allegood JC, Wang E, Merrill JAH, Schwartz GK, Safingol (l-threo-sphinganine) induces autophagy in solid tumor cells through inhibition of PKC and the PI3-kinase pathway, Autophagy, 5 (2009) 184–193. [DOI] [PubMed] [Google Scholar]
- [7].Kedderis LB, Bozigian HP, Kleeman JM, Hall RL, Palmer TE, Harrison SD, Susick RL, Toxicity of the Protein Kinase C Inhibitor Safingol Administered Alone and in Combination with Chemotherapeutic Agents, Fundam. Appl. Toxicol, 25 (1995) 201–217. [DOI] [PubMed] [Google Scholar]
- [8].Schwartz GK, Ward D, Saltz L, Casper ES, Spiess T, Mullen E, Woodworth J, Venuti R, Zervos P, Storniolo AM, Kelsen DP, A pilot clinical/pharmacological study of the protein kinase C-specific inhibitor safingol alone and in combination with doxorubicin, Clin. Cancer. Res, 3 (1997) 537–543. [PubMed] [Google Scholar]
- [9].Jarvis WD, Fornari FA, Tombes RM, Erukulla RK, Bittman R, Schwartz GK, Dent P, Grant S, Evidence for involvement of mitogen-activated protein kinase, rather than stress-activated protein kinase, in potentiation of 1-beta-D-arabinofuranosylcytosine-induced apoptosis by interruption of protein kinase C signaling, Mol. Pharmacol, 54 (1998) 844–856. [DOI] [PubMed] [Google Scholar]
- [10].Schwartz GK, Haimovitz-Friedman A, Dhupar SK, Ehleiter D, Maslak P, Lai L, Loganzo F Jr., Kelsen DP, Fuks Z, Albino AP, Potentiation of apoptosis by treatment with the protein kinase C-specific inhibitor safingol in mitomycin C-treated gastric cancer cells, J. Natl. Cancer Inst, 87 (1995) 1394–1399. [DOI] [PubMed] [Google Scholar]
- [11].Hoffmann TK, Leenen K, Hafner D, Balz V, Gerharz CD, Grund A, Ballo H, Hauser U, Bier H Antitumor activity of protein kinase C inhibitors and cisplatin in human head and neck squamous cell carcinoma lines, Anti-Cancer Drugs, 13 (2002) 93–100. [DOI] [PubMed] [Google Scholar]
- [12].Maurer BJ, Melton L, Billups C, Cabot MC, Reynolds CP, Synergistic Cytotoxicity in Solid Tumor Cell Lines Between N-(4-Hydroxyphenyl)retinamide and Modulators of Ceramide Metabolism, JNCI: Journal of the National Cancer Institute, 92 (2000) 1897–1909. [DOI] [PubMed] [Google Scholar]
- [13].Tan K-B, Ling L-U, Bunte RM, Chng W-J, Chiu GNC, In vivo efficacy of a novel liposomal formulation of safingol in the treatment of acute myeloid leukemia, J. Controlled Release, 160 (2012) 290–298. [DOI] [PubMed] [Google Scholar]
- [14].Dickson MA, Carvajal RD, Merrill AH, Gonen M, LM. Cane, G.K. Schwartz, APhase I Clinical Trial of Safingol in Combination with Cisplatin in Advanced Solid Tumors, Clin. Cancer. Res, 17 (2011) 2484–2492. [DOI] [PMC free article] [PubMed] [Google Scholar]
- [15].Dragusin M, Gurgui C, Schwarzmann G, Hoernschemeyer J, van Echten-Deckert G, Metabolism of the unnatural anticancer lipid safingol, 1-threo-dihydrosphingosine, in cultured cells, J. Lipid Res, 44 (2003) 1772–1779. [DOI] [PubMed] [Google Scholar]
- [16].Merrill AH, Wang E, Mullins RE, Jamison WCL, Nimkar S, Liotta DC, Quantitation of free sphingosine in liver by high-performance liquid chromatography, Anal. Biochem, 171 (1988) 373–381. [DOI] [PubMed] [Google Scholar]
- [17].Ohta H, Ruan FQ, Hakomori S, Igarashi Y, Quantification of Free Sphingosine in Cultured Cells by Acylation with Radioactive Acetic Anhydride, Anal. Biochem, 222 (1994) 489–494. [DOI] [PubMed] [Google Scholar]
- [18].Van Echten-Deckert G, [7] - Sphingolipid Extraction and Analysis by Thin-Layer Chromatography, in: Merrill AH, Hannun YA (Eds.) Methods Enzymol, Academic Press; 2000, pp. 64–79. [DOI] [PubMed] [Google Scholar]
- [19].Ito M, Functional Analysis of Sphingolipids Using a Specific Enzyme and Animal Cells, in: Shirahata S, Teruya K, Katakura Y (Eds.) Animal Cell Technology: Basic & Applied Aspects: Proceedings of the Thirteenth Annual Meeting of the Japanese Association for Animal Cell Technology (JAACT), Fukuoka-Karatsu, November 16–21, 2000, Springer Netherlands, Dordrecht, 2002, pp. 63–66. [Google Scholar]
- [20].Lee J-S, Singh H, Maurer BJ, Patrick Reynolds C, Kang MH, Simultaneous Determination of Safingol and d-erythro-Sphinganine in Human Plasma by LC with Fluorescence Detection, Chromatographia, 71 (2010) 1087–1091. [Google Scholar]
- [21].Sullards MC, Liu Y, Chen Y, Merrill AH, Analysis of mammalian sphingolipids by liquid chromatography tandem mass spectrometry (LC-MS/MS) and tissue imaging mass spectrometry (TIMS), Biochim. Biophys. Acta, 1811 (2011) 838–853. [DOI] [PMC free article] [PubMed] [Google Scholar]
- [22].Mano N, Oda Y, Yamada K, Asakawa N, Katayama K, Simultaneous Quantitative Determination Method for Sphingolipid Metabolites by Liquid Chromatography/Ionspray Ionization Tandem Mass Spectrometry, Anal. Biochem, 244 (1997) 291–300. [DOI] [PubMed] [Google Scholar]
- [23].Ebinger K, Weller HN, Comparison of chromatographic techniques for diastereomer separation of a diverse set of drug-like compounds, J. Chromatogr. A, 1272 (2013) 150–154. [DOI] [PubMed] [Google Scholar]
- [24].Fekete J, Milen M, Hazai L, Poppe L, Szantay C, Kettrup A, Gebefiigi I , Comparative study on separation of diastereomers by HPLC, Chromatographia, 57 (2003) 147–153. [Google Scholar]
- [25].Morales PR, Dillehay DL, Moody SJ, Pallas DC, Pruett S, Allgood JC, Symolon H, Merrill AH, Safingol Toxicology After Oral Administration to TRAMP Mice: Demonstration of Safingol Uptake and Metabolism by N-Acylation and N-Methylation, Drug Chem. Toxicol, 30 (2007) 197–216. [DOI] [PubMed] [Google Scholar]
- [26].Scherer M, Leuthauser-Jaschinski K, Ecker J, Schmitz G, Liebisch G, A rapid and quantitative LC-MS/MS method to profile sphingolipids, J. Lipid Res, 51 (2010) 2001–2011. [DOI] [PMC free article] [PubMed] [Google Scholar]
- [27].Aturki Z, D’Orazio G, Rocco A, Si-Ahmed K, Fanali S, Investigation of polar stationary phases for the separation of sympathomimetic drugs with nano-liquid chromatography in hydrophilic interaction liquid chromatography mode, Anal. Chim. Acta, 685 (2011) 103–110. [DOI] [PubMed] [Google Scholar]
- [28].Romand S, Rudaz S, Guillarme D, Separation of substrates and closely related glucuronide metabolites using various chromatographic modes, J. Chromatogr. A, 1435 (2016) 54–65. [DOI] [PubMed] [Google Scholar]
- [29].Joshi N, Dhamarlapati B, Pillai A, Paulose J, Tan J, Blue LE, Tedrow J, Farrell B, Separation and quantitation of eight isomers in a molecule with three stereogenic centers by normal phase liquid chromatography, J. Chromatogr. A, 1538 (2018) 108–111. [DOI] [PubMed] [Google Scholar]
- [30].von Gerichten J, Schlosser K, Lamprecht D, Morace I, Eckhardt M, Wachten D, Jennemann R, GrÖne H-J, Mack M, Sandhoff R, Diastereomer-specific quantification of bioactive hexosylceramides from bacteria and mammals, J. Lipid Res, 58 (2017) 1247–1258. [DOI] [PMC free article] [PubMed] [Google Scholar]
- [31].Heaton J, Gray N, Cowan DA, Plumb RS, Legido-Quigley C, Smith NW, Comparison of reversed-phase and hydrophilic interaction liquid chromatography for the separation of ephedrines, J. Chromatogr. A, 1228 (2012) 329–337. [DOI] [PubMed] [Google Scholar]
- [32].US Food and Drug Administration, FDA Guidance for Industry: Bioanalytical Method Validation, DOI (2013).
- [33].Cho HE, Min HK, Analysis of fenretinide and its metabolites in human plasma by liquid chromatography–tandem mass spectrometry and its application to clinical pharmacokinetics, J. Pharm. Biomed. Anal, 132 (2017) 117–124. [DOI] [PMC free article] [PubMed] [Google Scholar]
- [34].Folch J, Lees M, Stanley GHS, A SIMPLE METHOD FOR THE ISOLATION AND PURIFICATION OF TOTAL LIPIDES FROM ANIMAL TISSUES, J. Biol. Chem, 226 (1957) 497–509. [PubMed] [Google Scholar]
- [35].Bligh EG, Dyer WJ, A RAPID METHOD OF TOTAL LIPID EXTRACTION AND PURIFICATION, Can. J. Biochem. Physiol, 37 (1959) 911–917. [DOI] [PubMed] [Google Scholar]