Abstract
Oligomeric amyloid structures are crucial therapeutic targets in Alzheimer’s and other amyloid diseases. However, these oligomers are too small to be resolved by standard light microscopy. We have developed a simple and versatile tool to image amyloid structures using Thioflavin T without the need for covalent labeling or immunostaining. Dynamic binding of single dye molecules generates photon bursts that are used for fluorophore localization on a nanometer scale. Thus, photobleaching cannot degrade image quality, allowing for extended observation times. Super-resolution Transient Amyloid Binding (TAB) microscopy promises to directly image native amyloid using standard probes and record amyloid dynamics over minutes to days. We imaged amyloid fibrils from multiple polypeptides, oligomeric, and fibrillar structures formed during different stages of amyloid-β aggregation, as well as the structural remodeling of amyloid-β fibrils by the compound epi-gallocatechin gallate (EGCG).
Keywords: amyloid beta-peptides, long-term imaging, single-molecule localization microscopy, single-molecule studies
Graphical Abstract

Transient amyloid binding (TAB) imaging resolves amyloid structures at a nanometer scale using standard probes, Thioflavin T (ThT), without the need for covalent modification or immunostaining of amyloids. Binding dynamics and blinking of ThT molecules on amyloids enables continuous imaging over extended times without image degradation due to photobleaching, and gives robust imaging to various amyloid structures and imaging conditions.
Amyloid diseases, such as Alzheimer’s disease (AD) and Type II diabetes are the most prevalent, yet incurable, aging-related diseases. Protein misfolding and amyloid formation underlie their disease progression.[1] The 42 amino-acid residue amyloid-beta peptide (Aβ42) is the main component of extracellular plaques in the brains of AD patients.[2,3] Nanometer-sized aggregation intermediates are the main culprits in amyloid toxicity.[4,5] A quantitative understanding of their dynamics requires new tools that can visualize these structures, which are too small to be resolved by conventional light microscopy.
Single-molecule (SM) super-resolution (SR) fluorescence microscopy techniques, such as (f)PALM,[6,7] (d)STORM,[8,9] and others, overcome the resolution barrier posed by optical diffraction (~250 nm for visible light) and allow us to visualize structures with nanoscale resolution in living cells. Utilizing a variety of mechanisms,[10,11] most techniques rely upon switching these molecules between bright and dark states to reduce the effective concentration of fluorescing molecules within a sample. A related SM-SR technique, called PAINT,[12] uses combinations of fluorophore binding and unbinding, diffusion into and out of the imaging plane, and/or spectral shifts upon binding to generate flashes of SM fluorescence. In these SR techniques, many blinking events are recorded over time, and image-processing algorithms[13] measure the position of each bright molecule with high precision. A SR image is reconstructed in a “pointillist” fashion from the locations of these single fluorophores.[14–16]
SR microscopy commonly leverages tagging techniques that involve covalent attachment[9,17–19] or intrinsical intercalation[20] of a fluorophore to the biomolecule of interest. To produce highresolution images, biological targets must be densely labeled with fluorescent molecules,[21,22] which can potentially alter the structure of interest. Furthermore, photobleaching of tagged fluorescent molecules limits measurement time and prevents long-term imaging of targets. Recently, following the development of PAINT, binding-activated or transiently-binding probes have expanded the scope of SR imaging to functional studies.[23–25] When in the immediate vicinity of their target, these probes either become fluorescent, temporarily bind to the target, or both, thereby creating a “flash” of fluorescence that is used to locate the target of interest. Amyloidophilic dyes such as Thioflavin T (ThT), Thioflavin S, and Congo red specifically bind to structural motifs of amyloid.[26,27] Their absorbance and fluorescence have been used for close to 100 years in the histological staining of amyloid structures and in resolving aggregation kinetics in vitro.[21–29]
Here, we report a technique to image amyloid structures on the nanometer scale, called Transient Amyloid Binding (TAB) imaging. TAB imaging uses standard amyloid dyes such as Thioflavin T, without the need for covalent modification of the amyloid protein or immunostaining. Our technique mates SR microscopy with histological staining techniques and is compatible with epi-fluorescence and total internal reflection fluorescence (TIRF) microscopy. We therefore envision that it will allow a much wider application of SR imaging to the diagnosis and cellular study of amyloid diseases than was previously possible.
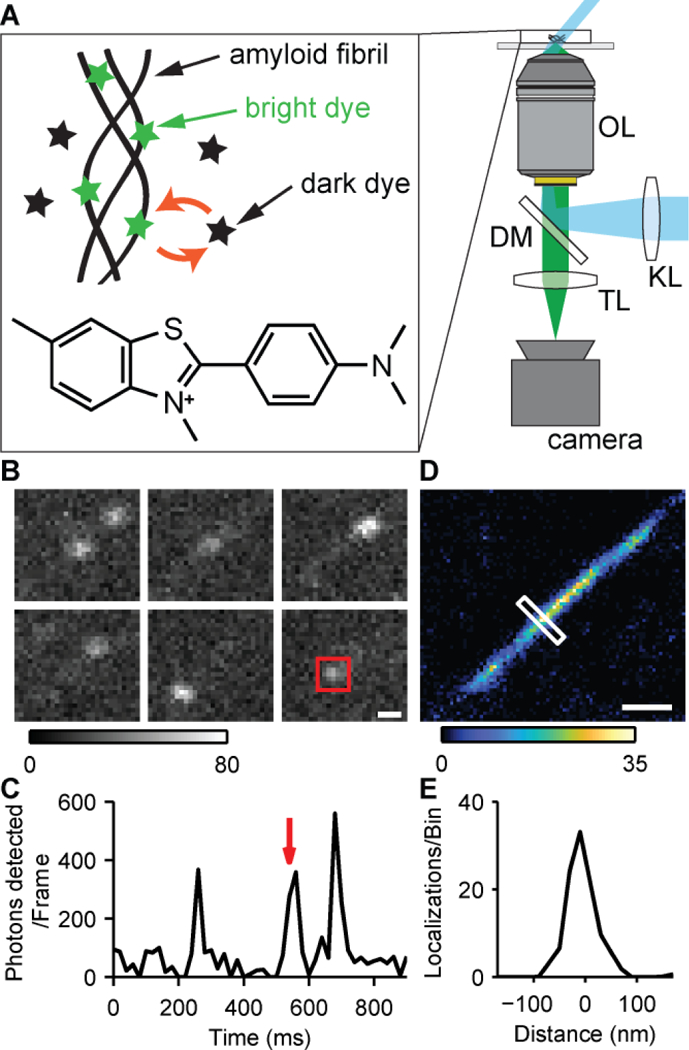
The fluorescence of ThT increases upon binding to amyloid proteins, transforming dark ThT in solution into its bright state.[26,30] The molecules emit fluorescence until they photobleach or dissociate from the structure. These transient binding dynamics enabled us to record movies of ‘blinking’ ThT molecules, localize their positions with high precision, and reconstruct the underlying amyloid structure. To demonstrate the concept of TAB imaging, we imaged Aβ42 fibrils adsorbed to an imaging chamber using an epi-fluorescence microscope with a highly-inclined 488-nm excitation laser (Figs. 1A and S1A, and Table S1). An imaging buffer containing 1 – 2.5 μM ThT, was pipetted into the chamber (Supporting Note 11, and Table S2), and 5,000–10,000 imaging frames were recorded with 20 ms camera exposure. The image sequence (Fig. 1B) and temporal trace of photons detected (Fig. 1C) demonstrate the blinking of single ThT molecules. We found that each blinking event on average lasted 12 ms (Supporting Note 16, Fig. S2). A SR image with 20×20 nm2 bin size (Fig. 1D) was reconstructed from multiple blinking events using ThunderSTORM[31] and a custom postprocessing algorithm (Supporting Notes 13–15). The measured full-width at half-maximum (FWHM) of the reconstructed Aβ42 fibril over the length of the fibril is 60 ± 10 nm (Fig. 1E). Typical amyloid fibrils have diameters of 8–12 nm[32]. The measured width of the fibril likely arises from our localization precision[33] of 17 nm (FWHM: 40 nm), corresponding to a median of 296 photons detected per ThT localization (Table S3).
Figure 1.

TAB microscopy. (A) Pseudo-TIRF illumination (cyan) excites fluorophores within the sample, and collected fluorescence (green) is imaged onto a camera. KL, widefield lens; OL, objective lens; DM, dichroic mirror; TL, tube lens. Two epi-fluorescence microscopes (1 and 2) were used for image acquisition (Fig. S1, Table S1). Inset: transient binding, fluorescence activation, and unbinding of ThT and its chemical structure. (B) ThT blinking on an Aβ42 fibril. Scale bar: 300 nm. Grey scale: photons/pixel. (C) Integrated photons detected over time within the red square in B. The red arrow indicates the frame containing the square in B. (D) TAB SR image of the Aβ42 fibril. Scale bar: 300 nm. Color scale: localizations/bin. (E) Cross-section of the white box across the fibril in D.
The blinking characteristics of ThT are determined by the binding and photobleaching kinetics of the dye. Binding affinity and specificity may be affected by hydrophobic interactions[34]. Therefore, we varied the NaCl concentration and pH as well as ThT concentration of the buffer to test their influence on ThT blinking (Supporting Note 17, Fig. S3). We found that the NaCl concentrations (10 – 500 mM) and pH of the imaging buffer (6.0 – 8.6) had little effect on the blinking of ThT on Aβ42 fibrils. However, high NaCl concentration (500 mM) and low pH (6.0) lowered the fluorescence background of unbound ThT. This corresponds to fewer bursts that occurred off of the amyloid fibril, thus improving TAB imaging performance. On the other hand, we also found that the blinking rate of ThT, and thus the rate of localizations per time, is approximately proportional to ThT concentration. In this paper, the ThT concentration was chosen to maximize the localization rate of ThT binding events while avoiding too much fluorescence background. These results demonstrate that TAB imaging of amyloid structures is amenable to a wide variety of buffer conditions. Unlike other SR methods that employ photoswitching of organic dyes,[9] TAB does not require the addition of specific reducing agents or oxygen scavengers[18] to the buffer.
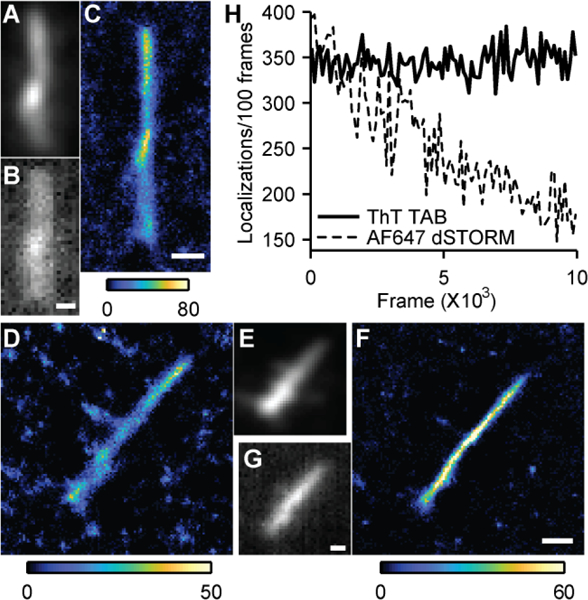
We verified that TAB SR imaging faithfully reproduces the structure of Aβ fibrils by comparing TAB images to those of conventional fluorescent tags. First, Aβ42 fibrils were intrinsically labeled with Alexa-647 and imaged using conventional epifluorescence microscopy. Their morphology matched the TAB SR image of the same fibril (Figs. 2A-C). Next, we directly compared SR TAB images to dSTORM imaging. Aβ42 fibrils were tagged using monoclonal anti-Aβ antibody 6E10 and Alexa-647 labeled goat-anti-mouse secondary antibody, and imaged by dSTORM of the Alexa-647 dye, followed by TAB imaging of the ThT dye. Typical dSTORM imaging using Alexa-647 gives localization precision of 6 nm (FWHM: 14 nm) that corresponds to 3,700 photons detected per localization (Fig. S4 and Table S3). Both dSTORM and TAB imaging reveal a thin and uniform fibril structure (Figs. 2D-G). Reconstructed images from SR TAB microscopy gave comparable or better resolution than the conventional label-based SR technique. The measured FWHM of the reconstructed Aβ42 fibril using Alexa-647 was 80 ± 30 nm (Fig. 2D), while the TAB reconstruction on the same fibril yielded a FWHM of 60 ± 10 nm (Fig. 2F). This resolution is comparable to reported apparent fibril widths of 40–50 nm via dSTORM imaging using covalently modified Aβ.[18] A resolution of 14 nm was reported for synuclein fibrils that were imaged via binding activated fluorescence using a conjugated oligothiophene p-FTAA.[23] However, this resolution was achieved at the expense of limited observation times. Our results also demonstrate that the TAB technique relaxes the challenges stemming from the high labeling density and uniformity requirements[22] of conventional SR methods.
Figure 2.

TAB SR imaging compared to conventional labelling. (A) Diffraction-limited image of an intrinsically-labeled Aβ42 fibril (4.2 % Aβ42-Alexa 647). (B) Diffraction-limited ThT image of the fibril in A. (C) TAB SR image of the fibril in A. (D) Conventional SR image of an Aβ42 fibril using Alexa-647 antibody staining. (E) Diffraction-limited image of D using Alexa-647. (F) TAB SR image of D. (G) Diffraction-limited ThT image of D. Color bars: localizations/bin. Scale bars: 300 nm. (H) Localizations per 100 frames over time for TAB and dSTORM imaging.
We next explored the versatility of ThT as a probe for TAB imaging of various amyloid structures (Fig. S5). We prepared fibrils of Aβ40, α-synuclein, islet amyloid polypeptide (IAPP), tau protein and light chain (AL) amyloid, adsorbed them to glass surfaces, and imaged them. We were able to reconstruct images with apparent fibril widths of 40 – 80 nm for all polypeptides, which demonstrates that ThT can be used for SR imaging across a wide variety of targets. Some amyloids produced reconstructions with wider apparent fibril widths than others, which may reflect differences in the binding affinities and the quantum yields of ThT on different fibrillar structures.[26,35] The synthesis and characterization of new dyes with different affinities may improve TAB image quality on such amyloids in the future.
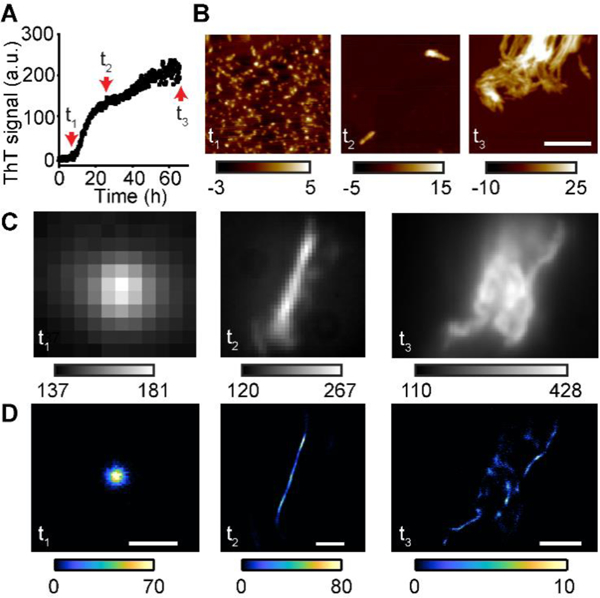
Thioflavin T is well-known to bind to mature amyloid fibrils. However, it would be valuable to also image intermediates of the aggregation pathway. We therefore explored whether TAB imaging could visualize different stages of the amyloid aggregation process. We generated Aβ40 aggregates from the late lag phase (t1, 8 h), the growth phase (t2, 24 h), and the late plateau phase (t3, 66 h) of ThT kinetics (Fig. 3A) and verified aggregate morphologies by atomic force microscopy (AFM, Fig. 3B). Aggregates from t1 corresponded to spherical oligomers, t2 to single fibrils, and t3 to fibril clusters, respectively.
Figure 3.

Visualization of Aβ40 structures at various aggregation stages. (A) Aggregation kinetics of Aβ40 measured by ThT fluorescence. t1 (8 h), t2 (24 h), and t3 (66 h) represent oligomers, early fibrils and late fibril clusters, respectively. (B) AFM images of Aβ40 at t1, t2, and t3. Color bar in nm. Scale bars: 350 nm. (C) Diffraction-limited images of Aβ40 aggregates using ThT fluorescence at t1, t2, and t3. (D) TAB SR images of the structures in C. Fluorescence from out-of-focus structures decreased localizations in t3. Scale bars for t1, t2, and t3 are 0.5, 1, and 2.5 μm, respectively.
We performed TAB imaging of the Aβ40 aggregates in a pseudo-TIRF microscope (Fig. S1B). Strikingly, TAB imaging was able to reconstruct spherical Aβ40 structures from an early stage of aggregation (Fig. 3D). These structures were measured to have dimensions of 4 – 5 nm by AFM, and therefore constitute typical Aβ40 oligomers.[36] Being able to accurately image oligomeric structures is important to capture the dynamics of Aβ aggregation and may open the door for future applications in cellular imaging of oligomeric structures.
To image the dynamics of amyloid formation, it is essential to have a robust tool that can follow the structure of a single aggregate over hours or more. We analyzed the stability of TAB imaging over time in three ways. First, we tested whether the localization rate remained constant within a single imaging experiment. We counted localization events in blocks of 100 frames across fibrils of various sizes and observed that the number of localizations did not change during the acquisition of an image stack (typically 1.5–3.5 min., Fig. 2H, Fig. S6A). In contrast, the localization rate of Alexa-647 in dSTORM dropped to less than half in a similar time frame.
Further, we tested whether the localization rate remained constant over extended observation times. We imaged an Aβ42 fibril 17 times over 24 h, and counted localization events in blocks of 100 frames for each acquisition. We observed that the TAB reconstructions and the number of localizations remained approximately constant over the 24-hour acquisition (Fig. S6B and C). Therefore, TAB imaging with ThT is robust to photobleaching and capable of producing multiple time-lapse SR images, which can involve the localization of over 100,000 ThT molecules on a single fibril.
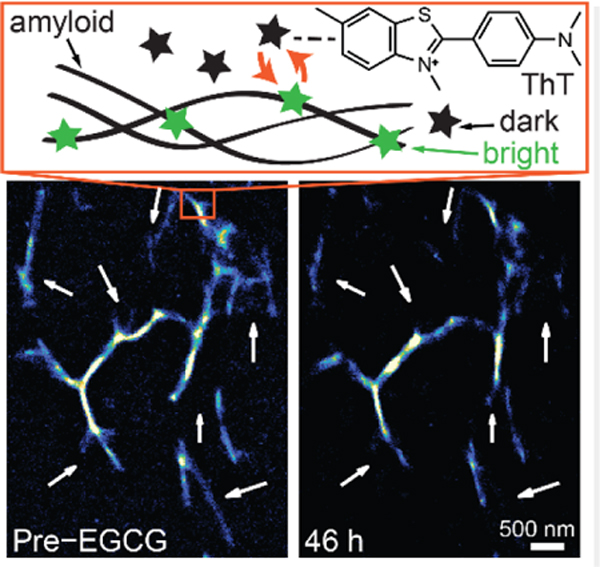
We next validated the capability of TAB for SR imaging over the course of hours to days. The time-lapse images (Figs. 4 and S7, and Movie S1) show the dissolution and remodeling of Aβ42 fibrils by epi-gallocatechin gallate (EGCG). Remarkably, TAB imaging captured the structural dynamics of amyloid fibrils for ~2 days, allowing us to observe remodeling over tens of micrometers with ~16 nm precision. In this experiment, we observed dynamics that were slower than at 37°C in solution,[36] most likely due to the lack of agitation of fibrils that were adsorbed to the glass surface and to incubation at room temperature.
Figure 4.

TAB SR images of Aβ42 fibril remodeling. (A) Aβ42 before and after a 46-hour reaction with EGCG (1 mM). White arrows denote regions with distinct changes. Scale bar: 500 nm. (B and C) Time-lapse TAB images of regions denoted by red squares in A, recorded before and 3, 10, 25, and 46 h after adding EGCG; scale bar: 200 nm; color bar denotes localizations/bin.
In contrast, photobleaching of dyes limits observation times in conventional SR techniques.[9] Previous studies using binding-activated probe molecules also had limited observation times, since the probe molecules bound irreversibly to the amyloid fibril.[23] Since TAB generates blinking by transient ThT binding, it is inherently robust to photobleaching. It should be noted that fluorescence background increased in the presence of EGCG. This increase is most likely because EGCG, a potent antioxidant, reduces photobleaching of ThT like other antioxidants, such as ascorbic acid, increases the number of photons per blinking event in other SR imaging.[37]
The success of these experiments demonstrates the capability of TAB imaging to follow the dynamics of amyloid structures with nanometer resolution and ~minute temporal resolution over extended periods. This capability will be essential for visualizing drugs acting on amyloid structures to gain insight into their molecular-scale interactions with amyloid structures.
Previous studies have imaged ThT binding to dried amyloid samples through photoactivation (dSTORM).[20] We report SR imaging of a wide variety of fibrils and aggregation intermediates using transient binding of one of the most widely used amyloid dyes, Thioflavin T, which allows for extended observation times compared to dSTORM and similar techniques. While the use of binding dynamics of novel amyloid dye molecules may increase photon yield,[38] the ubiquity and versatility of ThT in amyloid staining should facilitate its adoption in nanoscopic imaging. We therefore expect that the use of TAB imaging can be expanded easily to a variety of substrates and conditions.
A critical challenge in preparing samples for SR microscopy is the need for high labeling density and uniformity, necessitating a large number of covalent modifications of, or antibodies attached to, the biomolecule of interest. Transient binding strategies, like PAINT and TAB imaging, reduce the complexity of sample preparation but potentially at the cost of requiring specific buffer conditions for efficient single-molecule blinking. Further, some transient labeling strategies, whose fluorophores emit fluorescence regardless of their binding state, require TIRF illumination to reduce background fluorescence for single-molecule imaging. Our results demonstrate that TAB SR microscopy maintains the simplicity of transient labeling methods while remaining robust to a wide variety of imaging conditions. ThT blinking is readily detectable across a range of pH and salt concentrations. TAB SR imaging performs well with both widefield epi-fluorescence and TIRF illumination strategies, because ThT becomes much brighter when bound to amyloid than in its unbound state. This flexibility and robustness allow TAB imaging to work in tandem with other dyes or molecules that probe specific proteins or biomolecules. TAB SR microscopy is also adept at continuous imaging for long periods of time without image degradation due to photobleaching, a major advantage over conventional SR techniques.
In summary, TAB SR microscopy is a flexible imaging technique that can provide images of amyloid structures with nanometer resolution over observation times of hours. It is capable of imaging various stages of amyloid aggregation as well as dynamic imaging of fibrillar remodeling by an anti-amyloid drug. Nanoscale imaging of aggregation intermediates will provide a clearer understanding of which structures are toxic to cells and will pave the road for further study into molecular mechanisms of AD and other amyloid diseases.
Experimental Section
All experimental details can be found in the accompanying supporting information.
Supplementary Material
Acknowledgements
Research reported in this publication was supported by the National Science Foundation under grant number ECCS- 1653777 and by the National Institute of General Medical Sciences of the National Institutes of Health under grant number R35GM124858 to MDL, and the Hope Center for Neurological Disorders pilot grant to JB. The authors would like to thank E. Illes-Toth and K. Andrich for protein preparation; B. Holmes and M. Diamond (UT Southwest) for the gift of tau protein, U. Hegenbart and S. Schönland (Amyloidosezentrum Heidelberg) for providing LC samples, and O. Zhang for technical assistance.
Footnotes
Supporting information for this article is given via a link at the end of the document.
References
- [1].Harper JD, Lansbury PT, Annu. Rev. Biochem. 1997, 66, 385–407. [DOI] [PubMed] [Google Scholar]
- [2].Masters CL, Simms G, Weinman NA, Multhaup G, McDonald BL, Beyreuther K, Proc. Natl. Acad. Sci. 1985, 82, 4245–4249. [DOI] [PMC free article] [PubMed] [Google Scholar]
- [3].Beyreuther K, Masters CL, Brain Pathol. 1991, 1, 241–251. [DOI] [PubMed] [Google Scholar]
- [4].Cohen E, Bieschke J, Perciavalle RM, Kelly JW, Dillin A, Science 2006, 313, 1604–1610. [DOI] [PubMed] [Google Scholar]
- [5].Haass C, Selkoe DJ, Nat. Rev. Mol. Cell Biol. 2007, 8, 101–12. [DOI] [PubMed] [Google Scholar]
- [6].Betzig E, Patterson GH, Sougrat R, Lindwasser OW, Olenych S, Bonifacino JS, Davidson MW, Lippincott-Schwartz J, Hess HF, Science 2006, 313, 1642–1645. [DOI] [PubMed] [Google Scholar]
- [7].Hess ST, Girirajan TPK, Mason MD, Biophys. J. 2006, 91, 4258–72. [DOI] [PMC free article] [PubMed] [Google Scholar]
- [8].Rust MJ, Bates M, Zhuang XW, Nat Methods 2006, 3, 793–795. [DOI] [PMC free article] [PubMed] [Google Scholar]
- [9].Heilemann M, van de Linde S, Schüttpelz M, Kasper R, Seefeldt B, Mukherjee A, Tinnefeld P, Sauer M, Angew. Chemie Int. Ed. 2008, 47, 6172–6176. [DOI] [PubMed] [Google Scholar]
- [10].Ha T, Tinnefeld P, Annu. Rev. Phys. Chem. 2012, 63, 595–617. [DOI] [PMC free article] [PubMed] [Google Scholar]
- [11].Kozankiewicz B, Orrit M, Chem. Soc. Rev. 2014, 43, 1029–1043. [DOI] [PubMed] [Google Scholar]
- [12].Sharonov A, Hochstrasser RM, Proc. Natl. Acad. Sci. 2006, 103, 18911–18916. [DOI] [PMC free article] [PubMed] [Google Scholar]
- [13].Sage D, Kirshner H, Pengo T, Stuurman N, Min J, Manley S, Unser M, Nat. Methods 2015, 12, 717–724. [DOI] [PubMed] [Google Scholar]
- [14].Betzig E, Angew. Chemie Int. Ed. 2015, 54, 8034–8053. [DOI] [PubMed] [Google Scholar]
- [15].Hell SW, Angew. Chemie Int. Ed. 2015, 54, 8054–8066. [DOI] [PubMed] [Google Scholar]
- [16].Moerner WE, Angew. Chemie Int. Ed. 2015, 54, 8067–8093. [DOI] [PubMed] [Google Scholar]
- [17].Eggeling C, Heilemann M, Curr. Opin. Chem. Biol. 2014, 20, v–vii. [DOI] [PubMed] [Google Scholar]
- [18].Kaminski Schierle G. S., van de Linde S, Erdelyi M, Esbjörner EK, Klein T, Rees E, Bertoncini CW, Dobson CM, Sauer M, Kaminski CF, J. Am. Chem. Soc. 2011, 133, 12902–12905. [DOI] [PubMed] [Google Scholar]
- [19].Pinotsi D, Kaminski Schierle GS, Kaminski CF, in Syst. Biol. Alzheimer’s Dis, Humana Press, New York, NY, 2016, pp. 125–141. [Google Scholar]
- [20].Shaban HA, Valades-Cruz CA, Savatier J, Brasselet S, Sci. Rep. 2017, 7, 1–10. [DOI] [PMC free article] [PubMed] [Google Scholar]
- [21].Shroff H, Galbraith CG, Galbraith JA, Betzig E, Nat. Methods 2008, 5, 417–423. [DOI] [PMC free article] [PubMed] [Google Scholar]
- [22].Nieuwenhuizen RPJ, a Lidke K, Bates M, Puig DL, Grünwald D, Stallinga S, Rieger B, Nat. Methods 2013, 10, 557–562. [DOI] [PMC free article] [PubMed] [Google Scholar]
- [23].Ries J, Udayar V, Soragni A, Hornemann S, Nilsson KPR, Riek R, Hock C, Ewers H, Aguzzi AA, Rajendran L, ACS Chem. Neurosci. 2013, 4, 1057–1061. [DOI] [PMC free article] [PubMed] [Google Scholar]
- [24].Jungmann R, Avendano MS, Woehrstein JB, Dai M, Shih WM, Yin P, Nat. Methods 2014, 11, 313–318. [DOI] [PMC free article] [PubMed] [Google Scholar]
- [25].Molle J, Raab M, Holzmeister S, Schmitt-Monreal D, Grohmann D, He Z, Tinnefeld P, Curr. Opin. Biotechnol. 2016, 39, 8–16. [DOI] [PubMed] [Google Scholar]
- [26].Biancalana M, Koide S, Biochim. Biophys. Acta - Proteins Proteomics 2010, 1804, 1405–1412. [DOI] [PMC free article] [PubMed] [Google Scholar]
- [27].LeVine H, in Methods Enzymol, Elsevier Inc., 1999, pp. 274–284. [DOI] [PubMed] [Google Scholar]
- [28].Bennhold H, Münchener Medizinische Wochenschriften 1922, 1537. [Google Scholar]
- [29].Ban T, Hamada D, Hasegawa K, Naiki H, Goto Y, J. Biol. Chem. 2003, 278, 16462–16465. [DOI] [PubMed] [Google Scholar]
- [30].Sulatskaya AI, Kuznetsova IM, Belousov MV, Bondarev SA, Zhouravleva GA, Turoverov KK, PLoS One 2016, 11, e0156314. [DOI] [PMC free article] [PubMed] [Google Scholar]
- [31].Ovesný M, Křίžk P, Borkovec J, Švindrych Z, Hagen GM, Bioinformatics 2014, 30, 2389–2390. [DOI] [PMC free article] [PubMed] [Google Scholar]
- [32].Roher AE, Chaney MO, Kuo Y, Webster SD, Stine WB, Haverkamp LJ, Woods AS, Cotter RJ, Tuohy JM, a Krafft G, et al. , J. Biol. Chem. 1996, 271, 20631–20635. [DOI] [PubMed] [Google Scholar]
- [33].Rieger B, Stallinga S, ChemPhysChem 2014, 15, 664–670. [DOI] [PubMed] [Google Scholar]
- [34].Hu Y, Guo T, Ye X, Li Q, Guo M, Liu H, Wu Z, Chem. Eng. J. 2013, 228, 392–397. [Google Scholar]
- [35].Wu C, Biancalana M, Koide S, Shea J-E, J. Mol. Biol. 2009, 394, 627–633. [DOI] [PubMed] [Google Scholar]
- [36].Bieschke J, Russ J, Friedrich RP, Ehrnhoefer DE, Wobst H, Neugebauer K, Wanker EE, Proc. Natl. Acad. Sci. 2010, 107, 7710–7715. [DOI] [PMC free article] [PubMed] [Google Scholar]
- [37].Aitken CE, Marshall RA, Puglisi JD, Biophys. J. 2008, 94, 1826–1835. [DOI] [PMC free article] [PubMed] [Google Scholar]
- [38].Baldwin AJ, Knowles TPJ, Tartaglia GG, Fitzpatrick AW, Devlin GL, Shammas SL, Waudby CA, Mossuto MF, Meehan S, Gras SL, et al. , J. Am. Chem. Soc. 2011, 133, 14160–14163. [DOI] [PubMed] [Google Scholar]
Associated Data
This section collects any data citations, data availability statements, or supplementary materials included in this article.


