Abstract
This paper proposes a modified spatially-constrained similarity measure (mSCSM) method for endosomal structure detection and localization under the bag-of-words (BoW) framework. To our best knowledge, the proposed mSCSM is the first method for fully automatic detection and localization of complex subcellular compartments like endosomes. Essentially, a new similarity score and a novel two-stage output control scheme are proposed for localization by extracting discriminative information within a group of query images. Compared with the original SCSM which is formulated for instance localization, the proposed mSCSM can address category based localization problems. The preliminary experimental results show the proposed mSCSM can correctly detect and localize 79.17% of the existing endosomal structures in the microscopic images of human myeloid endothelial cells.
Keywords: spatially-constrained similarity measure (SCSM), endosomal structures, bag-of-words (BoW), histogram intersection
I. Introduction
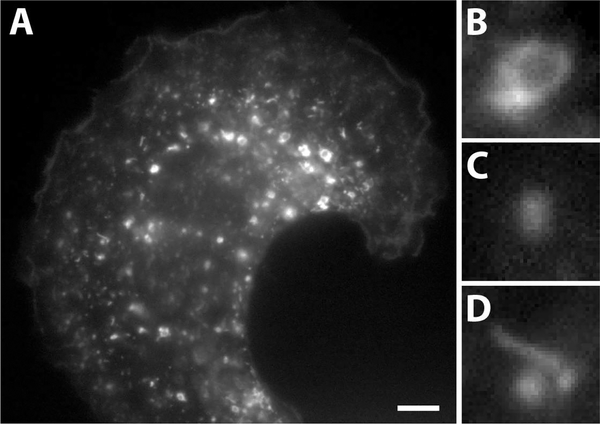
In cell biology, proteins which localize to particular subcellular compartments (organelles) may be imaged via fluorescence microscopy to produce snapshots of these organelles inside the cells. These organelle localization images are generally segmented and processed manually, owing to the complexity in morphology, variations in intensities among individual organelles and overlap between neighboring structures in dense images (Fig. 1A). Endosomes are one such type of subcellular organelles that are found in all eukaryotic cells and function as transport compartments that shuttle proteins, nutrients and other materials between different destinations in the cell [1]. They generally appear in 2-dimensional fluorescence microscopic images as hollow ring-like structures (Fig. 1B), diffraction-limited spots (Fig. 1C) or tubule-like structures (Fig. 1D). One of the problems of relevance to drug discovery is the identification of ring-like endosomal structures, which would allow the assessment of the effectiveness of a particular class of drugs called therapeutic monoclonal antibodies [2].
Fig. 1.
A microscopy image of endosomes in a cell and magnified images of representative structures. (A) A grayscale fluorescence microscopy image of a human myeloid endothelial cell expressing the fluorescently tagged marker protein, neonatal Fc Receptor (FcRn). (B) Ring-like endosomes. (C) Diffraction limited spots. (D) Tubule-like structures. Scale bar = 5 μm.
While attempts have been made in the past to use automated methods to identify subcellular compartments, the methods were either used for classification of entire images of a single compartment [3] or focused on lower-magnification segmentation tasks like identification of cell nuclei (which often comprise more than 50% volume of the cell) in large tissue samples [4]. However, these methods were not tested or optimized for their efficiency in localizing complex subcellular compartment types, e.g., endosomes.
In this paper, we propose a method which can automatically detect and localize endosomal structures in florescence microscopic images under the popular bag-of-words (BoW) framework. BoW is one of the state-of-the-art approaches for object retrieval and localization [5][6][7]. In this framework, it firstly vector quantizes (VQ) local features of images into clusters and defines centers of these clusters as visual words. Then, an image is represented as a histogram of visual words through assigning its local features to their nearest visual word. Ref. [6] proposed spatially-constrained similarity measure (SCSM) which effectively incorporates spatial information for object instance retrieval and localization. However, the original SCSM cannot be directly applied in endosomal structure localization as the latter is an object category retrieval problem. Therefore, we propose a modified SCSM (mSCSM) for our category (i.e., endosomal structures) based localization.
The main contributions of the proposed method are: (i) The method can achieve fully automated detection and localization of endosomal structures without human interactions once training is done. To our best knowledge, this is the first fully-automated method for localizing endosomal structures (ii) Compared with the original SCSM, the proposed mSCSM can handle object category detection and localization. (iii) A novel output control is designed based on histogram intersection kernel to address the requirement of multiple outputs and to further improve the localization accuracy.
The paper is organized as follows. Section II reviews the original SCSM [6]. In Section III, the details of the proposed modified SCSM (mSCSM) is presented. Section IV demonstrates detection and localization results in one of the testing images and some preliminary quantitative evaluation results. Section V concludes the entire paper.
II. Spatially-constrained similarity measure
In this section, the original formulation of spatially-constrained similarity measure (SCSM) [6] is reviewed. Considering a query image Q with a set of features {f1,f2,...,fm} and a testing image D with its features {g1,g2,...,gn}, these features are assigned to the corresponding visual words by vector quantization in the BoW model. The SCSM is defined between Q and D as:
| (1) |
| (2) |
where k represents the kth visual word in the BoW model, N is the number of visual words. In the second constraint, w(fi) = w(gj) = k means features fi and gj are both assigned to the same visual word k. L(·) denotes the location of the corresponding feature, i.e., L(f) = (xf, yf) in the query image Q. T represents the similarity transformation which contains changes in rotation, scale and translation. ‖T(L(fi)) − L(gj)‖2 < ε means two matched features are spatially close given a similarity transformation T on L(fi). In (2), idf(k) is the inverse document frequency of visual word k, tfQ(k) and tfD(k) are the number of occurrences of visual word k in Q and D, respectively.
For a matched feature pair (fi, gj) and a predefined similarity transformation T, the potential location of the query object can be determined in the testing image and a similarity score defined in (2) is voted to the location. By traversing all the matched feature pairs, a voting-map with the same size as the testing image can be generated. The locations in the votingmap with big values are more probable to contain the query object. The method selects the peak value in the voting-map and incorporates the information in T for object localization.
III. The proposed method
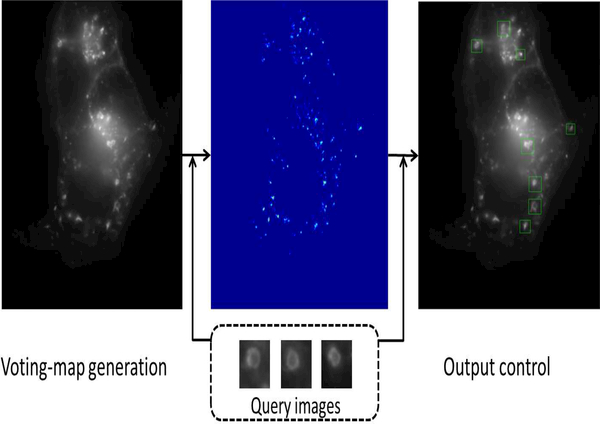
Endosomal structure localization is a category localization problem which are different from instance localization addressed by the original SCSM in two aspects (see Fig. 2): (i) multiple query images belonging to the same category are available; (ii) There might be multiple localization outputs for a testing image. Therefore, a modified SCSM (mSCSM) is proposed including three main modifications:
Fig. 2.
The general pipeline of the proposed mSCSM method.
A new definition of the similarity score is proposed through extracting discriminative information from multiple query images.
A general voting-map is obtained through accumulating all the isolated voting-maps generated by multiple query images.
An output control is designed to address the requirement of multiple localizations.
Fig. 2 illustrates the pipeline of the proposed mSCSM method. From this figure, given a set of query images (shown in the dashed rectangle) of endosomal structures and a testing image (on the left), a voting-map (on the middle) is generated by the methods to be described in Subsection III-A. Subsequently, the final localization outputs (on the right) are determined by an output control scheme to be proposed in Subsection III-B.
A. Modified similarity score and voting-map generation
To modify the original SCSM for category based localization, a new similarity score definition is proposed based on the relationship between each visual word and a set of query images of endosomal structures. In the BoW framework, each query image is represented by a histogram with respect to the visual words. If the kth visual word is discriminative to identify the endosomal structures, the distribution of this visual word should be stable for all the query images. Hence, a relatively higher similarity score should be assigned to the matched features associated with such visual word. Based on this observation, a new similarity score is defined to incorporate discriminative information from multiple query images as:
| (3) |
| (4) |
where is the N-bin histogram representation of query image Ql, M denotes the number of query images and is the average value of the kth component of the normalized histograms over all the query images. This definition of the similarity score is indeed the inverse of the standard deviation for the kth visual word over the query images. If the standard deviation is smaller, the corresponding visual word is more discriminative to identify endosomal structures.
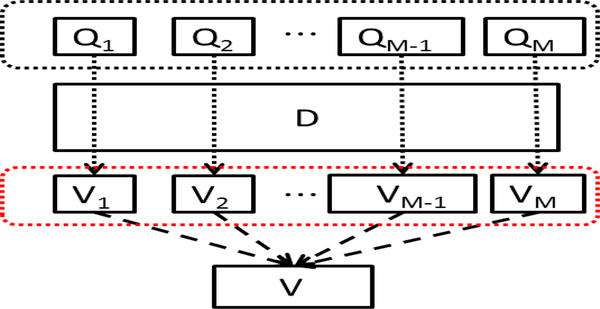
Similar to the original SCSM described in Section II, one query image will generate one voting-map by traversing all the matched features but with the similarity score defined in (2) replaced by the proposed one in (3). To combine the information from multiple query images, a general voting-map V (T) is produced by accumulating all the isolated votingmaps from different query images as shown in Fig. 3. The similarity score for the query image set is defined as:
| (5) |
where Qset denotes the query image set {Q1,Q2,...,QM}.
Fig. 3.
Voting map generation. In the black dashed rectangle, Q1, Q2,...,QM denote query images, D is a testing image. In the red dashed rectangle, V1, V2,...VM denote isolated voting-maps associated with each individual query image. A general voting-map V(T) is generated by summing all the isolated voting-maps.
One general voting-map V (T) with its values defined by S(Qset,D|T) is obtained given a fixed similarity transformation T. Therefore, a group of general voting-maps will be obtained by traversing a discrete range of T denoted as T1,T2,...,TI. Then, all these general voting-maps are pooled together by selecting the maximum values (max-pooling) to calculate a final voting-map. Meanwhile, for each location of the final voting-map, the best similarity transformation T∗ is determined in this max-pooling process as:
| (6) |
B. Output control
Given the final voting-map and the T∗ for each location, a two-stage output control scheme is designed to determine the final localization outputs of endosomal structures. In the first stage, the potential locations of endosomal structures are obtained by setting a threshold α for the normalized final voting-map (i.e., the similarity score values of the voting-map are normalized to the range [0,1]). In our method, a relatively small α between 0.1 and 0.2 is used.
The second stage is designed to confirm whether the potential output is indeed an endosomal structure. As shown in [8], histogram intersection kernel is an effective similarity measure between two images under the BoW framework. Therefore, we design such confirmation by measuring the histogram intersection kernel between each query image and the potential output patches. Specifically, given the same visual words, a query image Ql and a potential output patch Pj have their histogram representations as and , respectively. The histogram intersection kernel value between Ql and Pj is defined as:
| (7) |
Consider a set of query images {Q1,Q2,...,QM}, a histogram intersection kernel vector can be obtained and each of its entries is calculated by (7):
| (8) |
We threshold the maximum entry of KHI(Qset,Pj) to determine whether the patch Pj is significantly similar to the query images. The final decision rule is predicting Pj as an endosomal structure if:
| (9) |
where β is a threshold to be determined.
IV. Experiments
A. Data Set Description
In this paper, we use 29 microscopic images of human myeloid endothelial cells. Human myeloid endothelial cells were maintained, transfected with DNA plasmids that express green fluorescent protein-tagged neonatal Fc receptor (FcRnGFP), plated in glass-bottom dishes and imaged as described previously [2][9]. Briefly, the images were acquired using a Zeiss AxioObserver.Z1 microscope with widefield arc lamp illumination, a 63x 1.4NA Plan Apochromat oil immersion objective, a GFP-specific filterset (GFP-3035D-000, Semrock) and a monochromatic CCD camera (Orca ER, Hamamatsu).
B. Experiment Settings
In the experiments, the dense SIFT feature is calculated with patch size 12 pixels and the grid space is set as 8 pixels. The number of visual words is 400. The scale range for similarity transformation T is within [0.7,1.2] with the step size 0.05. The threshold α is set as 0.15 and β is set as 0.65. A total of 52 query images with size 45 by 45 are manually selected and cropped from 20 training images. The testing set contains 9 images which are independent from the query images.
C. Results and Analysis
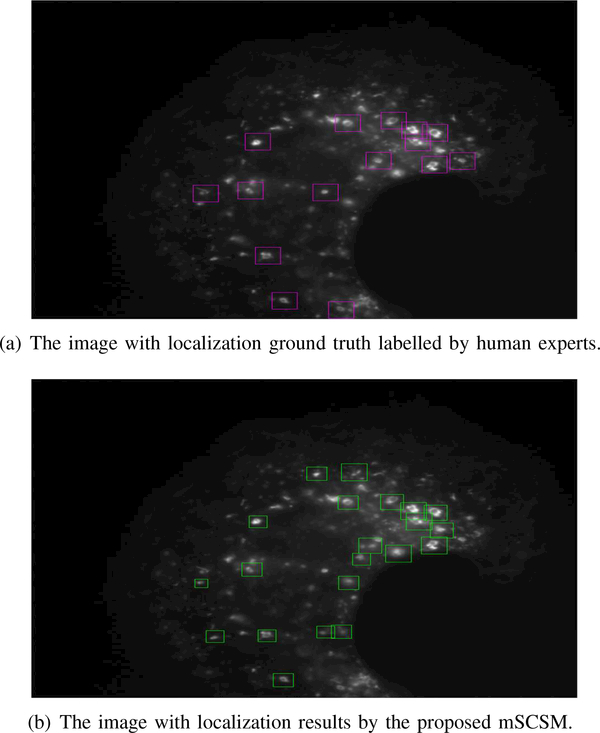
Fig. 4(a) shows the ground truth of localizations labelled by human visual inspection (denoted by pink rectangles) for one of the testing images and Fig. 4(b) shows the localization results of the proposed mSCSM (denoted by green rectangles). As seen from Fig. 4, the proposed method can detect and localize most endosomal structures which have moderate variations in illumination and shape. It is also noted that different sizes of some endosomal structures can be captured by varying the size of the localization windows (which is defined by different similarity transformation T). There are some false alarm detections caused by the patches which are similar in shape to endosome structures but have uniform pixel intensity instead of a darker inside part for true endosomal structures.
Fig. 4.
Comparisons between the groundtruth and the localization results of the proposed mSCSM in a testing image.
To our best knowledge, the proposed mSCSM is the first method which can fully-automatically detect and localize endosomal structures in microscopic images. We list some preliminary performance evaluations for 9 testing images (shown in Table I) to quantitatively demonstrate the performance of the proposed method. In Table I, FP (False Positive) is the number of localized patches shown in our results but not in the corresponding ground truth image. FN (False Negative) is the number of patches which are shown in the ground truth image but not localized by our method. TP (True Positive) is the number of patches which are shown in the ground truth image and also localized by our method. According to these three quantities, we further calculate the false alarm rate (), precision () and recall (), respectively in Table I.
Table I.
Major performance measures of the localization results
| Image Index | FP | FN | TP | FAR | Precision | Recall |
|---|---|---|---|---|---|---|
| 1 | 4 | 0 | 8 | 33.33% | 66.67% | 100.00% |
| 2 | 4 | 1 | 4 | 50.00% | 50.00% | 80.00% |
| 3 | 9 | 0 | 11 | 45.00% | 55.00% | 100.00% |
| 4 | 1 | 3 | 5 | 16.67% | 83.33% | 62.50% |
| 5 | 4 | 1 | 5 | 44.44% | 55.56% | 83.33% |
| 6 | 2 | 3 | 4 | 33.33% | 66.67% | 57.14% |
| 7 | 1 | 4 | 6 | 14.29% | 85.71% | 60.00% |
| 8 | 2 | 1 | 2 | 50.00% | 50.00% | 66.67% |
| 9 | 5 | 2 | 12 | 29.41% | 70.59% | 85.71% |
| average | 3.6 | 1.7 | 6.3 | 35.16% | 64.04% | 79.17% |
From this table, on average, the proposed method achieves 35.16% false alarm rate, 64.04% precision and 79.17% recall. Based on these evaluations, in general, the proposed method can correctly localize 79.17% of the existing endosomal structures. One of the major concerns in the future is reducing the false alarm rate (increasing the precision) by introducing more discriminative output control scheme using one-class classifiers.
V. Conclusion
In conclusion, this paper has proposed an automatic detection and localization method for endosomal structures in florescence microscopic images. The proposed mSCSM made several modifications on the original SCSM to address endosomal structure category detection and localization. The preliminary evaluation results through experiments demonstrated the effectiveness of the proposed method. One of the main future considerations of this method is how to improve the output control scheme using one-class classifiers to further reduce the false alarm rate of detection.
References
- [1].Mellman I, “Endocytosis and molecular sorting,” Annual review of cell and developmental biology, vol. 12, no. 1, pp. 575–625, 1996. [DOI] [PubMed] [Google Scholar]
- [2].Devanaboyina SC, Lynch SM, Ober RJ, Ram S, Kim D, Puig-Canto A, Breen S, Kasturirangan S, Fowler S, Peng L et al. , “The effect of ph dependence of antibody-antigen interactions on subcellular trafficking dynamics,” in MAbs, vol. 5, no. 6. Taylor & Francis, 2013, pp. 851–859. [DOI] [PMC free article] [PubMed] [Google Scholar]
- [3].Peng T, Bonamy GM, Glory-Afshar E, Rines DR, Chanda SK, and Murphy RF, “Determining the distribution of probes between different subcellular locations through automated unmixing of subcellular patterns,” Proceedings of the National Academy of Sciences, vol. 107, no. 7, pp. 2944–2949, 2010. [DOI] [PMC free article] [PubMed] [Google Scholar]
- [4].Haubold C, Schiegg M, Kreshuk A, Berg S, Koethe U, and Hamprecht FA, “Segmenting and tracking multiple dividing targets using ilastik,” in Focus on Bio-Image Informatics. Springer, 2016, pp. 199–229. [DOI] [PubMed] [Google Scholar]
- [5].Sivic J and Zisserman A, “Video google: A text retrieval approach to object matching in videos,” in Computer Vision, 2003. Proceedings. Ninth IEEE International Conference on IEEE, 2003, pp. 1470–1477. [Google Scholar]
- [6].Shen X, Lin Z, Brandt J, and Wu Y, “Spatially-constrained similarity measure for large-scale object retrieval,” IEEE transactions on pattern analysis and machine intelligence, vol. 36, no. 6, pp. 1229–1241, 2014. [DOI] [PubMed] [Google Scholar]
- [7].Zhao L, Zhao D, Fan X, and He Z, “HEVC compressed domain moving object detection and classfication,” in Circuits and Systems (ISCAS), 2016 IEEE International Symposium on. IEEE, 2016, pp. 1990–1993. [Google Scholar]
- [8].Lazebnik S, Schmid C, and Ponce J, “Beyond bags of features: Spatial pyramid matching for recognizing natural scene categories,” in 2006 IEEE Computer Society Conference on Computer Vision and Pattern Recognition (CVPR’06), vol. 2. IEEE, 2006, pp. 2169–2178. [Google Scholar]
- [9].Gan Z, Ram S, Vaccaro C, Ober RJ, and Ward ES, “Analyses of the recycling receptor, fcrn, in live cells reveal novel pathways for lysosomal delivery,” Traffic, vol. 10, no. 5, pp. 600–614, 2009. [DOI] [PMC free article] [PubMed] [Google Scholar]


