

Abstract
Background:
The association of primary brain tumors with Single Nucleotide polymorphisms (SNPs) in genes of folate metabolising enzymes have been reported to vary among different ethnic population. Here, we have studied the association of SNPs of folate metabolizing genes with the primary brain tumors (glioma and meningioma) in North Indian population.
Methods:
SNPs of genes coding for folate metabolizing enzymes was carried out in 288 study population from North India [Glioma (n=108), Meningioma (n=76) and healthy-control (n=104)]. The allele-specific polymerase chain reaction (ARMS-PCR) was used to analyse the SNP A1298C of the MTHFR (Methylenetetrahydrofolate-reductase) and the SNP A66G of the methionine synthase reductase (MTRR) genes. The PCR-RLFP (Restriction Fragment Length Polymorphism) was used to analyse the SNP C677T of the Methylene tetrahydrofolate-reductase and the SNP A2756G of the methionine-synthase (MTR) genes. Serum homocysteine, vitamin B12 and folate levels were evaluated in controls/patients serum using Chemiluminescence immunoassay and the levels were correlated with SNPs genotype.
Results:
The CC genotype of MTHFR A1298C was observed to have reduced risk of having meningioma than AA genotype (odd ratio=0.62, 95%CI 0.32-0.97, p=0.03). Similarly, the AG genotype of MTRR A66G showed reduced risk of glioma than AA genotype (odd ratio=0.56, 95%CI 0.32-0.97, p=0.039). Furthermore, in patients with AA genotype of MTR A2756G and CT genotype of MTHFR C677T showed higher serum homocysteine level than GG genotype (8.6 µmol/L, p=0.048) and CC genotype (11.2µmol/L, p=0.039) respectively.
Conclusion:
Our findings provide an insight into the risk association of SNPs in MTHFR A1298C and MTRR A66G genes with glioma/meningioma patients. Further studies are needed to evaluate their clinical implications.
Keywords: SNP, MTHFR/MTRR/MTR, glioma/meningioma, Indian population, homocysteine, folate, Vitamin B12
Introduction
Glioma accounts for 80% of malignant brain tumors and meningioma accounts for 36.4% of all primary brain tumors in adults (www.braintumor.org). The global incidence of glioma is around 4 to 5 per 1,00,000 population per year (de Robles et al., 2015, Ostrom et al., 2014) and incidence of meningioma is 1.3 to 7.8 per 1,00,000 population per year (Baldi et al., 2018). In India, the incidence of glioma is 4.2 per 1,00,000 population per year males and 2.7 per 1,00,000 population per year females (Deb et al., 2005; Thakkar et al., 2014) and the incidence of meningioma is 23.2% of all brain tumors (Jaiswal et al., 2016). Sequential accumulations of genetic aberrations have been identified as risk factor for glioma genesis (Wen and Kesari, 2008) and gene polymorphism, a type of genetic variation, is known to be a glioma risk (Friso et al., 2002; Wrensch et al., 2007; Wen and Kesari, 2008).
Single nucleotide polymorphisms (SNPs) of enzyme coding genes are critical in pathogenesis of cancers (Williams, 2001). Enzymes of Folate metabolism are integral part of one carbon metabolism and hence play an important role in DNA methylation via thymidine synthesis (Kakkoura et al., 2015) and defective DNA methylation pattern may lead to de-repression of many oncogenes resulting in tumorigenesis (Kim et al., 2014). SNPs in genes of folate metabolising enzymes like MTHFR (Methylene tetrahydrofolate reductase), MTR (Methionine Synthase) and MTRR (Methyl tetrahydrofolate Homocysteine Methyl transferase Reductase) enzymes are found to be associated with increased risk in different tumors like lymphoma, gastric cancer, prostate cancer, breast cancer, cervical cancer, colorectal (Galbiatti et al., 2012; Hosseini et al., 2011; Izmirli, 2013; Matsuo et al., 2001; Ryan et al., 2001) as well as in glioma and meningioma (Bethke et al., 2008; Kafadar et al., 2006; Kyritsis et al., 2010; Semmler et al., 2008; Sirachainan et al., 2008; Xu et al., 2013). Single nucleotide polymorphism and their disease associations varies between different population and ethnic groups (Li et al., 2013; Walsh et al., 2013; Xu et al., 2013; Yu et al., 2009). In India, there are limited reports on genes polymorphisms studies in Folate metabolising genes (MTHFR, MTR and MTRR) in primary brain tumours. Hence, this study was designed to analyse SNPs in genes of the folate metabolizing enzymes (MTHFR, MTR and MTRR) and their association with primary brain tumors (glioma and meningioma) risk in Indian cohort. The serum levels of homocysteine, vitamin B12 and folic acid were also compared with the polymorphism status of the genes coding for folate metabolising enzymes.
Materials and Methods
Sample collection
This study is a hospital based case-control cross sectional study, conducted in the Department of Biochemistry, AIIMS, New Delhi in collaboration with Department of Neurosurgery, AIIMS, New Delhi. Our study population included 184 cases (108 glioma and 76 meningioma) and 104 healthy controls (hospital staff and attendants unrelated to patients) with no history of cancer and/or no past history of brain dysfunction. Adult cases admitted to Department of neurosurgery between July 2012 to November 2014 were included in the study and controls were age and sex matched with the cases. Sample size was determined using nQuery advisor version 7. Ethical clearance has been obtained from the ethics committee of our institute. Samples were collected after taking written informed consent. Five ml fasting venous blood sample was collected from each subject. Of the five ml collected, 2ml of the whole blood was collected in EDTA vial for DNA extraction and 3ml blood was collected in the serum separator tube containing clot activator and serum separator gel for the estimation of serum biomarkers like homocysteine, vitamin B12 and folic acid.
Biomarker analysis
Serum homocysteine, serum vitamin B12 and serum folic acid were measured in patients and control serum samples. Serum homocysteine and vitamin B12 was determined by chemiluminescence using IMMULITE 1,000 solid-phase (Siemens Medical Solutions Diagnostics, Los Angeles, CA, USA) and serum folic acid was analysed by immoassay on ADVIA Centaur autoanalyser System (Siemens Medical Solutions Diagnostics, Los Angeles, CA, USA). Normal reference value, as per the kits, for serum homocysteine is 5-15 µmol/L, vitamin B12 is 174-878 pg/ml and folic Acid is 4.5-32.2 ng/ml.
SNP polymorphism analysis
Genomic DNA isolation was done using Qiagen Puregene Blood Core kit A (Qiagen; Maryland, USA) following the manufacturer’s protocol.
Single nucleotide polymorphism study of the folate metabolising genes (i) MTHFR (ii) MTR and (iii) MTRR, were analysed using PCR analysis. The MTHFR gene was analysed for two polymorphisms (a) MTHFR C677T (rs1801133), which had wildtype nucleotide ‘C’ at position 677 being replaced by nucleotide ‘T’ at exon 4 on chromosome 1 and (b) MTHFR A1298C (rs1801131), which had wildtype nucleotide ‘A’ at position 1,298 being replaced by ‘C’ at exon 7 on chromosome 1. The MTR gene was analysed for MTR SNP A2756G (rs1805087), which had wildtype nucleotide ‘A’ at position 2756 being replaced by ‘G’ at exon 26 on Chromosome 1 and the MTRR gene was studied for MTRR SNP A66G (rs1801394), which had wildtype nucleotide ‘A’ at position 66 being replaced by nucleotide ‘G’ at exon 2 on chromosome 5.
Primers were designed manually and using Primer3 software (http://frodo.wi.mit.edu/primer3), Oligo Nucleotide Properties Calculator was used to rule out any potential hairpin formation, possible primer-dimer formations and any 3’ complementarities. Basic Local Alignment Search Tool (Primer BLAST; http://blast.ncbi.nlm.nih.gov/Blast.cgi) was used to confirm primer specificity to the target gene. The primers were synthesized commercially and standardized for PCR amplification (Table S1).
SNP of MTHFR C677T and MTR A2756G genes was analysed using PCR-RFLP (Polymerase Chain Reaction-Restriction Fragment Length Polymorphism) method and SNP of MTHFR A1298C and MTRR A66G was analysed using ARMS-PCR (Amplification Refractory Mutation System Polymerase Chain Reaction) method.
PCR-RFLP (PCR-Restriction Fragment Length Polymorphism)
PCR-RFLP was used to study SNP of MTHFR C677T and MTR A2756G genes. SNP in these genes creates a specific restriction sites and PCR-RFLP method uses restriction enzymes to identify the presence of polymorphism. Primers were designed in such a way that on restriction digestion of the PCR product, two bands of unequal size would be formed for easy visualization and analysis on agarose gel. The restriction enzymes used for SNP C677T of MTHFR gene was HinFI (FastDigest, Thermo Scientific). On digestion with HinFI restriction enzyme, the PCR product of 349bp of MTHFR gene, produced two bands (208bp and 141bp) in the presence of ‘T’ allele at position 677 (Figure S1A). The restriction enzymes used for SNP A2756G of MTR gene was HaeIII (Fast Digest, Thermo Scientific), on digision using HaeIII, the PCR product of 350bp of MTR gene yielded two distinct bands of 218bp and 132bp in the presence of ‘Allele at position 2756 (Figure S1B).
ARMS-PCR (Amplification Refractory Mutation System-PCR)
ARMS-PCR was used for SNP study of MTHFR A1298C and MTRR A66G genes. ARMS-PCR allows the detection of a point mutation by using a sequence/allele specific primer that amplifies only when the target allele is present in the sample. For MTRR A66G SNP detection, a common forward primer (5’TGTGTGGGTATTGTTGCATTG3’) and allele specific two reverse primers (‘A’ allele specific reverse primer; 5’ATGTACCACAGCTTGCTCACAT 3’ and ‘G’ allele specific reverse primer; 5’ ATGTACCACAGCTTGCTCACAC3’) were used. PCR was done with a combination of common forward primer with reverse ‘A’ allele specific primer in one tube and with reverse ‘G’ allele specific primer in another tube. A PCR product of 217 bp was obtained in one or both the tubes depending on the presence of homozygous or heterozygous A /G allele respectively (Figure S2A).
For MTHFR A1298C a common reverse primer (5’TGTGAGTTGATGGTGAGG3’) and allele specific two forward primers (‘A’allele specific forward primer 5’GAGCTGACCAGTGAAGA3’ and `C’ allele specific forward primer 5’GAGCTGACCAGTGAAGC3’) were used. PCR was done with a combination of common reverse primer with forward ‘A’ allele specific primer in one tube and with forward ‘C’ allele specific primer in another tube. A PCR product of 453bp was obtained in one or both the tubes depending on the presence of homozygous or heterozygous ‘A’ and ‘C’ allele respectively (Figure S2B).
Statistical analysis
Data was analysed using IBM SPSS v 24 and MedCalc v 9.2. Chi-square test was used to analyse genotype and allele frequency and Fisher exact test was used when the frequency distribution was less than 5. Results are reported as odd ratio (confident interval, CI) and frequency (percentage, %). Normal distribution of serum biomarkers was tested using D’Agostino and Pearson omnibus normality test. Hardy -Weinberg equilibrium was calculated using online calculator by Institute of Human genetics, Munich (https://ihg.gsf.de/cgi-bin/hw/hwa1.pl). Wilcoxon signed rank test was used for comparing serum homocysteine, vitamin B12 and folic acid after age/sex matching with control, separately for glioma and meningioma and results are presented as median (IQR). Two-sample Wilcoxon rank-sum (Mann-Whitney U test) test and Kruskal-Wallis equality-of-populations rank test was applied to analyse the association between SNP genotypes and levels of serum biomarkers. The p value of < 0.05 was considered as statistically significant.
Results
Genotype and allelic frequency distribution
The mean age of control group was 37 (±12.5) years and glioma and meningioma patients were, 36 (±12.55) years and 43 (±12.5) years respectively. Blood samples collected from 184 primary brain tumor patients (108 glioma and 76 meningioma) and 104 control subjects were processed for leucocyte DNA extraction and PCR analysis of SNP’s. In this study, the frequency distribution of SNPs in genes of folate metabolising enzymes were in equilibrium with the Hardy Weinberg law and the observed frequency of SNP is consistent with the expected frequency (Table S2; Hardy Weinberg equilibrium). The distribution of genotypic and allelic frequency was analysed for the SNPs C677T and A1298C of MTHFR gene, A2756G of MTR gene and A66G of MTRR gene. The major genotype observed for MTHFR C677T was CC genotype in both control (71.2%) and patients (glioma 73.1%, meningioma 75%) followed by CT genotype (control 25%, glioma 24.1% and meningioma 19.7%) and TT genotype (control 3.8%, glioma 2.8% and meningioma 5.3%) (Table 1; SNP frequency distribution). For MTHFR A1298C SNP, AC was the major genotype in both control (50%) and patients (glioma 60.2%, meningioma 48.7%) followed by AA genotype (control 25%, glioma 22.2% and meningioma 36.8%) and CC genotype (control 25%, glioma 17.6% and meningioma 14.5%). For MTRR A66G SNP, AG was the major genotype in control (47.08%) followed by AA (44.46%) and GG (12.46%). However, in patients, AA was the major genotype (glioma 58.3%, meningioma 57.9%) followed by AG genotype (glioma 40.7% and meningioma 42.1%) and GG genotype (glioma 0.9% and no cases in menigioma) (Table 1). For MTR A2756G SNP, AA was the major genotypes in control (57.7%) and patients (glioma 50%, meningioma 55.3%) followed by AG genotype (control 37.5%, glioma 48.1% and meningioma 36.8%) and GG (control 4.8%, glioma 1.9% and meningioma 7.9%) (Table 1).
Table 1.
Genotype and Allelic Frequency of SNP’s in Genes of Folate Metabolising Enzymes
| Control (104) n(%) | Glioma (108) n (%) | Meningioma (76) n (%) | Control vs glioma Odd ratio(95%CI) p-value |
Control vs Meningioma Odd ratio(95%CI) p-value |
||
|---|---|---|---|---|---|---|
| MTHFR C677T | CC | 74 (71.2%) | 79 (73.1%) | 57 (75%) | 1 | 1 |
| CT | 26 (25%) | 26 (24.1%) | 15 (19.7%) | 0.93 (0.5-1.7) | 0.7 (0.3-1.5) | |
| 0.8 | 0.43 | |||||
| TT | 4 (3.8%) | 3 (2.8%) | 4 (5.3%) | 0.83 (0.39-1.8) | 1.1 (0.55-2.3) | |
| 0.65 | 0.72 | |||||
| C | 174(83.6%) | 184 (85.19%) | 129 (74%) | 1 | 1 | |
| T | 34 (16.35%) | 32 (14.81%) | 23 (15.13%) | 0.89 (0.52-1.5 | 0.91(0.5-1.6) | |
| 0.68 | 0.77 | |||||
| MTHFR A1298C | AA | 26 (25%) | 24 (22.2%) | 28 (36.8%) | 1 | 1 |
| AC | 52 (50%) | 65 (60.2%) | 37 (48.7%) | 1.35 (0.69-2.6) | 0.66(0.33-1.3) | |
| 0.37 | 0.23 | |||||
| CC | 26 (25%) | 19 (17.6%) | 11 (14.5%) | 0.79 (0.35-1.78) | 0.62(0.4-0.97) | |
| 0.57 | 0.03* | |||||
| A | 104 (50%) | 113 (52.3%) | 93 (52.31%) | 1 | 1 | |
| C | 104(50%) | 103 (47.69%) | 59 (47.69%) | 0.9 (0.62-0.97) | 0.63(0.4-0.97) | |
| 1 | 0.04* | |||||
| MTRR A66G | AA | 40(44.46%) | 63 (58.3%) | 44 (57.9%) | 1 | 1 |
| AG | 56(47.08%) | 44 (40.7%) | 32 (42.1%) | 0.56 (0.32-0.97) | 0.58(0.32-1.0) | |
| 0.039* | 0.07 | |||||
| GG | 8 (12.46%) | 1 (0.9%) | 0 | 0.48 (0.15-1.5) | - | |
| 0.22 | ||||||
| A | 136 (70%) | 170 (78.7%) | 120 (78.7%) | 1 | 1 | |
| G | 72 (29.81%) | 46 (21.3%) | 32 (21.3%) | 0.63 (0.41-0.99) | 0.62(0.38-1.02) | |
| 0.045* | 0.068 | |||||
| MTR A2756G | AA | 60 (57.7%) | 54 (50%) | 42 (55.3%) | 1 | 1 |
| AG | 39 (37.5%) | 52 (48.1%) | 28 (36.8%) | 1.48 (0.85-2.5) | 1.02(0.54-1.90) | |
| 0.16 | 0.93 | |||||
| GG | 5 (4.8%) | 2 (1.9%) | 6 (7.9%) | 0.66 (0.28-1.5) | 1.3(0.7-2.4) | |
| 0.34 | 0.39 | |||||
| A | 159 (76.4%) | 160 (74 %) | 112 (74%) | 1 | 1 | |
| G | 49 (23.56%) | 56 (25.93%) | 40 (25.93%) | 1.13 (0.7-1.7) | 1.15(0.71-1.8) |
Table 1) Risk association of glioma and meningioma with SNP’s of genes coding for folate metabolising enzymes was done using Chi-Square test to compare wildtype and SNP or Fisher exact test if the frequency in any of the group is less than 5. Data is presented as odd ratio (95% CI) and Frequency of Genotype and allele are represented as number (percentage).
p value <0.05 is taken as significant.. MTHFR, Methylene tetrahydrofolate reductase, MTR: methionine synthase and MTRR: Methyl tetrahydrofolate Homocysteine Methyl transferase Reductase.
Allelic frequency distribution and odd ratio was analysed for all the SNPs and presented in Table 1. In meningioma patients, we observed significant difference in distribution of genotype and allelic frequency when compared with control group in MTHFR A1298C, with risk of having meningioma was 38% less in CC genotype as compared to AA genotype (CI 0.4-0.97, p=0.03) and odds of having meningioma with C allele was 37% less compared to A allele (CI 0.4-0.97, p=0.04) (Table 1).
In glioma patients, a significant difference in distribution of genotype and allelic frequency was observed when compared with control group in MTRR A66G (CI-0.32-0.97, p=0.039) with odd of having glioma was 44% less in AG genotype as compared to AA genotype and odd of having glioma with G allele was 37% less compared to A allele (CI 0.41-0.99, p=0.045). No significant difference in distribution of genotype and allelic frequency for MTHFR C677T and MTR A2756G SNPs was observed in both glioma and meningioma patients (Table 1).
Serum biomarkers of folate metabolizing enzymes
The serum level of homocysteine, vitamin B12 and folic acid was analysed in 50 control samples and 50 patient samples (25 Glioma and 25 Meningioma). Wilcoxon signed rank test was applied after age/sex adjustment between the control and the patient (glioma and meningioma) groups and results are presented as median (IQR) (Table 2; serum biomarkers). In both the control and the patient groups, the median homocysteine level was within normal range (5-15 µmol/L), however on comparing the median serum homocysteine level of the patients with the controls, we observed lower median levels in patient group [11.75 µmol/L (8.5-17.2µmol/L)] as compared to control group [15.5 µmol/L (13.5-19.6 µmol/L)] and the difference observed was statistically significant (p=0.037). The levels of vitamin B12 and folic acid in serum of patients and control were similar and found to have no significant difference from the normal reference range (vitamin B12 is 174-878pg/ml and folic Acid is 4.5-32.2ng/ml) (Table 2). Median (IQR) value of the serum vitamin B12 in patient group was 210 pg/ml (150-394 pg/ml) and in control group was 199pg/ml (156-455pg/ml) and the median (IQR) value of the serum folic acid in in patient group was 7.6ng/ml (4.6-9.0 ng/ml) and in control group was 5.3ng/ml (3.9-8.8 ng/ml) (Table 2). However, the level of serum vitamin B12 and folic acid was comparatively higher in patients than in control group, but were statistically non-significant (Table 2).
Table 2.
Serum Levels of Homocysteine, Folic Acid and Vitamin B12 in Controls and Patients (Glioma +Meningioma)
| Biomarkers | Controls vs Patients | Control vs Glioma | Control vs Meningioma | |||
|---|---|---|---|---|---|---|
| Control (n=50) | Patients (n=50) | Control (n=25) | Glioma (n=25) | Control (n=25) | Meningioma (n=25) | |
| Homocysteine (µmol/L) | 15.5 (13.52-19.6) | 11.75 (8.5-17.2) | 19.7 (13.8-24.9) | 13.9 (8.13-18.8) | 14 (11.8-19.1) | 10.95 (8.5-16.2) |
| p=0.037* | p= 0.157 | p=0.146 | ||||
| Folic Acid (ng/ml) | 5.3 (3.9-8.8) | 7.6 (4.6-9.0) | 5.1 (3.6-7.3) | 7.7 (5.8-11.15) | 5.6 (4.3-12.9) | 6.6 (4.5-9.0) |
| p=0.75 | p=0.08 | p=0.28 | ||||
| Vitamin B12 (pg/ml) | 199 (156-455) | 210 (150-394) | 239 (182-498) | 208 (150-355) | 182 (150-449) | 212 (150-476) |
| p=0.58 | p=0.42 | p=0.84 | ||||
Serum biomarkers of folate metabolism (serum Homocysteine, serum Folic acid and serum Vitamin B12) levels were analysed between control with patients (glioma+ meningioma), control with glioma patients and control with meningioma patients. Age and sex matched controls were used for the comparison and Wilcoxon signed-rank was test applied. Data are presented as median (interquartile range of 25 % to 75%) along with their corresponding p values.
p value <0.05 is taken as significant.
Comparison of serum Homocysteine levels in SNP genotypes
Since we observed lower level of serum homocysteine level in patients group, we further analysed the serum homocysteine level in different SNP genotypes of folate metabolising enzymes. The control and the patients were further grouped on the basis of their genotypes in folate metabolising enzymes (MTHFR C677T and A1298C), MTRR A66G and MTR A2756G) and then the serum homocysteine levels in different genotype groups was compared (Table 3; Comparison of serum Homocysteine level in SNPs genotypes).
Table 3.
Comparison of Serum Levels of Homocysteine between Wild Type and Different SNP Genotype/Allele of Folate Metabolising Enzyme.
| Homocysteine (µmol/L) | Control (n=50) | Patients (glioma+ meningioma) (n=50) | Glioma (n=25) | Meningioma (n=25) |
|---|---|---|---|---|
| MTHFR C677C | 14.5(12.2-20.4) n=42 | 11.2 (8.4-15.3) n=37 | 13.9 (7.9-15.3) n=15 | 10.5 (8.5-13.4) n=22 |
| MTHFR C677T | 19.9 (19.3-29.2) n=7, p=0.076 | 16.3 (10.8-37.5) * n=10, p=0.039 | 17.3 (11.4-43.6) n=7, p=0.129 | 15.3 (10.2-18.9) n=3, p=0.316 |
| MTHFR T677T | 14.7 n=1, p=0.968 | 9.77 (6.2- 24) n=3, p=0.817 | 9.8 (10.2-18.9) n=3, p=0.768 | n=0 |
| MTHFR A1298A | 14.7 (12.6-19.8) n=10 | 10.12(7.5-13.8) n=15 | 13.5 (10.0-20.8) n=7 | 8.66 (6.9-10.7) n=8 |
| MTHFR A1298C | 15.5 (12.6-23.9) n=22, p=0.792 | 15.2 (10.2-17.3) n=31, p=0.131 | 15.3 (9.5-19.5) n=15, p=0.549 | 12.6 (10.3-17.2) n=16, p=0.076 |
| MTHFR C1298C | 15.4 (9.2-20.5) n=18, p=0.848 | 8.37 (7.4-9.3) n=4, p=0.271 | 8.17 (7.0-9.7) n=3, p=0.13 | 8.5 n=1, p=0.699 |
| MTRR A66A | 14.35 (9.6-20.5) n=27 | 11 (8.5-15.8) n=42 | 13.5 (8.1-19.0) n=19 | 10.9 (8.5-15.3) n=23 |
| MTRR A66G | 15.6 (13.7-20.8) n=23, p=0.3 | 16.1 (12.0-17.2) n=8, p=0.19 | 16.1 (13.8-17.3) n=6, p=0.426 | 13.7 (10.2-17.2) n=2, p=0.548 |
| MTRR G66G | n=0 | n=0 | n=0 | n=0 |
| MTR A2756A | 15.7 (12.6-27.5) n=28 | 13 (9.4-18.4) n=24 | 15.2 (9.8-21.5) n=11 | 12.6 (9.0—17.5) n=13 |
| MTR A2756G | 11.2 (12.4-20) n=20, p=0.385 | 13.6 (7.9-16.2) n=20, p=0.49 | 13.8 (7.8-17.3) n=14, p=0.584 | 11.1 (8.2-15.3) n=6, p=0.335 |
| MTR G2756G | 11.2 (7.7-14.7) n=2, p=0.197 | 8.6 (8.1-11.1) # n=6, p=0.031 | n=0 | 8.6 (8.1-11.1) # n=6, p=0.048 |
Serum homocysteine levels in wildtype genotype of control and patients population is compared with polymorphisms genotype (heterozygous and homozygous SNP) separately for each of the four genes of folate metabolising enzyme studied. Two-sample Mann-Whitney U test was used for the comparison and data Serum Homocysteine levels are presented as median and IQR. p value < 0.05 is considered significant and denoted by * for comparison between wildtype genotype and heterozygous SNP genotype and # for comparison between wildtype genotype and homozygous SNP genotype. SNP, Single Nucleotide polymorphisms; MTHFR, Methylene tetrahydrofolate reductase; MTR, methionine synthase; MTRR, Methyl tetrahydrofolate Homocysteine Methyl transferase Reductase.
The polymorphism (both homozygous and heterozygous) genotypes of MTHFR C677T, MTHFR A1298C and MTRR A66G in control group had higher homocysteine level then the wild-type genotypes (Table 3) and in MTR A2756G, wild type genotype had the higher homocysteine level (15.7 µmol/L) than the polymorphism genotypes (11.2 µmol/L) (Table 3). In patient group, the serum homocysteine level was observed to be higher in polymorphism genotypes of all SNPs analysed as compared to their corresponding wild-type genotype (Table 3). Statistically significant difference in serum homocysteine levels was observed between CC vs CT genotype of MTHFR C677T in patient population (p=0.039) with serum homocysteine levels higher in CT genotype (19.9µmol/L) and between AA vs GG genotype of MTR A2756G in meningioma subgroup, AA genotype had higher homocysteine levels (12.6 µmol/L) compared to GG genotype (8.6 µmol/L) with p value=0.048 (Table 3).
Comparison of serum folic acid and vitamin B12 levels in SNP genotypes
Similar to the analysis done with serum homocysteine, the control and the patient groups were sub-grouped on the basis of their genotypes of MTHFR (C677T and A1298C), MTRR A66G and MTR A2756G and serum folic acid and vitamin B12 levels were compared between the genotypes. We did not observe significant difference with either folic acid or vitamin B12 levels, between different genotypes of SNPs studied in both control as well as in patient groups. Details presented in Table S3 and Table S4.
Further, multiple logistic regression was applied to analyze and see the combined effect of all the studied SNPs on the risk association for glioma and meningioma. But, no significant cumulative risk association was observed for combined SNPs. Details are given in Table S6.
Discussion
There is a major challenge in the therapeutic management of glioblastoma multiforme (GBM) due to complex and heterogeneous biological characteristics of the tumor (Kesari,2011; Muzumdar, 2009; Thakkar et al., 2014; Wen and Kesari, 2008). The standard treatment protocol at present for GBM is surgical resection of the tumor followed by chemotherapy and radiotherapy (Villà et al., 2014) but the prognostic outcome of the patient with present treatment is limited with poor overall survival (Deb et al., 2005; Hanif et al., 2017; Thakkar et al., 2014). Early diagnosis and treatment carry relatively better prognosis (Kelly, 2010) and many researchers are involved in identifying molecular risk factors that may enable in early diagnosis and intervention (Carlsson et al., 2014). SNP association with chronic diseases including cancer have been well known and have helped in identifying people’s susceptibility to the associated disease (Burton et al., 2007; Izmirli, 2013). SNPs in genes of folate metabolizing enzymes are linked to cancers of various tissue origin like endometrial, cervical, prostate, lung, colon, gastric, breast, head and neck (Boccia et al., 2008; Ericson et al., 2009; Galbiatti et al., 2012; Henao et al., 2005; Izmirli, 2013; Matsuo et al., 2001; Ryan et al., 2001; Xu et al., 2013). SNPs in folate metabolizing enzymes are associated with impaired DNA repair and aberrant patterns of DNA methylation, which are responsible for carcinogenesis (Duthie, 2011; Kim, 1999; Kim et al., 2014; Liu et al., 2013). The SNPs in genes of folate metabolising enzymes like Methylene tetrahydrofolate reductase (MTHFR), 5-Methyltetrahydrofolate-Homocysteine Methyltransferase Reductase (MTRR) and methionine synthase (MTR) are studied for their increased susceptibility for development of meningioma and glioma (Bethke et al., 2008). However genetic variation in different ethnic population have shown to have different disease susceptibility outcome in primary brain tumours (Shah et al., 2017). Having knowledge of SNP variation in a population of interest and their risk association with primary brain tumour are important for early diagnosis and risk assessments for better clinical outcome. Since there are limited reports on study of SNPs of folate metabolizing genes in Indian brain tumor patients, here, we have analysed SNPs in genes of folate metabolising enzymes MTHFR (C677T and A1298C), MTRRA66G and MTRA2756G and their association with glioma and meningioma in Indian population. We further analysed the association of these SNPs with serum level of homocysteine, vitamin B12 and folate.
The folate metabolising enzyme in this study and the pathways in which they are associated is described in figure 1. Of all the SNPs in genes of folate metabolizing enzymes, MTHFR C677T is reported to be the most common, due to its thermolabile characteristics (Shields et al., 1999). The heterozygous and homozygous MTHFR C677T (CT/TT) SNPs lead to substitution of alanine for valine in MTHFR enzyme, leading to decreased enzyme activity (Leclerc et al., 2013; Ryan et al., 2001) causing defective metabolism of homocysteine resulting in hyperhomocystinemia (Ueland et al., 2001). We observed in our study on MTHFR C677T polymorphism, CC wild genotype was the predominant genotype in both control and patient groups followed by CT genotype and TT genotype of MTHFR C677T polymorphism. The distribution of genotypes observed in our study correlates with the distribution documented earlier in Indian control population groups (Kohli et al., 2008; Kumar et al., 2005; Rai et al., 2012; Saraswathy et al., 2012; Singh et al., 2014). The CC genotype is also the predominant genotype across other ethnicity (Table S5) except in Japanese and Chinese population (Lwin et al., 2002; Suzuki et al., 2008; Yang et al., 2013; Yoshimura et al., 2003) where CT genotype is predominant. We did not observe any risk association of MTHFR C677T SNP in both glioma and meningioma population in our study. Similarly, there was no risk association observed in Turkish (Kafadar et al., 2006), European descent (Semmler et al., 2008) and Asian population (Xu et al., 2013) for glioma with MTHFR C677T SNP. In addition, no increased risk association for meningioma was observed in our study, similar to Turkish (Kafadar et al., 2006) population. However, an increased risk for meningioma was observed with CT genotype of MTHFR C677T in European (Bethke et al., 2008; Liew and Gupta, 2015; Zhang et al., 2013), Chinese Han (Yan et al., 2014), European descent (Ding et al., 2014) and Asian (Xu et al., 2013) population.
Figure 1.
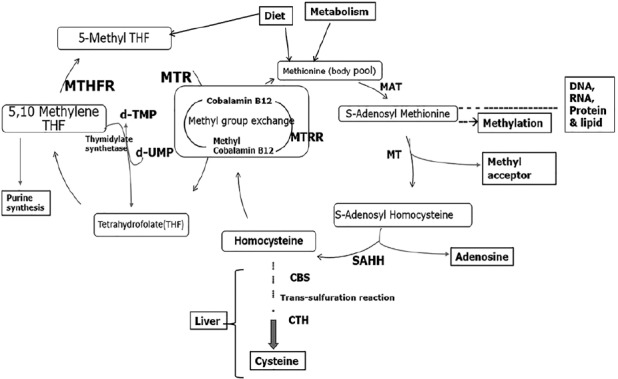
Overview of Folate and Homocysteine metabolism in human. Schematic description of one-carbon metabolism pathways of folate cycle showing Folate and Homocysteine metabolism. MTHFR (Methylene tetrahydrofolate reductase), MTR (methionine synthase), MTRR (Methyl tetrahydrofolate Homocysteine Methyl Transferase Reductase) enzymes, MAT (Methionine Adenosyl Transferase), MT (methyltransferase), SAHH (S-adenosylhomocysteine hydrolase), CBS (Cystathionine beta-synthase) and CTH (cystathionine γ-lyase enzyme).
MTHFR A1298C mutant genotype leads to substitution of glutamic acid for alanine leading to reduced MTHFR enzyme activity (Weisberg et al., 1998). We observed AC genotype of MTHFR A1298C to be the most common (50%) genotype in our study population, followed by AA and CC genotypes (25% each). Similar distribution of MTHFR A1298C genotype with predominantly AC genotype was reported in middle-eastern population (Hosseini et al., 2011) however the distribution of MTHFR A1298C genotype is heterogenous in different Indian ethnic subpopulation as documented in an earlier study by Saraswanthy et al., (2012). In other ethnic groups, AA was the major genotype (TableS5). On analysing the association of MTHFR A1298C SNP with primary brain tumors, we did not find increased risk association in glioma patients unlike Northern Chinese Han population (Liu et al., 2013) and European population (Bethke et al., 2008) which showed increased risk association for glioma with AC genotype of MTHFR A1298C. However, in meningioma patients, we observed homozygous CC genotype and ‘C’ allele to be associated with significantly decreased risk for meningioma. A study in White European ethnicity showed heterozygous MTHFR A1298C genotype to have increased risk association for meningioma (Bethke et al., 2008).
MTRR A66G mutant genotype leads to substitution of isoleucine to methionine at 22nd amino acid leading to decreased enzyme activity and increased homocysteine level (Olteanu et al., 2002). The AG genotype was observed to be the predominant genotype (47%) in our study population and which is similar to the earlier reported documents in Indian population (Rai et al., 2011) but the distribution of AA genotype was (44%) in our population group (North Indian) which is different from the report documented earlier in South Indian population (1.7%) by Rai et al (2011). The predominant genotype found in Japanese (Suzuki et al., 2008), Chinese (Yang et al., 2013) and African (Shi et al., 2003) population for MTRR A66G polymorphism is AA genotype (Table S5). We observed a decreased risk association for glioma with AG genotype of MTRR enzyme in our study population but no such association for glioma risk with AG genotype was observed in Chinese Han (Zeng et al., 2014; Zhang et al., 2013), British or European (Bethke et al., 2008) population. We did not observe any risk association for meningioma with MTRR A66G SNP in our study population but the Chinese Han population (Zhang et al., 2013) showed AG genotype of MTRR A66G as a risk factor for adult meningioma and a study in British population (Bethke et al., 2008) and meta-analysis in European population (Zeng et al 2014) showed homozygous polymorphism of MTRR GG genotype to be associated with increased risk for meningioma.
The mutant genotype of MTR A2756G SNP also causes impaired enzyme activity. MTR A2756G polymorphism along with MTHFR C677T polymorphism has been reported to increase the serum homocysteine level (Barbosa et al., 2008). On analysis of MTR A2765G polymorphism in our study population, wildtype AA (57.7%) was observed to be the predominant genotype, similar to the genotype distribution documented in Indian population (Rai et al., 2011) as well as other ethnic groups worldwide (TableS5). We observed no significant association of increased risk for development of glioma or meningioma with MTR A2756G SNP. Other meta-analysis studies on European descent and Asian population also reported of no risk association with MTR A2756G for either with glioma or meningioma (Zeng et al., 2014).
Over all, on analyzing the SNPs of folate metabolising enzymes, we observed AG genotype of MTRR A66G to have low risk for glioma and CC genotype of MTHFR A1298C to have low risk for meningioma in our study population from North India. The possible explanation for the low risk of meningioma in MTHFR CC genotype could be due to reduced MTHFR enzyme activity leading to increased accumulation of 5,10-methylene-THF (Bagley and Selhub, 1998). The 5,10-methylene-THF is the major methyl donor for thymidine synthesis from uracil, thus adequate 5,10-methylene-THF prevents misincorporation of uracil base in place of thymidine during DNA synthesis and reduce DNA breakage (Blount et al., 1997; Matsuo et al., 2001; Sohn et al., 2009). The protective polymorphism is also noted by Henao et al. (2005) in their study on cervical cancer to have lower risk of development of carcinoma-in-situ with CT/TT genotype of MTHFR C677T and AG/GG genotype of methionine synthase MTR A2756G (Henao et al., 2005). Ma et al., (1997) in their epidemiological study have also observed reduced colon cancer risk with MTHFR C677T TT genotype. Similarly, in our study population also, we have observed decreased risk for primary brain tumours with SNPs involving MTHFR A1298C and MTRR A66G.
Folate and vitamin B12 play an essential role in one carbon transfer metabolism and are involved in re-methylation of homocysteine to methionine, which is essential for S-adenosyl methionine (SAM) synthesis. SAM is a primary methyl group donor for most biological methylation processes. The reduced efficiency of enzymes involved in folate metabolism due to polymorphism or mutations can lead to lesser conversion of homocysteine to methionine and in turn less availability of SAM and defective methylation of DNA (Figure 1). Defective methylation or hypomethylation of CpG island in promoters regions of oncogene can promotes carcinogenesis (Kim, 2004). Folate depletion or inefficient enzyme activity of folate metabolising enzymes will also predispose to the initiation of neoplastic process (Kim, 1999; Kim et al., 1997). On the contrary it is also observed that folate supplementation might potentiate the progression of already established early neoplastic clones (Kim, 2006) possibly by increasing the availability of THF and diverting it to purine synthesis necessary for cell division and proliferation (Kim, 2006) which may be further enhanced with MTHFR polymorphism by increasing the availability of 5,10-mehtylene tetrahydrofolate for purine biosynthesis.
A serum level of homocysteine is reflective of robustness in folate cycle which is influenced by dietary folic acid and vitamin B12 (Bathum et al., 2007; Selhub, 1999). In our study, the vitamin B12 and folic acid levels were similar in patients and control, the variations observed in serum homocysteine level might be due to SNPs in genes of folate metabolising enzymes, hence we correlated the serum homocysteine levels in different genotypes of folate metabolising enzymes (MTHFR C677T, MTHFR A1298C, MTRR A66G and MTR A2756G) in both patient and control groups. On analysing the serum homocysteine levels in wild type and mutant genotypes, we observed higher serum homocysteine levels in CT genotype in comparison to homozygous CC genotype in MTHFR C677T polymorphism in patients groups. Our observation is consistent with several genome-wide association studies (Burton et al., 2007; Hazra et al., 2009; Klerk et al., 2002; Lange et al., 2010; Tanaka et al., 2009) where they have shown MTHFR enzyme having T allele at 677 position to have higher homocysteine levels. Bathum (2007) reported SNP of MTHFR C677T accounting for 24%–53% higher homocysteine level due to this genetic variance. Hanson et al., (2001) have also reported significant increase in serum homocysteine level in mutant TT genotype of MTHFR C677T (Hanson et al., 2001). Ueland et al (2001) have reported TT genotype of MTHFR C677T to have higher serum homocysteine levels and lower DNA methylation pattern which reduces activity of MTHFR enzyme. We observed of low serum homocysteine levels with GG genotype of MTR A2756G in our patient population, which needs further studies to analysis effect of homozygous GG SNP on MTR enzyme activity in reducing homocysteine levels. Analysis of serum homocysteine levels in MTHFR A1298C and MTRR A66G polymorphism did not show any difference in our study population. Similar reports of no significant difference in homocysteine levels with heterozygous/homozygous SNP genotypes of MTHFR A1298C in healthy population is observed by Hanson et al., (2001). However, Gaughan et al., (2001) in their study have reported AA genotype of MTRR A66G to have higher homocysteine level as compared to AG genotype in healthy individuals.
We observed higher level of serum homocysteine in our control study population (13.5-19.6µmol/L) similar to pervious reported in normal healthy Indian population (17-25 µmol/L) (Gupta et al., 2012; Kamdi and Palkar, 2013; Muftuoglu et al., 2013; Yetley and Johnson, 2011). The possible explanation for observation of high homocysteine level in healthy population may be due to the predominant presence of AC genotype in MTHFR A1298C and AG genotype in MTRRA66G in Indian population as these SNPs are known to increase homocysteine level (Olteanu et al., 2002; Weisberg et al., 1998). Homocysteine levels in patient groups showed lower values than control population (Table 2). The observed lower homocysteine levels in patient group may be influenced by deficiency of vitamin B6 or other SNP of Cystathionine beta-synthase (CBS) or cystathionine γ-lyase enzyme (Selhub, 1999), which needs further studies.
Overall in our study, we observed a different genotypic distribution of SNPs in genes of folate metabolising enzymes in Indian population compared to other ethnic groups (Table S5). We observed in MTHFR A1298C CC genotype/C allele and in MTRR A66G AG genotype/G-allele showing protective association with meningioma and glioma respectively, which warrants further study to confirm its clinical implication. On analysing the serum level of homocysteine in different SNP genotypes of folate metabolising enzymes, we observed significantly higher serum homocysteine level in CT genotype of MTHFR C677T and AG genotype of MTR A2756G in patient population group (Table 3). However, the presence of SNPs showed increased serum homocysteine levels in control groups and lower homocysteine level in patients groups (glioma and meningioma) compared to control group, the reason for low homocysteine levels in patients need to be studied future.
Acknowledgements
This work was funded by an intramural grant from All India Institute of Medical Sciences (AIIMS), New Delhi, India to KC. We thank All India Institute of Medical Sciences (AIIMS), India for permitting to conduct our study. We appreciate and acknowledge all the patients and control subjects for their participation in our study. We acknowledge Ms. Jyoti, Mr. Manoj Sharma, Mr. Pappu and Mr. Mukesh for their assistance in routine lab work.
References
- 1.Al Farra HY. Methionine synthase polymorphisms (MTR 2756 A>G and MTR 2758 C>G) frequencies and distribution in the Jordanian population and their correlation with neural tube defects in the population of the northern part of Jordan. Indian J Hum Genet. 2010;16:138–43. doi: 10.4103/0971-6866.73405. [DOI] [PMC free article] [PubMed] [Google Scholar]
- 2.Bagley PJ, Selhub J. A common mutation in the methylenetetrahydrofolate reductase gene is associated with an accumulation of formylated tetrahydrofolates in red blood cells. Proc Natl Acad Sci U S A. 1998;95:13217–20. doi: 10.1073/pnas.95.22.13217. [DOI] [PMC free article] [PubMed] [Google Scholar]
- 3.Baldi I, Engelhardt J, Bonnet C, et al. Epidemiology of meningiomas. Neurochirurgie. 2018;64:5–14. doi: 10.1016/j.neuchi.2014.05.006. [DOI] [PubMed] [Google Scholar]
- 4.Barbosa PR, Stabler SP, Machado ALK, et al. Association between decreased vitamin levels and MTHFR, MTR and MTRR gene polymorphisms as determinants for elevated total homocysteine concentrations in pregnant women. Eur J ClinNutr. 2008;62:1010–21. doi: 10.1038/sj.ejcn.1602810. [DOI] [PubMed] [Google Scholar]
- 5.Bathum L, Petersen I, Christiansen L, et al. Genetic and environmental influences on plasma homocysteine, results from a Danish twin study. Clin Chem. 2007;53:971–9. doi: 10.1373/clinchem.2006.082149. [DOI] [PubMed] [Google Scholar]
- 6.Bethke L, Webb E, Murray A, et al. Functional polymorphisms in folate metabolism genes influence the risk of meningioma and glioma. Cancer Epidemiol Biomarkers Prev. 2008;17:1195–1202. doi: 10.1158/1055-9965.EPI-07-2733. [DOI] [PubMed] [Google Scholar]
- 7.Blount BC, Mack MM, Wehr CM, et al. Folate deficiency causes uracil misincorporation into human DNA and chromosome breakage, Implications for cancer and-neuronal-damage. Proc Natl Acad Sci U S A. 1997;94:3290–5. doi: 10.1073/pnas.94.7.3290. [DOI] [PMC free article] [PubMed] [Google Scholar]
- 8.Boccia S, Hung R, Ricciardi G, et al. Meta- and pooled analyses of the methylenetetrahydrofolate reductase C677T and A1298C polymorphisms and gastric cancer risk, a huge-GSEC review. Am J Epidemiol. 2008;167:505–16. doi: 10.1093/aje/kwm344. [DOI] [PubMed] [Google Scholar]
- 9.Botto LD, Yang Q. 5,10-Methylenetetrahydrofolate reductase gene variants and congenital anomalies, a HuGE review. Am J Epidemiol. 2000;151:862–77. doi: 10.1093/oxfordjournals.aje.a010290. [DOI] [PubMed] [Google Scholar]
- 10.Burton PR, Clayton DG, Cardon LR, et al. Genome-wide association study of 14,000 cases of seven common diseases and 3,000 shared controls. Nature. 2007;447:661–78. doi: 10.1038/nature05911. [DOI] [PMC free article] [PubMed] [Google Scholar]
- 11.Carlsson SK, Brothers SP, Wahlestedt C. Emerging treatment strategies for glioblastoma multiforme. EMBO Mol Med. 2014;6:1359–70. doi: 10.15252/emmm.201302627. [DOI] [PMC free article] [PubMed] [Google Scholar]
- 12.de Robles P, Fiest KM, Frolkis AD, et al. The worldwide incidence and prevalence of primary brain tumors, a systematic review and meta-analysis. Neuro Oncol. 2015;17:776–83. doi: 10.1093/neuonc/nou283. [DOI] [PMC free article] [PubMed] [Google Scholar]
- 13.Deb P, Sharma MC, Mahapatra AK, Agarwal D, Sarkar C. Glioblastoma multiforme with long term survival. Neurol India. 2005;53:329. [PubMed] [Google Scholar]
- 14.Ding H, Liu W, Yu X, et al. Risk association of meningiomas with MTHFR C677T and GSTs polymorphisms, a meta-analysis. Int J Clin Exp Med. 2014;7:3904–14. [PMC free article] [PubMed] [Google Scholar]
- 15.Duthie SJ. Folate and cancer, how DNA damage, repair and methylation impact on colon carcinogenesis. J Inherit Metab Dis. 2011;34:101–9. doi: 10.1007/s10545-010-9128-0. [DOI] [PubMed] [Google Scholar]
- 16.Ericson UC, Ivarsson MIL, Sonestedt E, et al. Increased breast cancer risk at high plasma folate concentrations among women with the MTHFR 677T allele. Am J Clin Nutr. 2009;90:1380–9. doi: 10.3945/ajcn.2009.28064. [DOI] [PubMed] [Google Scholar]
- 17.Fredriksen A, Meyer K, Ueland PM, et al. Large-scale population-based metabolic phenotyping of thirteen genetic polymorphisms related to one-carbon metabolism. Hum Mutat. 2007;28:856–65. doi: 10.1002/humu.20522. [DOI] [PubMed] [Google Scholar]
- 18.Friso S, Choi SW, Girelli D, et al. A common mutation in the 5,10-methylenetetrahydrofolate reductase gene affects genomic DNA methylation through an interaction with folate status. Proc Natl Acad Sci U S A. 2002;99:5606–11. doi: 10.1073/pnas.062066299. [DOI] [PMC free article] [PubMed] [Google Scholar]
- 19.Galbiatti ALS, Ruiz MT, Maniglia JV, et al. Head and neck cancer, genetic polymorphisms and folate metabolism. Braz J Otorhinolaryngol. 2012;78:132–9. doi: 10.1590/S1808-86942012000100021. [DOI] [PMC free article] [PubMed] [Google Scholar]
- 20.Gaughan DJ, Kluijtmans LA, Barbaux S, et al. The methionine synthase reductase (MTRR) A66G polymorphism is a novel genetic determinant of plasma homocysteine concentrations. Atherosclerosis. 2001;157:451–6. doi: 10.1016/s0021-9150(00)00739-5. [DOI] [PubMed] [Google Scholar]
- 21.Gupta SK, Kotwal J, Kotwal A, Dhall A, Garg S. Role of homocysteine and MTHFR C677T gene polymorphism as risk factors for coronary artery disease in young Indians. Indian J Med Res. 2012;135:506–12. [PMC free article] [PubMed] [Google Scholar]
- 22.Hanif F, Muzaffar K, Perveen K, Malhi SM, Simjee SU. Glioblastoma multiforme, a review of its epidemiology and pathogenesis through clinical presentation and treatment. Asian Pac J Cancer Prev. 2017;18:3–9. doi: 10.22034/APJCP.2017.18.1.3. [DOI] [PMC free article] [PubMed] [Google Scholar]
- 23.Hanson NQ, Aras Ö, Yang F, Tsai MY. C677T and A1298C polymorphisms of the methylenetetrahydrofolate reductase gene, incidence and effect of combined genotypes on plasma fasting and post-methionine load homocysteine in vascular disease. Clin Chem. 2001;47:661–6. [PubMed] [Google Scholar]
- 24.Hazra A, Kraft P, Lazarus R, et al. Genome-wide significant predictors of metabolites in the one-carbon metabolism pathway. Hum Mol Genet. 2009;18:4677–87. doi: 10.1093/hmg/ddp428. [DOI] [PMC free article] [PubMed] [Google Scholar]
- 25.Henao OL, Piyathilake CJ, Waterbor JW, et al. Women with polymorphisms of methylenetetrahydrofolate reductase (MTHFR) and methionine synthase (MS) are less likely to have cervical intraepithelial neoplasia (CIN) 2 or 3. Int J Cancer. 2005;113:991–7. doi: 10.1002/ijc.20695. [DOI] [PubMed] [Google Scholar]
- 26.Hosseini M, Houshmand M, Ebrahimi A. MTHFR polymorphisms and breast cancer risk. Arch Med Sci. 2011;7:134–7. doi: 10.5114/aoms.2011.20618. [DOI] [PMC free article] [PubMed] [Google Scholar]
- 27.Izmirli M. A literature review of MTHFR (C677T and A1298C polymorphisms) and cancer risk. Mol Biol Rep. 2013;40:625–37. doi: 10.1007/s11033-012-2101-2. [DOI] [PubMed] [Google Scholar]
- 28.Jaiswal J, Shastry AH, Ramesh A, et al. Spectrum of primary intracranial tumors at a tertiary care neurological institute, A hospital-based brain tumor registry. Neurol India. 2016;64:494. doi: 10.4103/0028-3886.181535. [DOI] [PubMed] [Google Scholar]
- 29.Janošíková B, Zavadáková P, Kožich V. Single-nucleotide polymorphisms in genes relating to homocysteine metabolism, how applicable are public SNP databases to a typical European population? Eur J Hum Genet. 2004;13:86–95. doi: 10.1038/sj.ejhg.5201282. [DOI] [PubMed] [Google Scholar]
- 30.Kafadar AM, Yilmaz H, Kafadar D, et al. C677T Gene Polymorphism of Methylenetetrahydrofolate Reductase (MTHFR) in Meningiomas and High-grade Gliomas. Anticancer Res. 2006;26:2445–9. [PubMed] [Google Scholar]
- 31.Kakkoura MG, Demetriou CA, Loizidou MA, et al. Single-nucleotide polymorphisms in one-carbon metabolism genes, Mediterranean diet and breast cancer risk, a case–control study in the Greek-Cypriot female population. Genes Nutr. 2015;10:453. doi: 10.1007/s12263-015-0453-7. [DOI] [PMC free article] [PubMed] [Google Scholar]
- 32.Kamdi SP, Palkar P. Prevalence of hyperhomocysteinemia in healthy Indian doctors. Bioinformation. 2013;9:193–6. doi: 10.6026/97320630009193. [DOI] [PMC free article] [PubMed] [Google Scholar]
- 33.Kelly PJ. Gliomas, survival, origin and early detection. Surg Neurol Int. 2010;1:96. doi: 10.4103/2152-7806.74243. [DOI] [PMC free article] [PubMed] [Google Scholar]
- 34.Kesari S. Understanding glioblastoma tumor biology, the potential to improve current diagnosis and treatments. Semin Oncol. 2011;38:2–10. doi: 10.1053/j.seminoncol.2011.09.005. [DOI] [PubMed] [Google Scholar]
- 35.Kim KR, Kim E, Son EI. Aberrant CpG islands hypermethylation profiles in malignant gliomas. Brain Tumor Res Treat. 2014;2:29–35. doi: 10.14791/btrt.2014.2.1.29. [DOI] [PMC free article] [PubMed] [Google Scholar]
- 36.Kim YI, Pogribny IP, Basnakian AG, et al. Folate deficiency in rats induces DNA strand breaks and hypomethylation within the p53 tumor suppressor gene. Am J Clin Nutr. 1997;65:46–52. doi: 10.1093/ajcn/65.1.46. [DOI] [PubMed] [Google Scholar]
- 37.Kim YI. Folate and carcinogenesis, evidence, mechanisms, and implications. J Nutr Biochem. 1999;10:66–88. doi: 10.1016/s0955-2863(98)00074-6. [DOI] [PubMed] [Google Scholar]
- 38.Kim YI. Folate and DNA methylation, a mechanistic link between folate deficiency and colorectal cancer? Cancer Epidemiol Biomark Prev Publ Am Assoc Cancer Res Cosponsored Am Soc Prev Oncol. 2004;13:511–9. [PubMed] [Google Scholar]
- 39.Kim YI. Folate, a magic bullet or a double edged sword for colorectal cancer prevention? Gut. 2006;55:1387–9. doi: 10.1136/gut.2006.095463. [DOI] [PMC free article] [PubMed] [Google Scholar]
- 40.Klerk M, Verhoef P, Clarke R, et al. MTHFR 677C-->T polymorphism and risk of coronary heart disease, a meta-analysis. JAMA. 2002;288:2023–31. doi: 10.1001/jama.288.16.2023. [DOI] [PubMed] [Google Scholar]
- 41.Kohli U, Arora S, Kabra M, et al. Prevalence of MTHFR C677T polymorphism in north Indian mothers having babies with Trisomy 21 Down syndrome. Syndr Res Pract. 2008;12:133–7. doi: 10.3104/reports.2004. [DOI] [PubMed] [Google Scholar]
- 42.Kumar J, Das SK, Sharma P, et al. Homocysteine levels are associated with MTHFR A1298C polymorphism in Indian population. J Hum Genet. 2005;50:655–63. doi: 10.1007/s10038-005-0313-1. [DOI] [PubMed] [Google Scholar]
- 43.Kyritsis AP, Bondy ML, Rao JS, Sioka C. Inherited predisposition to glioma. Neuro Oncol. 2010;12:104–13. doi: 10.1093/neuonc/nop011. [DOI] [PMC free article] [PubMed] [Google Scholar]
- 44.Lajin B, Alachkar A, Sakur AA. Triplex tetra-primer ARMS-PCR method for the simultaneous detection of MTHFR c.677C>T and c.1298A>C, and MTRR c.66A>G polymorphisms of the folate-homocysteine metabolic pathway. Mol Cell Probes. 2012;26:16–20. doi: 10.1016/j.mcp.2011.10.005. [DOI] [PubMed] [Google Scholar]
- 45.Lange LA, Croteau-Chonka DC, Marvelle AF, et al. Genome-wide association study of homocysteine levels in Filipinos provides evidence for CPS1 in women and a stronger MTHFR effect in young adults. Hum Mol Genet. 2010;19:2050–8. doi: 10.1093/hmg/ddq062. [DOI] [PMC free article] [PubMed] [Google Scholar]
- 46.Leclerc D, Sibani S, Rozen R. Landes Bioscience. Austin (TX): Madame Curie Bioscience Database [Internet]; 2013. Molecular biology of methylenetetrahydrofolate reductase (MTHFR) and overview of mutations/polymorphisms. Available from: https://www.ncbi.nlm.nih.gov/books/NBK6561/ [Google Scholar]
- 47.Li R, Wang R, Li Y, et al. Association study on MTHFR polymorphisms and meningioma in northern China. Gene. 2013;516:291–3. doi: 10.1016/j.gene.2012.12.019. [DOI] [PubMed] [Google Scholar]
- 48.Liew S-C, Gupta ED. Methylenetetrahydrofolate reductase (MTHFR) C677T polymorphism, epidemiology, metabolism and the associated diseases. Eur J Med Genet. 2015;58:1–10. doi: 10.1016/j.ejmg.2014.10.004. [DOI] [PubMed] [Google Scholar]
- 49.Lim U, Wang SS, Hartge P, et al. Gene-nutrient interactions among determinants of folate and one-carbon metabolism on the risk of non-Hodgkin lymphoma, NCI-SEER case-control study. Blood. 2007;109:3050–9. doi: 10.1182/blood-2006-07-034330. [DOI] [PMC free article] [PubMed] [Google Scholar]
- 50.Liu N, Jiang J, Song YJ, et al. Impact of MTHFR polymorphisms on methylation of MGMT in glioma patients from Northeast China with different folate levels. Genet Mol Res. 2013;12:5160–71. doi: 10.4238/2013.October.29.10. [DOI] [PubMed] [Google Scholar]
- 51.Lwin H, Yokoyama T, Date C, et al. Are the associations between life-style related factors and plasma total homocysteine concentration different according to polymorphism of 5, 10-methylenetetrahydrofolate reductase gene (C677T MTHFR)? J Epidemiol. 2002;12:126–35. doi: 10.2188/jea.12.126. [DOI] [PMC free article] [PubMed] [Google Scholar]
- 52.Ma J, Stampfer MJ, Giovannucci E, et al. Methylenetetrahydrofolate reductase polymorphism, dietary interactions, and risk of colorectal cancer. Cancer Res. 1997;57:1098–102. [PubMed] [Google Scholar]
- 53.Matsuo K, Suzuki R, Hamajima N, et al. Association between polymorphisms of folate- and methionine-metabolizing enzymes and susceptibility to malignant lymphoma. Blood. 2001;97:3205–9. doi: 10.1182/blood.v97.10.3205. [DOI] [PubMed] [Google Scholar]
- 54.Muftuoglu T, Ozcan O, Cosar A, Gultepe M. Higher homocysteine levels in young Indian adults, impact of vitamin B12 and folate deficiencies. Indian J Med Res. 2013;138:562. [PMC free article] [PubMed] [Google Scholar]
- 55.Muzumdar D. Glioma, a continuing challenge and a mystery? Indian J Cancer. 2009;46:79–81. doi: 10.4103/0019-509x.49144. [DOI] [PubMed] [Google Scholar]
- 56.Olteanu H, Munson T, Banerjee R. Differences in the efficiency of reductive activation of methionine synthase and exogenous electron acceptors between the common polymorphic variants of human methionine synthase reductase. Biochemistry. 2002;41:13378–85. doi: 10.1021/bi020536s. [DOI] [PubMed] [Google Scholar]
- 57.Ostrom QT, Gittleman H, Liao P, et al. CBTRUS statistical report, primary brain and central nervous system tumors diagnosed in the United States in 2007–2011. Neuro Oncol. 2014;16:iv1–63. doi: 10.1093/neuonc/nou223. [DOI] [PMC free article] [PubMed] [Google Scholar]
- 58.Ouerhani S, Oliveira E, Marrakchi R, et al. Methylenetetrahydrofolate reductase and methionine synthase polymorphisms and risk of bladder cancer in a Tunisian population. Cancer Genet Cytogenet. 2007;176:48–53. doi: 10.1016/j.cancergencyto.2007.03.007. [DOI] [PubMed] [Google Scholar]
- 59.Pegoraro RJ, Chikosi A, Rom L, Roberts C, Moodley J. Methylenetetrahydrofolate reductase gene polymorphisms in black South Africans and the association with preeclampsia. Acta Obstet Gynecol Scand. 2004;83:449–54. doi: 10.1111/j.0001-6349.2004.0355.x. [DOI] [PubMed] [Google Scholar]
- 60.Platek ME, Shields PG, Marian C, et al. Alcohol consumption and genetic variation in methylenetetrahydrofolate reductase and 5-methyltetrahydrofolate-homocysteine methyltransferase in relation to breast cancer risk. Cancer Epidemiol Biomark Prev. 2009;18:2453–9. doi: 10.1158/1055-9965.EPI-09-0159. [DOI] [PMC free article] [PubMed] [Google Scholar]
- 61.Rai PS, Murali TS, Vasudevan TG, et al. Genetic variation in genes involved in folate and drug metabolism in a south Indian population. Indian J Hum Genet. 2011;17:48. doi: 10.4103/0971-6866.80359. [DOI] [PMC free article] [PubMed] [Google Scholar]
- 62.Rai V, Yadav U, Kumar P. Prevalence of methylenetetrahydrofolate reductase C677T polymorphism in eastern Uttar Pradesh. Indian J Hum Genet. 2012;18:43–6. doi: 10.4103/0971-6866.96645. [DOI] [PMC free article] [PubMed] [Google Scholar]
- 63.Ryan BM, Molloy AM, McManus R, et al. The methylenetetrahydrofolate reductase (MTHFR) gene in colorectal cancer, role in tumor development and significance of allelic loss in tumor progression. Int J Gastrointest Cancer. 2001;30:105–11. doi: 10.1385/IJGC:30:3:105. [DOI] [PubMed] [Google Scholar]
- 64.Saraswathy KN, Asghar M, Samtani R, et al. Spectrum of MTHFR gene SNPs C677T and A1298C, a study among 23 population groups of India. Mol Biol Rep. 2012;39:5025–31. doi: 10.1007/s11033-011-1299-8. [DOI] [PubMed] [Google Scholar]
- 65.Selhub J. Homocysteine metabolism. Annu Rev Nutr. 1999;19:217–46. doi: 10.1146/annurev.nutr.19.1.217. [DOI] [PubMed] [Google Scholar]
- 66.Semmler A, Simon M, Moskau S, Linnebank M. Polymorphisms of methionine metabolism and susceptibility to meningioma formation. J Neurosurg. 2008;108:999–1004. doi: 10.3171/JNS/2008/108/5/0999. [DOI] [PubMed] [Google Scholar]
- 67.Shah AH, Barbarite E, Scoma C, et al. Revisiting the relationship between ethnicity and outcome in glioblastoma patients. Cureus. 2017;9:e954. doi: 10.7759/cureus.954. [DOI] [PMC free article] [PubMed] [Google Scholar]
- 68.Shi M, Caprau D, Romitti P, Christensen K, Murray JC. Genotype frequencies and linkage disequilibrium in the CEPH human diversity panel for variants in folate pathway genes MTHFR, MTHFD, MTRR, RFC1, and GCP2. Birt Defects Res A Clin Mol Teratol. 2003;67:545–9. doi: 10.1002/bdra.10076. [DOI] [PubMed] [Google Scholar]
- 69.Shields DC, Kirke PN, Mills JL, et al. The 'thermolabile'variant of methylenetetrahydrofolate reductase and neural tube defects, An evaluation of genetic risk and the relative importance of the genotypes of the embryo and the mother. Am J Hum Genet. 1999;64:1045–55. doi: 10.1086/302310. [DOI] [PMC free article] [PubMed] [Google Scholar]
- 70.Shrubsole MJ, Gao Y-T, Cai Q, et al. MTR and MTRR polymorphisms, dietary intake, and breast cancer risk. Cancer Epidemiol Biomark Prev. 2006;15:586–8. doi: 10.1158/1055-9965.EPI-05-0576. [DOI] [PubMed] [Google Scholar]
- 71.Singh HS, Salam K, Saraswathy KN. A study on MTHFR C677T gene polymorphism and alcohol dependence among meiteis of Manipur India. J Biomark. 2014;2014:e310241. doi: 10.1155/2014/310241. [DOI] [PMC free article] [PubMed] [Google Scholar]
- 72.Sirachainan N, Wongruangsri S, Kajanachumpol S, et al. Folate pathway genetic polymorphisms and susceptibility of central nervous system tumors in Thai children. Cancer Detect Prev. 2008;32:72–8. doi: 10.1016/j.cdp.2008.02.004. [DOI] [PubMed] [Google Scholar]
- 73.Sohn K-J, Jang H, Campan M, et al. The methylenetetrahydrofolate reductase C677T mutation induces cell-specific changes in genomic DNA methylation and uracil misincorporation, A possible molecular basis for the site-specific cancer risk modification. Int J Cancer J Int Cancer. 2009;124:1999–2005. doi: 10.1002/ijc.24003. [DOI] [PMC free article] [PubMed] [Google Scholar]
- 74.Suzuki T, Matsuo K, Hirose K, et al. One-carbon metabolism-related gene polymorphisms and risk of breast cancer. Carcinogenesis. 2008;29:356–62. doi: 10.1093/carcin/bgm295. [DOI] [PubMed] [Google Scholar]
- 75.Tanaka T, Scheet P, Giusti B, et al. Genome-wide association study of vitamin B6vitamin B12folate, and homocysteine blood concentrations. Am J Hum Genet. 2009;84:477–82. doi: 10.1016/j.ajhg.2009.02.011. [DOI] [PMC free article] [PubMed] [Google Scholar]
- 76.Thakkar JP, Dolecek TA, Horbinski C, et al. Epidemiologic and molecular prognostic review of glioblastoma. Cancer Epidemiol Biomark Prev Publ. 2014;23:1985–96. doi: 10.1158/1055-9965.EPI-14-0275. [DOI] [PMC free article] [PubMed] [Google Scholar]
- 77.Ueland PM, Hustad S, Schneede J, Refsum H, Vollset SE. Biological and clinical implications of the MTHFR C677T polymorphism. Trends Pharmacol Sci. 2001;22:195–201. doi: 10.1016/s0165-6147(00)01675-8. [DOI] [PubMed] [Google Scholar]
- 78.Villà S, Balañà C, Comas S. Radiation and concomitant chemotherapy for patients with glioblastoma multiforme. Chin J Cancer. 2014;33:25–31. doi: 10.5732/cjc.013.10216. [DOI] [PMC free article] [PubMed] [Google Scholar]
- 79.Walsh KM, Anderson E, Hansen HM, et al. Analysis of 60 reported glioma risk SNPs replicates published GWAS findings but fails to replicate associations from published candidate-gene studies. Genet Epidemiol. 2013;37:222–8. doi: 10.1002/gepi.21707. [DOI] [PMC free article] [PubMed] [Google Scholar]
- 80.Weisberg I, Tran P, Christensen B, Sibani S, Rozen R. A second genetic polymorphism in methylenetetrahydrofolate reductase (MTHFR) associated with decreased enzyme activity. Mol Genet Metab. 1998;64:169–72. doi: 10.1006/mgme.1998.2714. [DOI] [PubMed] [Google Scholar]
- 81.Wen PY, Kesari S. Malignant gliomas in adults. N Engl J Med. 2008;359:492–507. doi: 10.1056/NEJMra0708126. [DOI] [PubMed] [Google Scholar]
- 82.Williams JA. Single nucleotide polymorphisms, metabolic activation and environmental carcinogenesis, why molecular epidemiologists should think about enzyme expression. Carcinogenesis. 2001;22:209–14. doi: 10.1093/carcin/22.2.209. [DOI] [PubMed] [Google Scholar]
- 83.Wrensch M, Fisher JL, Schwartzbaum, et al. The molecular epidemiology of gliomas in adults. Neurosurgical Focus. 2005;19:1–11. doi: 10.3171/foc.2005.19.5.6. [DOI] [PubMed] [Google Scholar]
- 84.Xu C, Yuan L, Tian H, Cao H, Chen S. Association of the MTHFR C677T polymorphism with primary brain tumor risk. Tumour Biol J Int Soc Oncodevelopmental Biol Med. 2013;34:3457–64. doi: 10.1007/s13277-013-0922-9. [DOI] [PubMed] [Google Scholar]
- 85.Yan Y, Han F, Fu H, Xia W, Qin X. Association between MTHFR C677T polymorphism and thyroid cancer risk, a meta-analysis. Tumour Biol. 2014;35:7707–12. doi: 10.1007/s13277-014-2038-2. [DOI] [PubMed] [Google Scholar]
- 86.Yang B, Liu Y, Li Y, et al. Geographical distribution of MTHFR C677T, A1298C and MTRR A66G gene polymorphisms in China, findings from 15,357 adults of Han nationality. PLoS One. 2013;8:e57917. doi: 10.1371/journal.pone.0057917. [DOI] [PMC free article] [PubMed] [Google Scholar]
- 87.Yetley EA, Johnson CL. Folate and vitamin B12biomarkers in NHANES, history of their measurement and us e12,345. Am J Clin Nutr. 2011;94:322–31. doi: 10.3945/ajcn.111.013300. [DOI] [PMC free article] [PubMed] [Google Scholar]
- 88.Yoshimura K, Hanaoka T, Ohnami S, et al. Allele frequencies of single nucleotide polymorphisms (SNPs) in 40 candidate genes for gene-environment studies on cancer, data from population-based Japanese random samples. J Hum Genet. 2003;48:654–8. doi: 10.1007/s10038-003-0096-1. [DOI] [PubMed] [Google Scholar]
- 89.Yu K, Zhang J, Zhang J, et al. Methionine synthase A2756G polymorphism and cancer risk, a meta-analysis. Eur J Hum Genet. 2009;18:370–8. doi: 10.1038/ejhg.2009.131. [DOI] [PMC free article] [PubMed] [Google Scholar]
- 90.Zeng X-T, Lu J-T, Tang X-J, Weng H, Luo J. Association of methionine synthase rs1801394 and methionine synthase reductase rs1805087 polymorphisms with meningioma in adults, A meta-analysis. Biomed Rep. 2014;2:432–6. doi: 10.3892/br.2014.248. [DOI] [PMC free article] [PubMed] [Google Scholar]
- 91.Zhang J, Zhou Y-W, Shi H-P, et al. 5,10-Methylenetetrahydrofolate reductase (MTHFR), methionine synthase (MTRR), and methionine synthase reductase (MTR) gene polymorphisms and adult meningioma risk. J Neurooncol. 2013;115:233–9. doi: 10.1007/s11060-013-1218-z. [DOI] [PubMed] [Google Scholar]