

Abstract
Cervical cancer leads to major death disease in women around the world every year. This cancer can be cured if it is initially screened and giving timely treatment to the patients. This paper proposes a novel methodology for screening the cervical cancer using cervigram images. Oriented Local Histogram Technique (OLHT) is applied on the cervical image to enhance the edges and then Dual Tree Complex Wavelet Transform (DT-CWT) is applied on it to obtain multi resolution image. Then, features as wavelet, Grey Level Co-occurrence Matrix (GLCM), moment invariant and Local Binary Pattern (LBP) features are extracted from this transformed multi resolution cervical image. These extracted features are trained and also tested by feed forward back propagation neural network to classify the given cervical image into normal and abnormal. The morphological operations are applied on the abnormal cervical image to detect and segment the cancer region. The performance of the proposed cervical cancer detection system is analyzed in the terms of sensitivity, specificity, accuracy, positive predictive value, negative predictive value, Likelihood Ratio positive, Likelihood ratio negative, precision, false positive rate and false negative rate. The performance measures for the cervical cancer detection system achieves 97.42% of sensitivity, 99.36% of specificity, 98.29% of accuracy, PPV of 97.28%, NPV of 92.17%, LRP of 141.71, LRN of 0.0936, 97.38 % precision, 96.72% FPR and 91.36% NPR. From the simulation results, the proposed methodology outperforms the conventional methodologies for cervical cancer detection and segmentation process.
Keywords: Cervical cancer, cervigram, features, Gabor transforms, neural networks
Introduction
Most of the deaths are occurred around the world based on cancer. Breast and Cervical cancers are the most live killing diseases of women patients in and around the world (Susan et al., 2018). Breast cancer is occurred in women patient externally and it can be detected by scanning the breast region. The women patients who are affected by breast cancer, can check themselves, hence it can be detected in women patients at an earlier manner as depicted in Kwok et al., (2011). The cervical cancer is also occurred in the women patient internally and it can be detected by scanning the internal region of the vagina. Human Papillomavirus (HPV) virus (NCCC, 2010) is the main cause of cervical cancer formation in women patients. This virus initially affects the cells in the cervical region of the women patients and spreads over the entire region of the cervix (Robbins et al., 2009). The women patients who are affected by cervical cancer, unable to check themselves, hence it cannot be detected at an earlier stage. Hence, death ratio of the women patients is high due to cervical cancer. The cells inside the cervix are categorized into squamous cells and glandular cells as stated in Mouelhi et al., (2013). Squamous cell carcinoma is the type of cervical cancer which is occurred in women patients due to infection of squamous cells in cervix region and adenocarcinoma, which is another type of cervical cancer which is occurred in the women patients due to the infection of glandular cells in cervix region (American Cancer Society, 2011). Squamous cell carcinoma affects the outer region of the cervix only and adenocarcinoma affects the inner region of the cervix. The cervical cancer in women can be screened by either Pap smear test or Cervicogram test (Katz et al., 2010).
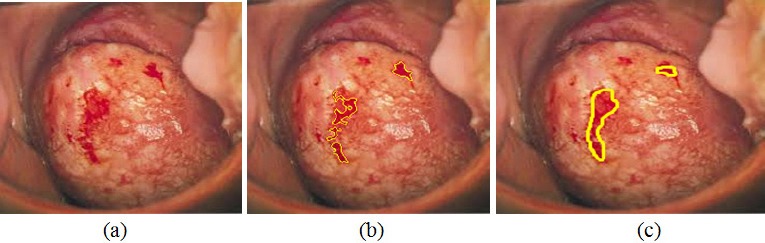
The main reason for the death due to cervical cancer in women patients is that it cannot be detected at an earlier stage and the patients can not receive any symptoms until they reach final stage of the cancer. The death ratio of the women patients can be reduced if it is detected at an earlier stage only. Hence, this paper proposes a methodology to detect the cervical cancer at an earlier stage to prevent death of women patients. Conventional methods are based on human experts and it is time consuming process. Further, it is not suitable for the developing countries having large population due to the lack of trained experts or radiologist in this field (Susan et al., 2018). Hence, there is a requirement of fully automated methodology for cervical cancer detection. The cervix region, which is the main region of interest within the cervigram, is located in the central part of the image (Song et al. 2015; Sulaimana et al., 2011). Typical uterine cervix image of normal and abnormal case is shown in Figure 1.
Figure 1.

Cervical Images (a) Normal Case (b) Abnormal Case
In this paper, an automatic system for the detection of cervical Cancer is proposed for earlier detection of Cancer in female patients. Section 2 presents the conventional methodologies for cervical Cancer detection and Section 3 elaborates the proposed cervical Cancer detection and segmentation system. Section 4 discusses the experimental results and Section 5 concludes the work.
Literature Survey
Devi et al., (2016) used neural network classification algorithm for detecting and segmenting the cancer region in cervical images. The authors applied their proposed algorithm with region growing segmentation technique in order to improve the cancer segmentation accuracy. Kumar and Srivastava (2014) proposed a methodology to detect the abnormal regions in cervix regions of the women patients. The authors used biopsy images for scanning the cervical regions of the patients with the help of Computer Aided Detection (CAD) approach. This computer aided approaches improves the classification accuracy of the cervical cancer detection system with the aid of various soft computing techniques. The authors achieved 86% of sensitivity and 91% of tumor segmentation accuracy with respect to ground truth images. Chen et al., (2014) used Pap smear cell screening technique to detect the cervical cancer in women patients. The energy and texture features were obtained from the cervical image and these features were used for the cervical classifications using Support Vector Machine (SVM) classifier. The authors achieved 96.12% of average classification rate for Pap smear cell classifications. The main drawback of this approach was that it is suitable for only high resolution images. Rama Praba et al., (2013) used color histogram technique as preprocessing stage which further extracted color features from the preprocessed cervical image. These extracted color histogram features were trained and classified using Naïve Bayes classifier. The authors achieved 85% of average classification rate for cervical cancer detection. Mouelhi et al., (2013) applied feature extraction technique on the cervical images for classifications. The authors extracted texture and Gradient features from both normal and abnormal category. These features were trained and classified using sub fold classifier. Bergmeir et al., (2012) used feature extraction based classification approach for cervical cancer detection. The authors extracted texture features and Energy setup features from the cervical image and these features were trained by Quasi Supervised Learning (QSL) algorithm. The authors tested their proposed algorithm on labeled and unlabeled dataset which contained known and unknown cervical images. The authors achieved 88% of True Positive Rate (TPR) and 19% of False Positive Rate (FPR) for the set of 132 cervical images in both normal and abnormal category.
Huang and Lai (2010) developed a technique for cervical cancer detection using SVM classifier. The author’s initially extracted texture features from histopathological images and then these features were trained and classified by SVM classifier. The authors achieved 92.8% of classification accuracy for cervical cancer detection. Landini et al., (2010) used cervical cancer cell classification technique on biopsy cell images. The authors used watershed transform for decomposing the cervical image and then features as energy and entropy were extracted from these decomposed coefficients. KNN classifier was used to classify the extracted features and the cell images were classified as either dysplastic or neoplastic cancer. The authors achieved 83% of classification rate for dysplastic cells and 58% of classification rate for neoplastic cells. Demir and Yener (2005) developed a technique which was based on biopsy image scanning for cervical cancer detection. The authors analyzed cellular level diagnosis technique for the screening process.
The following points are observed from the conventional cervical cancer detection methods.
The conventional methods are suitable only for high resolution cervical images.
The external boundary region of the cancer regions was only detected.
The sensitivity and accuracy rate was not optimum for further cervical cancer diagnosis.
These limitations of the conventional methods are overcome by proposing a computer aided fully automatic methodology to screen the cervical cancer region in cervical images using Neural Network classifier.
Materials and Methods
Materials
The cervical images used in this paper are obtained from Guanacaste dataset (2005). This dataset contains large numbers of cervical images with its corresponding ground truth images, which are marked by expert radiologist. In this paper, the images from this dataset are automatically classified into various severity classifications.
Methods
The proposed method for the detection of cervical Cancer is a computer aided automatic detection system. The overall procedure for the detection mechanism is illustrated in Figure 2. The original cervical image is initially preprocessed, in which the image is applied with image enhancement technique using Oriented Local Histogram Equalization (OLHE) and then the enhanced image is transformed into Dual Tree Complex Wavelet Transform. The preprocessed image is then used to extract features such as wavelet features, GLCM features and moment invariant features. These features are used to train the neural network classifier to classify the cervical image into benign or malignant, comparing with the trained features. Finally, the performance of the cervical image classification is analyzed in terms of performance measurement parameters as average sensitivity, average specificity and average accuracy.
Figure 2.

Proposed Flow of Cervical Cancer Detection System
Pre-processing and Contrast Enhancement
Preprocessing is used in this paper to enhance the internal regions of the cervical image for obtaining high abnormal region segmentation. The cervical image is an RGB image and this image is converted into grey scale image for further processing. Enhancement is further required for low resolution cervical image which enhances the edges of the cervical image. In this paper, OLHE enhancement technique is used to improve contrast in low resolution cervical images. This technique is the modification of Local Histogram Equalization (LHE), but it captures the orientation of edges while LHE does not. For each pixel on a cervical image, OLHE is computed on the local w×h (Width and Height) window centering on this pixel using,

Where, x is the pixel intensity value, cdf (x) is the cumulative distribution function of the histogram of the pixel intensities in the w-by-h window (generally it is considered as 3*3 pixels-started from the beginning of the image and end up with the last pixel in source cervical image), cdfmin is the minimum intensity in this window, and L is the desired number of output gray levels. This value be floated and leads to losses during recionstruction of pixels. In order to avoid this, the value of enhanced pixel is rounded to next adjacent integer.
This w-by-h window is moved from right to left at the beginning of the image and end up with the last pixel in the cervical image. For each window movement, there is the enhanced pixel generated.
The center of the k×k window is called the anchor. For LHE, the anchor point is the pixel to be processed itself. The following gives the formal definition of the OLHE operators:
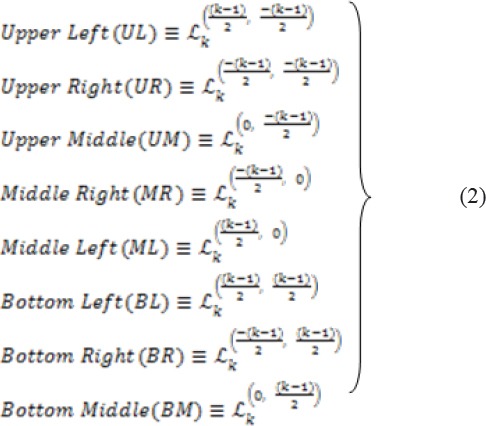
Where k is an odd number. Eight resolution enhanced images are formed during OLHE process. The maximum intensity pixels in each resolution enhanced images are used to select the optimum pixel intensity to form the enhanced image. The enhanced cervical images at each orientation is obtained by this method and shown in Figure 3.
Figure 3.

Orientation Images (a) Upper left (UL) orientation image (b) Upper middle (UM) orientation image (c) Upper right (UR) orientation image (d) Middle left (ML) orientation image (e) Middle right (MR) orientation image (f) Bottom left (BL) orientation image (g) Bottom middle (BM) orientation image (h) Bottom right (BR) orientation image
From Figure 3, it is very clear that the pixels in enhanced cervical image are having higher pixel values than the source cervical image. The abnormal patterns are clearly visible in enhanced cervical image.
Dual Tree Complex Wavelet Transform (DT-CWT)
Time domain analysis or decomposition of the image represents the location of the time varying objects in the image, but it is unable to analyze the changes in frequency levels those involved in time varying objects. Frequency domain analysis or decomposition of the image represents the variations in frequency band which do not analyze their time domain variations involved in the frequency variations. To overcome such limitations, there is a need for time-frequency analysis or decomposition. There is lot of time-frequency analysis techniques proposed in conventional methods. A conventional analysis technique such as Gabor Transform was used as time-frequency analysis. The main limitation of this analysis technique was that it cannot be used for image decomposition. Hence, this paper uses dual tree- complex wavelet transform for the decomposition of the preprocessed cervical image. This analysis technique decomposes the image into number of sub bands with respect to various scales.
DT-CWT uses dual Discrete Wavelet Transform (DWT) for decomposing the image. One DWT transform is used to analyze the real part of the decomposition and another DWT transform is used to analyze the imaginary part of the decomposition. The DWT incorporated with real term (Real tree) is represented by Ψr(t) and DWT incorporated with imaginary term (Imaginary tree) is represented by Ψi(t). Each tree in the decomposition architecture has number of filters as low pass and high pass filters. The upper part of the decomposition architecture contains set of filters as low pass filer (h0(n)) and high pass filter (h1(n)). The lower part of the decomposition architecture contains set of low pass filter (g0(n)) and high pass filter (g1(n)). There is a conjunction between the filters presented in real and imaginary tree which can be described as,

The DT-CWT decomposes preprocessed cervical image into complex wavelet function Ψc(t) and its scale function Φi(t) which can be given as,


Where, Ψr(t)andΨi(t)denotes real and imaginary wavelet function and Φr(t)and Φi(t)denotes real and imaginary scale function.
Further, the complex wavelet function and complex scale function is decomposed into real and imaginary part as given below,


denotes the low pass filter of the complex scale function and denotes high pass filter of the complex wavelet function. The cervical image decomposition can be done using toolbox in MATLAB software. In this paper, four level of decomposition is used to analyze the time-frequency behavior of the cervical image. The decomposition of preprocessed brain image using DT-CWT is depicted in Figure 5.
Figure 5.

Decomposition of Preprocessed Brain Image Using DT-CWT
Figure 4.

(a) Cervical image (b) Edge enhanced cervical image
Feature Extraction
Features represent the characteristics of the pattern of the pixels in the image. In this paper, the feature set as GLCM, Moment invariant features, wavelet features and Local Binary Pattern (LBP) features are extracted from the Gabor transformed cervical image to differentiate the normal cervical image from the abnormal cervical image.
GLCM features
Energy features of cervical image are obtained by using the feature extraction technique called GLCM. It can be constructed for any single channel image. The GLCM is a square matrix where the number of rows and columns equals the number of gray levels in the original image. The GLCM matrix is constructed by calculating how often a pixel with grayscale intensity occurs adjacent to a pixel with the value of the fused cervical image at different orientations as 0°,45°,90° and 135°. In this work, GLCM matrix is constructed at 45°. The GLCM features are used to differentiate the malignant image from the normal cervical image in terms of contrast, energy, entropy and correlation.
The four features contrast, correlation, energy, and homogeneity are used to extract the features of the cervical image.
Contrast: It is defined as,

This texture feature measures the contrast in gray level from one pixel to its neighbour. The contrast ranges from zero for a constant image to (G-1)2, where G is the number of gray levels.
Correlation: It is defined by,

R measures the correlation between intensities in neighbouring pixels. μi is the row average and μj is the column average of the GLCM. σi and σj are the standard deviations of row i and column j in the GLCM, respectively.
Energy: It is an angular second moment, and computed by the sum of squares of all the elements in the GLCM,

Energy measures uniformity, and ranges from zero to unity for a uniform image.
Entropy: It is defined as,

It is a measure of the closeness of the elements in the GLCM to the diagonal. It ranges from zero to one.
Wavelet Features
Wavelets are useful in multi-resolution analysis of cervical images because they are fast and give better transformation as compared to other transforms such as Contourlet and Curvelet. In this paper, Discrete Wavelet Transform (DWT) is applied to each row and column of the magnitude response Gabor image to decompose it. The first level decomposition generates four sub-bands: LL, HL, LH, and HH sub-bands. L represents low frequency and H represents high frequency. Further, LL sub-band is applied to second level decomposition of DWT, which produces again four sub bands. All these sub bands are used as the feature pattern for the cervical image classifications.
Moment Invariant Features
The input features are extracted by making use of moment invariants technique. There are many types of moment invariants like Legendre, Geometric, Zernike and Complex moment Invariants. Among which Legendre moment Invariants is chosen as its performance is better when compared with others. It is used for pattern recognition in cervical image. The normalization is done by making use of complex and geometric moment invariants. For two dimensional image of size M*M, the moments are given by,

By translating an amount the moments are given by,

By substituting, and the central moments are given by,

The extracted moment invariant feature images are shown in Figure 6(a) and Figure 6(b).
Figure 6.

(a) Moment Invariant feature image 1; (b) Moment Invariant feature image 2
Shape features
This feature set is used to describe the characteristics of the feature for the image regions in the cervical image, which is used to differentiate the normal cervical image from the abnormal cervical image. In this paper, Roundness, sides and circularity are extracted from the preprocessed cervical image.
Roundness
It is used to describe the shape of the image regions in the cervical image and this feature is based on the parameter sigma and distance. It is given as,

Where as, sigma is the discriminate parameter which is computed using the Euclidean distance technique and it is given as,

Where, N is the total number of pixels in the preprocessed cervical image, is the center pixel in the image and is the pixel in cervical image. The parameter ‘Distance’ is given as,

Sides
The roundness property can be described by number of sides in the abnormal image region. It can be defined as,

Circularity
It is used to find the similar regions in the preprocessed cervical image and it is given as,

LBP
It is a binary feature which generates the single feature value for each corresponding pixel in the cervical image. The center pixel in 3*3 sub window is compared with its all corresponding pixels in the sub window. If the center pixel value is greater than the surrounding pixel value, the surrounding pixel is set to ‘0’ else it is set to ‘1’. All the surrounding 8-bit pattern will now generates its equivalent integer value and it is assigned to its center value. The procedure is repeated until no more pixels in cervical image.
Classification
In recent years, machine learning methods have been widely used in prediction, especially in medical diagnosis. Medical diagnosis is one of major problem in medical application. Several research groups are working world wide on the development of neural networks in medical diagnosis. In this paper, feed forward back propagation neural network is used to increase the cervical image classification accuracy. The construction of the neural network involves three different layers with feed forward architecture. The input layer of this network is a set of input units, which accept the elements of input feature vectors which are obtained from feature extraction process. In this paper, three numbers of hidden layers are used. Each hidden layer have different number of neurons on it. The input units (neurons) are fully connected to the hidden layer with the hidden units. The hidden units (neurons) are also fully connected to the output layer. The output layer supplies the response of neural network to the activation pattern applied to the input layer. The information given to a neural net is propagated layer-by-layer from input layer to output layer through (none) one or more hidden layers.
The layer1 can be designed using the following equation as stated below using its mean values (µ(x) and µ(y)) of extracted features with respect to its training of normal and abnormal images.

The layer 2 of the proposed architecture can be designed using the following equation with respect to its weight.

The layer 3 can be designed using the following equation as stated below using the response of layer 2.

The layer 4 can be designed as,

The final response of the proposed classification algorithm as stated in the following equation.

Back propagation learning uses the gradient descent procedure to remodel the connection weights which is derived from the consideration of minimizing some error function. This error function is needed to change the network parameter, which proves to be advantageous in improving the network performance. Weight training in NN’s is usually formulated as minimization of an error function and has the mean square error between target and actual outputs averaged overall examples, by iteratively adjusting connection weights. The neural network generates the response either zero or one, based on the trained pattern in training mode of the classifier. The low value indicates the test cervical image is categorized into normal and high value indicates the test cervical image is categorized into abnormal.
Morphological Operations
The Cancer regions are classified abnormal cervical image are segmented using morphological operations. The morphological operators are the erosion and dilation of the set with a structuring element. Opening is the erosion of an image followed by the dilation; it breaks narrow isthmuses and eliminates small objects and sharp peaks in the image. On the other hand, closing is the dilation of an image followed by the erosion; it fuses narrow breaks and fills tiny holes and gaps in the image. This technique can enhance region of interest (ROI) of the images perfectly by removing and adding small shape in the focused images.
• Dilation: This operator is applied on the classified abnormal cervical image to progressively expand the boundaries of regions of foreground pixels (i.e. white pixels, typically).

Where, ‘I’ represent the classified abnormal cervical image and represents the structuring element.
• Erosion: This operator is applied on the classified abnormal cervical image to erode away the boundaries of regions of foreground pixels (i.e. white pixels, typically).

Where, represents the translation of the structuring element (s) by the vector ‘x’ and represents the symmetry of ‘s’; is dilation and is erosion.
Figure 7(a) shows the binary image which is obtained during dilation process and Figure 7(b) shows the Region of Interest (ROI) image, which illustrates the Cancer region. Figure 7(c) shows the Cancer segmented cervical image.
Figure 7.

(a) Binary image; (b) ROI image; (c) Cancer segmentation image
Results
The performance of the proposed cervical cancer detection system is measured using confusion matrix of size 2×2 matrix and the value of True positive (TP), True negative (TN), False positive (FP), and False negative (FN) is estimated with respect to ground truth images, which are obtained from expert radiologist. The performance parameters average Sensitivity, Specificity, Accuracy, Positive Predictive Value (PPV), Negative Predictive Value (NPV), Likelihood Ratio Positive (LRP) and Likelihood Ratio Negative (LRN) are calculated and the fundamental definitions of these performance measures could be illustrated as follows.
Accuracy: The classification accuracy of a technique depends upon the number of correctly classified images (i.e., true negative and true positive) and is calculated as follows,
Sensitivity: It is a measure of the proportion of positive samples which are correctly classified. The value of sensitivity ranges between 0 and 1.
Specificity: It is a measure of the proportion of negative samples that are correctly classified.
Positive Predictive Value: It counts the number of positive pixels belongs to correctly detected cancer region pixels.
Negative Predictive Value: It counts the number of negative pixels belongs to wrongly detected cancer region pixels.
Likelihood Ratio Positive (LRP) and Likelihood Ratio Negative (LRN) is the other performance evaluation parameters of the proposed cervical cancer detection system based on its sensitivity and specificity.
Precision: It measures the tumor segmentation accuracy and it is measured in %. It is based on the evaluation parameters TP and FP.
False Positive Rate (FPR): The number of detected correctly cancer pixels in the classified cervical image is represented by FPR and it is based on FP and TN.
False Negative Rate (FNR): The number of detected correctly non- cancer pixels in the classified cervical image is represented by FNR and it is based on FN and TP.
Discussion
All these performance evaluation parameters are measured in %. The performance evaluation results are tabulated in Table 1. The results of cervical Cancer classified images with stages of Cancer, i.e. mild and severe cases are clearly illustrated in Figure 8 and Figure 9.
Table 1.
Experimental Results
| Performance analysis parameters | Estimated values (%) |
|---|---|
| Sensitivity | 90.70 |
| Specificity | 99.36 |
| Accuracy | 96.37 |
| Positive Predictive Value (PPV) | 97.28 |
| Negative Predictive Value (NPV) | 92.17 |
| Likelihood Ratio Positive (LRP) | 141.71 |
| Likelihood Ratio Negative (LRN) | 0.0936 |
| Precision | 97.38 |
| False Positive Rate (FPR) | 96.72 |
| False Negative Rate (FNR) | 91.36 |
Figure 8.

Mild case (a) Cervical image (b) Proposed Cancer segmentation result (c) Gold standard image
Figure 9.
Severe case (a) Cervical image (b) Proposed Cancer segmentation result (c) Gold standard image
Table 2 shows the impact of features on the segmentation of cervical Cancers. The proposed methodology achieves 91.76% of accuracy with GLCM features and 92.90% of accuracy with the integration of GLCM and wavelet features. The proposed methodology achieves 93.28% of accuracy with the inclusion of GLCM+wavelet+moment invariant features. The proposed methodology achieves 96.37% of accuracy with the inclusion of GLCM+wavelet+moment invariant+shape features. The proposed methodology achieves 98.29% of accuracy with the inclusion of GLCM+wavelet+moment invariant+shape features+LBP features.
Table 2.
Impact of Features on the Results of Cervical Cancer Segmentation
| Features Index | Acc (%) |
|---|---|
| GLCM | 91.76 |
| GLCM+ Wavelet | 92.9 |
| GLCM+ Wavelet+Moment | 93.28 |
| GLCM+ Wavelet+Moment+Shape | 96.37 |
| GLCM+ Wavelet+Moment+Shape+ LBP | 98.29 |
The proposed method is compared with other conventional methods (Chen et al., 2014; Bergmeir et al., 2012) in terms of the performance evaluation parameters, i.e. sensitivity, specificity and accuracy. The performance comparisons are tabulated in Table 3 and it is shown that the proposed method has higher values and proves to be better than most other conventional methodologies.
Table 3.
Performance Comparisons of Proposed System with State of Art Methods
| Methodology | Year | Sensitivity (%) | Specificity (%) | Accuracy (%) |
|---|---|---|---|---|
| Proposed work | 2017 | 97.42 | 99.36 | 98.29 |
| Chen et al. | 2014 | 83.21 | 94.79 | - |
| Bergmeir et al. | 2012 | 75 | 76 | 75.5 |
In this paper, k-fold cross validation method is used to test the proposed model. In this validation method, the total number of cervical images is divided into K-equal number of sample data. The first sample data among K-number of samples is used as validation sample and the remaining K-1 sample data are used as training mode of the method. In this paper, two-fold cross validation method is used to validate the results of the proposed method by setting k=2.
The cross validation error (σ) is computed between k-sample data using the following equation,

Where, k is set to 2 in this paper in order to reduce the cross validation error between samples after several trails. The cross validation error lies between 0 and 1. The low cross validation error shows that the method proposed in this paper is optimum for testing. The high cross validation error shows that the method proposed in this paper is not optimum for testing.
The major strength of this cancer segmentation work is to achieve optimum performance evaluation parameters for evaluating the cancer regions for severity level estimation in an automated manner. The drawback of this paper is that this work did not support the cervical cancer screening using Pap smear images.
In conclusion, an automated detection and classification procedure are presented for detection of cancer from the cervical images using clinically significant and biologically interpretable set of features. The proposed analysis is based on neural network for Cancer detection and classification. For enhancement of the cervical images, oriented local histogram equalization based method is used. For classification of cervical images into normal and abnormal images, neural network classifier is used. The simulation results showed that the proposed cervical Cancer segmentation system is for the detection of non-Cancerous and Cancerous regions in cervical images. The performance measures for the cervical cancer detection system achieves 97.42% of sensitivity, 99.36% of specificity, 98.29% of accuracy, PPV of 97.28%, NPV of 92.17%, LRP of 141.71, LRN of 0.0936, 97.38 % precision, 96.72% FPR and 91.36% NPR. In future, this work can be extended to diagnose the segmented cancer regions in cervical images into various severity levels as ‘Early’ or ‘Advance’ for surgery in order to prevent death. The impact of this cancer due to other diseases can also be detected in future using cervical images and Pap smear images.
Supplementary
References
- 1.American Cancer Society (ACS) What is cervical Cancer? 2011. Available at:< http://www.Cancer.org/Cancer/CervicalCancer/Detailed-Guide/cervical-Cancer-what-is-cervical-Cancer> .
- 2.Bergmeir C, Silvente MG, Benitez JM. Segmentation of cervical cell nuclei in high-resolution microscopic images:a new algorithm and a web-based software framework. Comput Methods Programs Biomed. 2012;107:497–512. doi: 10.1016/j.cmpb.2011.09.017. [DOI] [PubMed] [Google Scholar]
- 3.Chen YF, Huang PC, Lin KC, et al. Semi-automatic segmentation and classification of pap smear cells. IEEE J Biomed Health Inform. 2014;18:1. doi: 10.1109/JBHI.2013.2250984. [DOI] [PubMed] [Google Scholar]
- 4.Demir C, Yener B. Automated cancer diagnosis based on histopathological images:a systematic survey, Tech. New York, NY, USA: Rep., Rensselaer Polytechnic Institute; 2005. [Google Scholar]
- 5.Devi MA, Ravi S, Vaishnavi J, Punitha S. Classification of cervical cancer using artificial neural networks. Procedia Comput Sci. 2016;89:465–72. [Google Scholar]
- 6.aGuanacaste dataset. Available at: http://www.cse.lehigh.edu/idealab/cervitor/downloads.html .
- 7.Huang PW, Lai YH. Effective segmentation and classification for HCC biopsy images. Pattern Recognit. 2010;43:1550–63. [Google Scholar]
- 8.Ji Q, Engel J, Craine E. Texture analysis for classification of cervix lesions. IEEE Trans Med Imaging. 2000;19:11. doi: 10.1109/42.896790. [DOI] [PubMed] [Google Scholar]
- 9.Katz IT, Ware NC, Gray G, et al. Scaling up human papillomavirus vaccination:a conceptual framework of vaccine adherence. Sex Health. 2010;7:279–86. doi: 10.1071/SH09130. [DOI] [PMC free article] [PubMed] [Google Scholar]
- 10.Kumar R, Srivastava R. Some observations on the performance of segmentation algorithms for microscopic biopsy images. Proceedings of the International Conference on Modeling and Simulation of Diffusive Processes and Applications. 2014:16–22. [Google Scholar]
- 11.Kwok C, White K, Roydhouse J. Chinese-Australian womens knowledge, facilitators and barriers related to cervical cancer screening:A qualitative study. J Immigr Minor Health. 2011;13:1076–83. doi: 10.1007/s10903-011-9491-4. [DOI] [PubMed] [Google Scholar]
- 12.Landini G, Randell DA, Breckon TP, Han JW. Morphologic characterization of cell neighborhoods in neoplastic and preneoplastic epithelium. Anal Quant Cytol Histol. 2010;32:30–8. [PubMed] [Google Scholar]
- 13.McCaffery K, Waller J, Nazroo J, Wardle J. Social and psychological impact of HPV testing in cervical screening:a qualitative study. Sex Transm Infect. 2006;82:169–74. doi: 10.1136/sti.2005.016436. [DOI] [PMC free article] [PubMed] [Google Scholar]
- 14.Mouelhi A, Sayadi M, Fnaiech F, Mrad K, Romdhane KB. Automatic image segmentation of nuclear stained breast tissue sections using color active contour model and an improved watershed method. Biomed Signal Process Control. 2013;8:421–36. [Google Scholar]
- 15.NCCC. Cervical cancer. 2010. Available at:< http://www.nccc-online.org/index.php/cervicalCancer> .
- 16.Rama Praba PS, Ranganathan H. Comparing different classifiers for automatic lesion detection in cervix based on colour histogram. J Comput Appl. 2013;6:1. [Google Scholar]
- 17.Robbins CSC, Pang C, Leask J. Australian newspaper coverage of human papillomavirus vaccination, October 2006–December 2009. J Health Commun. 2011;17:149–59. doi: 10.1080/10810730.2011.585700. [DOI] [PubMed] [Google Scholar]
- 18.Song D, Edward K, Xiaolei H, et al. Multimodal entity coreference for cervical dysplasia diagnosis. IEEE Trans Med Imaging. 2015;34:229–35. doi: 10.1109/TMI.2014.2352311. [DOI] [PMC free article] [PubMed] [Google Scholar]
- 19.Sulaimana SN, Isab NAM, Othmanc NH. Semi-automated pseudo color features extraction technique for cervical cancers Pap smear images. Int J Knowledge-based Intell Eng Syst. 2011;15:131–43. [Google Scholar]
- 20.Susan JC, Alex HK. Screening for cervical cancer US preventive services task force recommendation statement. JAMA. 2018;320:674–86. doi: 10.1001/jama.2018.10897. [DOI] [PubMed] [Google Scholar]
Associated Data
This section collects any data citations, data availability statements, or supplementary materials included in this article.