. 2019 Feb 25;8:e42786. doi: 10.7554/eLife.42786

Figure 1. DAN-aSP13 neurons are activated during sleep.

(A) (left) Luminescence of DAN-aSP13 neurons expressing Lola-LUC reporter (MB315B-GAL4>UAS-FLP; Lola>stop>LUC) normalized to luminescence of the genetic control (UAS-FLP; Lola>stop> LUC). Mean luminescence of the wild-type males trained with mated female in single pair assays as indicated (red, n = 42) and naïve males (black, n = 40) is shown as a solid line with SEM indicated as thin vertical lines. (right) Total luminescence in experienced and naïve males between 7–10 hr. P value is for Ho Lucexp = Lucnaive; ***p<0.001. Student T-test. (B) (left) Sleep profile of the wild-type males that were trained for 6 hr with mated females (red, n = 16) and naïve males (black, n = 16). Sleep time was plotted in 30 min bins. (right) Total sleep of the experienced and naïve males between 7–10 hr. P value is for Ho Sleepexp = Sleepnaive; **p<0.01. Student T-test. (C)(left) Sleep profile of the dopR1 mutants that were trained for 6 hr with mated females (red, n = 16) and naïve males (black, n = 16). Sleep time was plotted in 30 min bins. (right) Total sleep of the experienced and naïve males between 7–10 hr. P value is for Ho Sleepexp = Sleepnaive; ns p>0.05. Student T-test. Schematic of the experimental set-up in A, B and C indicates 12 hr light and dark periods (white and black areas) and time of training and test (blue shading).

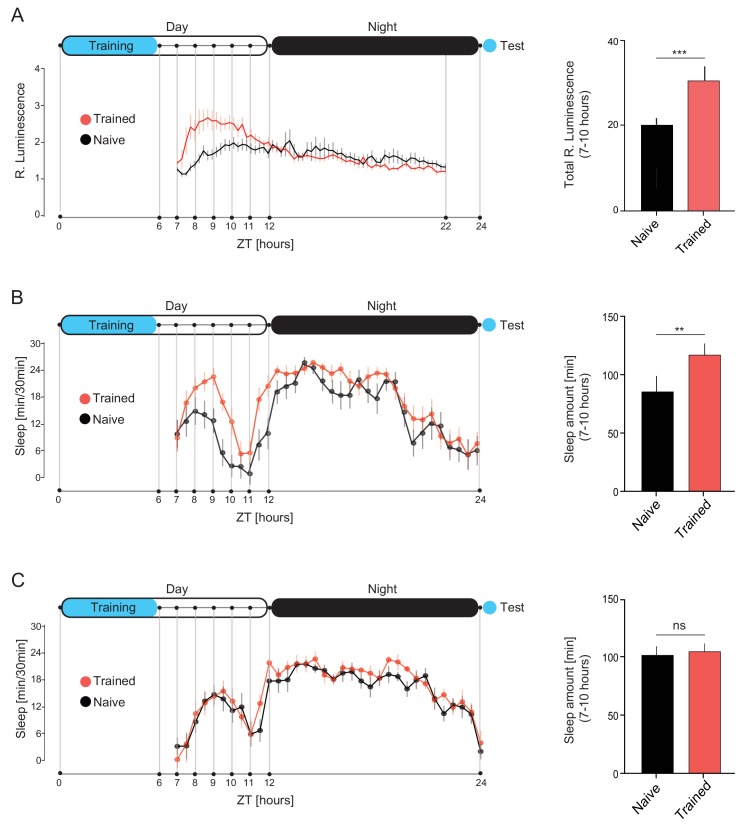
Figure 1.

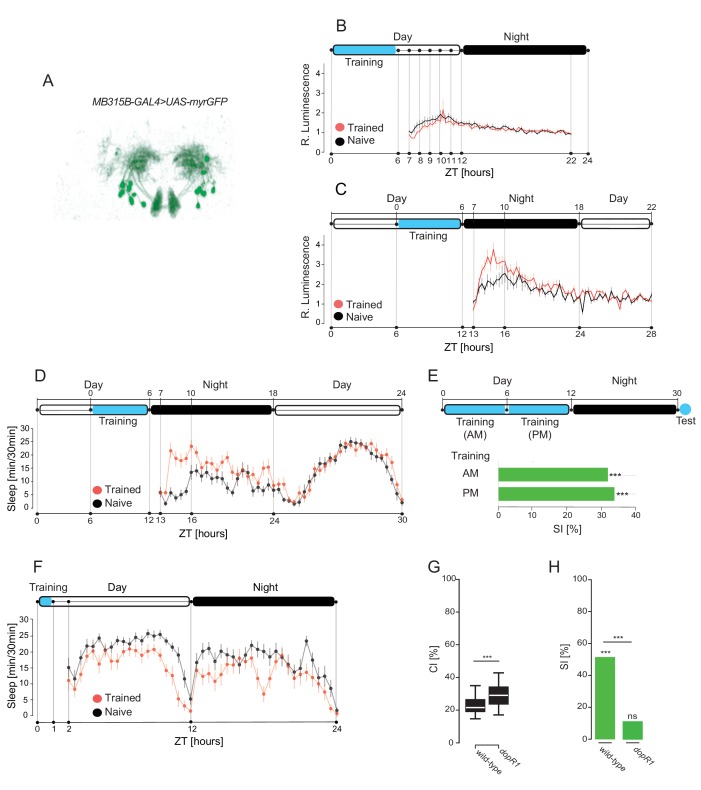
Figure 1—figure supplement 1. Learning sufficient to induce LTM leads to the enhencement of the post-learning sleep and activation of DAN-aSP13 in the specific time window.

Figure 1—figure supplement 1.

(A) Expression pattern of MB315B-GAL4 line. (B) Luminescence of DAN-aSP13 neurons expressing Lola-LUC reporter (MB315B-GAL4>UAS-FLP; Lola>stop>-LUC) normalized to luminescence of the genetic control (UAS-FLP; Lola>stop>LUC). Mean luminescence of the wild-type males trained in single pair assays as indicated with virgin female (red, n = 24) or naïve males (black, n = 20) shown as a solid line with SEM indicated as thin vertical lines. (C) Luminescence of DAN-aSP13 neurons expressing Lola-LUC reporter (MB315B-GAL4 > UAS FLP; Lola > stop > LUC) normalized to luminescence of the genetic control (UAS-FLP; Lola>stop>LUC). Mean luminescence of the wild-type males trained in single pair assays as indicated with mated female (red, n = 22) and naïve males (black, n = 19) is shown as a solid line with SEM indicated as thin vertical lines. (D) Sleep profile of the wild-type males that were trained for 6 hr with mated females as indicated (red, n = 16) and naïve males (black, n = 16). Sleep time was plotted in 30 min bins. (E) SIs of wild type males trained as indicated with a mated female in single pair assays and tested 24 hr later. P value is for Ho SI = 0; ***p<0.001, ns p>0.05. Permutation test. (F) Sleep profile of the wild-type males that were trained for 1 hr with mated females (red, n = 16) and naïve males (black, n = 16). Sleep time was plotted in 30 min bins. (G) CIs of the wild-type or dopR1 mutant males during 6 hr training in single pair assay w a mated female. P value is for Ho CIwild-type = CIDopR1; ***p<0.001. Mann-Whitney-Wilcoxon test. (H) SIs of the wild-type or dopR1 mutant males tested 24 hr after training for 6 hr with mated females. P value is for Ho SI = 0; ***p<0.001, ns p>0.05. Permutation test.
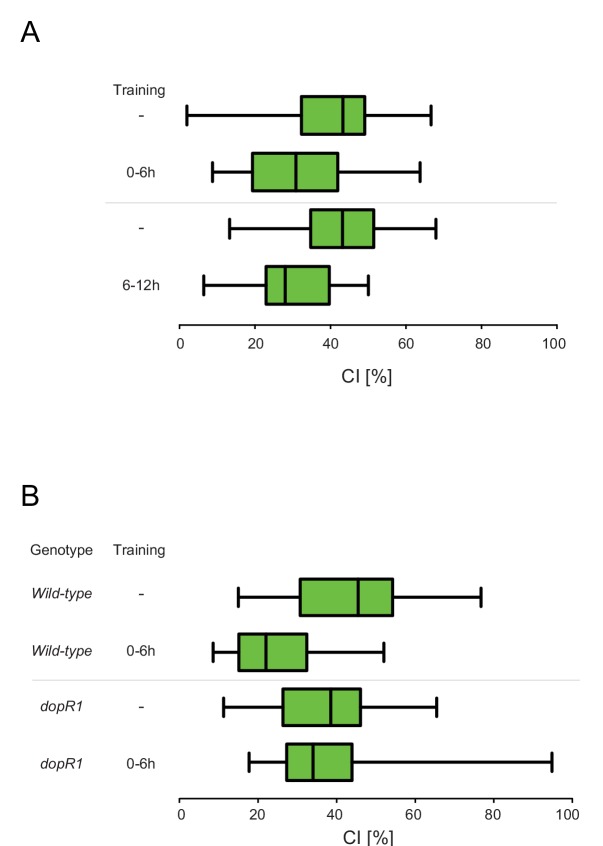
Figure 1—figure supplement 2. Courtship Indices (CIs) of males that had undrgone treatment according to Figure 1—figure supplement 1E and H.

Figure 1—figure supplement 2.

(A) Courtship indices (CIs) of the wild-type males trained in single pair assays with a mated female as indicated in Figure 1—figure supplement 1E and Table S1. (B) Courtship indices (CIs) of males of the indicated genotypes trained in single pair assays with a mated female as indicated in Figure 1—figure supplement 1H and Table S3.