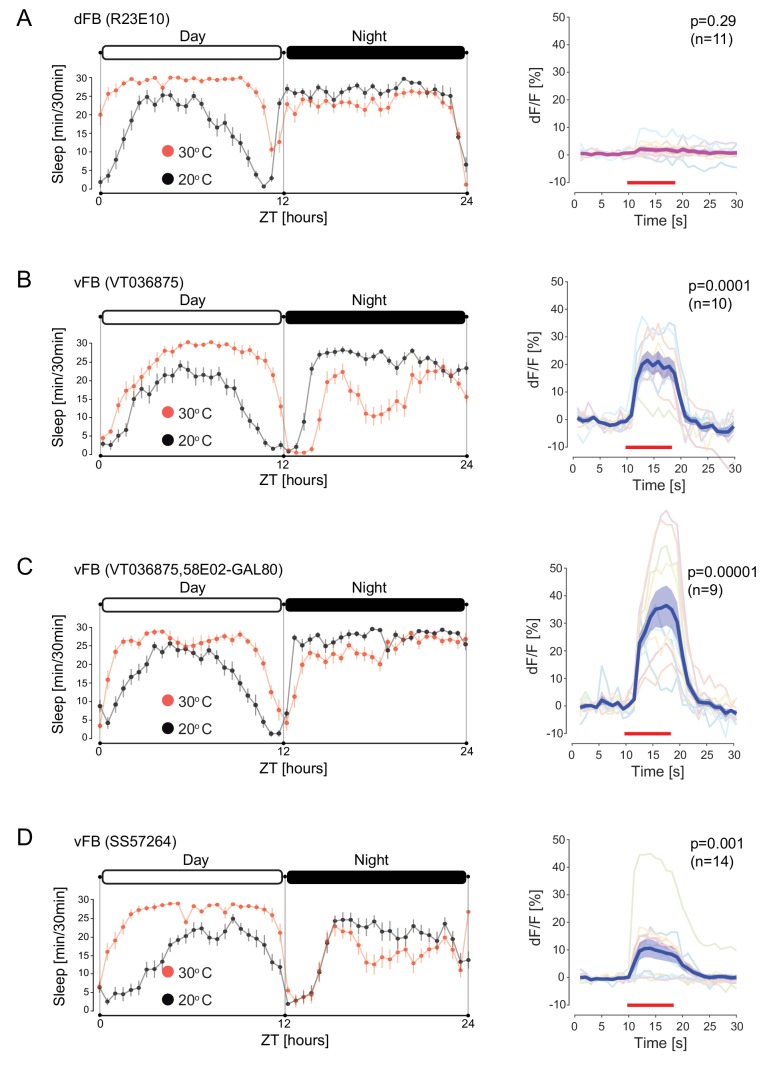
Figure 4. Sleep promoting vFB neurons activate DAN-aSP13.
(A) (left) Sleep profile of males (R23E10-GAL4 > UAS-TrpA1) upon activation of dFB neurons (red, n = 16) and control males with dFB neurons not activated (black, n = 16). Sleep time was plotted in 30 min bins. White and black areas indicate 12 hr light and dark periods, respectively. (right) Normalized calcium levels (dF/F) in DAN-aSP13 upon activation of dFB (R23E10-GAL4 > UAS-Chrimson88, R58E02-LexA > LexAop-GCamP6s). DAN-aSP13 activity in individual flies is shown in colored thin lines, and the mean trace is shown in thick magenta line with SEM indicated by shaded area. (B) (left) Sleep profile of males (VT03687-GAL4 > UAS-TrpA1) upon activation of vFB neurons (red, n = 16) and control males with vFB neurons not activated (black, n = 16). Sleep time was plotted in 30 min bins. White and black areas indicate 12 hr light and dark periods, respectively. (right) Normalized calcium levels (dF/F) in DAN-aSP13 upon activation of vFB (VT036875-GAL4 > UAS-Chrimson88, R58E02-LexA > LexAop-GCamP6s). DAN-aSP13 activity in individual flies is shown in colored thin lines, and the mean trace is shown in thick blue line with SEM indicated by shaded area. (C) (left) Sleep profile of males (VT036875-GAL4 > UAS-TrpA1, R58E02-GAL80) upon activation of vFB neurons (red, n = 16) and control males with vFB neurons not activated (black, n = 16). Sleep time was plotted in 30 min bins. White and black areas indicate 12 hr light and dark periods, respectively. (right) Normalized calcium levels (dF/F) in DAN-aSP13 upon activation of vFB (VT036875-GAL4 > UAS-Chrimson88, R58E02-GAL80, R58E02-LexA > LexAop-GCamP6s). DAN-aSP13 activity in individual flies is shown in colored thin lines, and the mean trace is shown in thick blue line with SEM indicated by shaded area. (D) (left) Sleep profile of (SS57264-GAL4 > UAS-TrpA1) males upon activation of vFB neurons (red, n = 16) and control males with vFB neurons not activated (black, n = 16). Sleep time was plotted in 30 min bins. White and black areas indicate 12 hr light and dark periods, respectively. (right) Normalized calcium levels (dF/F) in DAN-aSP13 upon activation of vFB (SS57264-GAL4 > UAS-Chrimson88, R58E02-LexA > LexAop-GCamP6s). DAN-aSP13 activity in individual flies is shown in colored thin lines, and the mean trace is shown in thick blue line with SEM indicated by shaded area. (A–D) (right panels) Red line indicates the time window of the light stimulus. P value represents the probability that the mean dF/F of pre-stimulation (10 s) and the mean dF/F during stimulation has the same median across flies (tested by Wilcoxon rank sum test, sample size indicated with n value).


