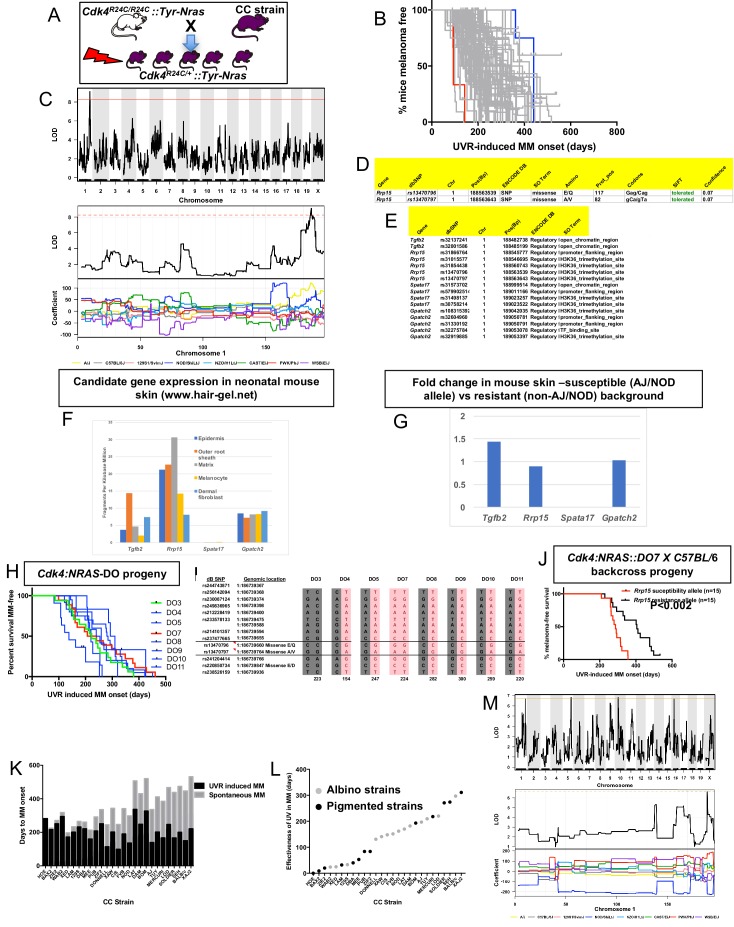
Figure 3. Mapping genes for UVR-induced melanoma.
(A) Schematic representation of breeding protocol to generate mice CC progeny. Pups were exposed to a single UVR exposure at post-natal day 3. (B) Kaplan-Meier MM free survival curve showing age of onset on MM for all 38 strains. Strain in red shows the fastest age of onset. There are two data points (four mice) for this strain cohort, but each onset value represents two mice that developed MM at the same time. Blue shows slowest median age of onset. (C) Top panel shows genome-wide scan based on neonatal UVR-induced MM age of onset in 70 CC strains. The average age of melanoma onset per strain was based upon onset for at least five mice for every strain. Significance of differences between groups calculated using the Log rank (Mantel Cox) test. Genotyping, construction of CC strain haplotypes, and linkage analysis was performed as described in Ram and Morahan (2017). The x-axis shows the chromosomal position and the y-axis shows the 2log10(P) values; the P-values were derived from the linkage haplotype data. Bottom panel shows plot of LOD scores along chromosome 1, with plot of the calculated log-odds ratio of eight founder alleles over the chromosome where the founders are colour-coded. (D) Genes within the −1 -Log10(P) interval carrying putative protein changing mutations. (E) Genes containing potentially regulatory intronic, 5’or 3’ UTR variants. (F) Expression level of genes in the HAIR-GEL skin gene expression database (28). Y axis denotes FPKM (Fragments Per Kilobase Million). (G) Gene expression fold changes in mouse skin from susceptible (AJ, NOD, FVB) compared to resistant (C57BL/6, 129S) strains. Based on gene expression values from RNA sequencing of the skin. (H) Kaplan-Meier curve for UVR-induced MM free survival for Cdk4::NRAS::DO progeny for each of 8 DO strains. Red = homozygous for the AJ/NOD susceptibility allele at the Rrp15 locus, blue-heterozygous, and green strains do not carry the allele. (I), Haplotypes for the parental DO mice at the Rrp15 locus used to predict progeny genotype in Figure 3H. Pink boxes with re text = Rrp15 susceptibility allele. Dark boxes denote the Rrp15 resistance allele. (J) Kaplan-Meier curve for UVR-induced MM age of onset for Cdk4::NRAS::DO7 progeny after two backcrosses onto C57BL/6. P-value calculated using the Log Rank test. (K) Plot depicting relationship between average age of onset spontaneous and UVR-induced MM for a subgroup of CC strains. (L) Plot depicting ‘effectiveness’ of UVR in exacerbating melanoma (spontaneous minus UVR-induced MM) onset from each strain. Grey dots - albino strains, black dots - pigmented strains. (M) Top panel shows genome-wide scan based on neonatal UVR ‘effectiveness’ in inducing MM. Bottom panel shows plot of LOD scores along chromosome 1, with plot of the calculated log-odds ratio of eight founder alleles over the chromosome where the founders are colour-coded. The brown line denotes ‘suggested’ linkage (FDR < 0.01), whereas an FDR < 0.001 is defined as significant linkage.

