
Figure 4.
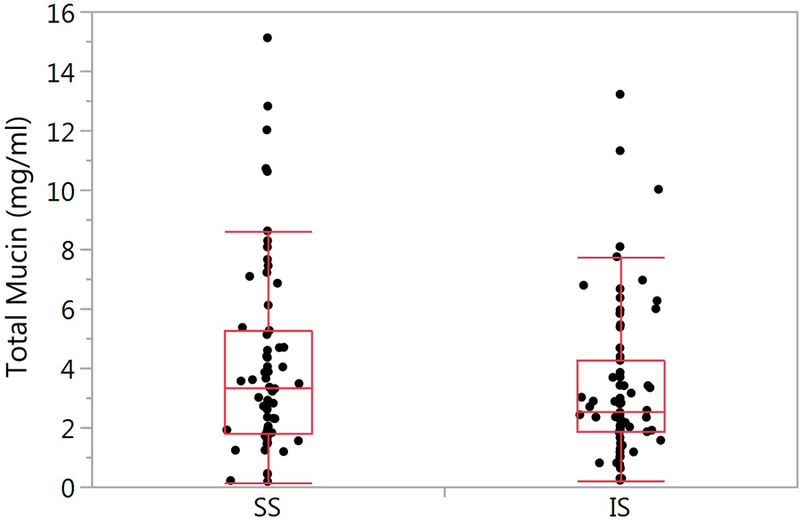
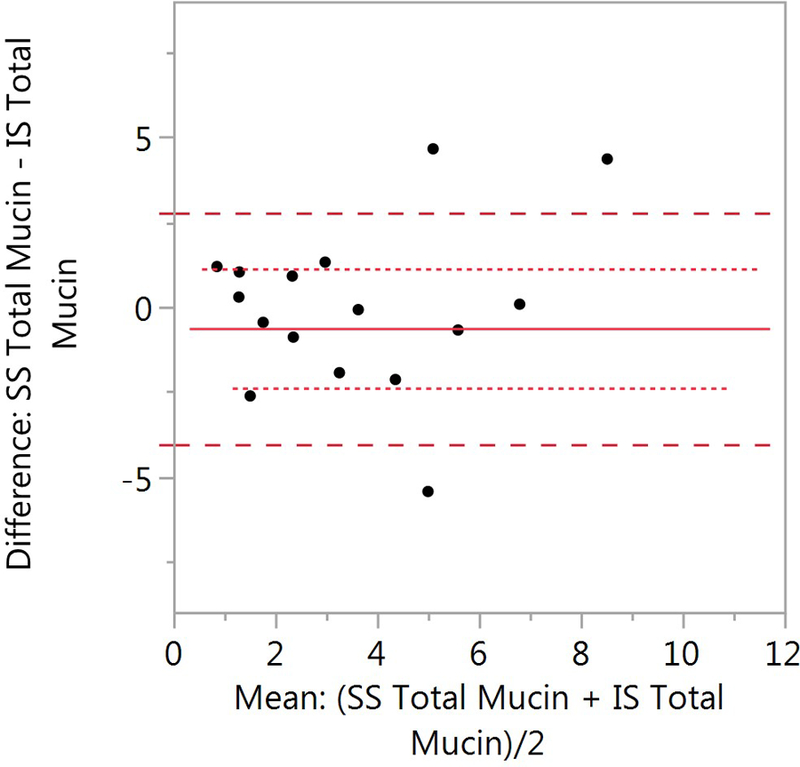
Comparison of SS and IS total mucin. A) SS mean ± SD is 4.15 ± 3.23 (n=62) and 3.34 ± 2.55 (n=71, p=0.371). B) Bland-Altman plot of paired samples collected on the same visit. The SS mean ± SD is 4.13 ± 3.02 and 4.01 ± 2.76 for the IS samples (p=0.898; n=18). The red solid line is the mean SS-IS difference, the red dotted line ± SE and the red dashed line ± SD.