

Abstract
The Hick-Hyman Law states that choice response time (RT) increases linearly with increasing information uncertainty. Neuroimaging studies suggest that the representation of uncertainty in support of response generation is mediated by the cognitive control network (CCN), which is disrupted in Alzheimer’s disease (AD). Thus, we predicted that patients with AD would be sensitive to increased uncertainty particularly under conditions which place demands on the internal representation of uncertainty, and that choice RT performance under these conditions would be associated with performance on tests of executive function. Cognitively normal older adults (CN) and patients with AD completed card-sorting tasks that separately manipulated either externally cued uncertainty (i.e., number of sorting piles with a fixed probability of each stimulus type) or more internally driven uncertainty (i.e., the probability of each stimulus type with a fixed number of sorting piles). Consistent with our predictions, AD patients were impaired relative to CN particularly on the internally driven uncertainty task, and RT in this task was associated with performance on neuropsychological measures of executive functioning but not episodic memory. We suggest that this pattern of findings is consistent with presumed disruptions to the CCN in AD and provides neuropsychological evidence in support of the role of the CCN in the representation of uncertainty.
Keywords: cognition, dementia, choice reaction time, uncertainty, executive function
The time it takes a person to make a response in a choice response time (RT) task increases with increasing uncertainty regarding either the stimulus that will be presented or the response that will be required (Fitts & Biederman, 1965; Keele, 1970; Morin, Forrin, & Archer, 1961; Pollack, 1963; Rabbitt, 1968; Wifall et al., 2016). This relationship was formalized within the mathematical framework of Information Theory (IT; Shannon, 1948; Shannon & Weaver, 1949), based on a classic series of experiments that demonstrated a linear increase in RT with an increase in information uncertainty produced by increasing the number of stimulus-response alternatives (Hick, 1952; Hyman, 1953). Within this framework, information is defined as that which removes or reduces uncertainty. The average amount of uncertainty (H) in a choice RT task can then be computed as , where p(i) refers to the probability of each of the alternative choices. The existence of a linear relationship between the amount of uncertainty (measured in bits) and choice RT has been replicated in numerous independent studies (Crossman, 1953; Welford, 1984; Rabbitt, 1968; Sleimen-Malkoun, Temprado, & Berton, 2013; Wifall et al., 2016) and is now known as the Hick/Hyman Law, one of the few laws in cognitive psychology (see Proctor & Schneider, 2017, for review).
Few studies have examined the neurological substrates underlying the Hick/Hyman Law. Recent neuroimaging findings, however, suggest that the representation and processing of uncertainty in support of response generation is mediated by cognitive control or executive function networks (Fan et al., 2014; Fan, 2014; Wu et al., 2017). Top-down cognitive control processes enable an individual to act adaptively and flexibly, particularly under conditions when bottom-up external cues are not sufficient to support current task-relevant goals (Cole et al., 2013; 2104; Ridderinkhof et al., 2002; Badre, 2008). In particular, the cognitive control network (CCN) comprises a set of cortical regions, including anterior cingulate cortex, the supplementary motor area, dorsolateral prefrontal cortex, anterior insula cortex, frontal eye fields, and the intraparietal sulcus, that consistently co-activate during the performance of tasks that require cognitive control (e.g., target switching, processing task-positive information, target inhibition, etc.; Cole & Schneider, 2007). Fan et al. (2014) found that activation within the CCN varied parametrically with the amount of information uncertainty manipulated within a majority function task in which participants must process an array of visual information and determine the category to which the majority of items belong. Using a choice RT task that more directly assessed the Hick/Hyman Law, Wu et al. (2017) further demonstrated that the CCN was involved in both uncertainty representation and response generation. Taken together, these results suggest that cognitive control processes are critically important for the coordination of responses under uncertainty, particularly under conditions that place greater demands on the internal representation of uncertainty. Despite these neuroimaging findings, however, to our knowledge no neuropsychological studies have specifically investigated whether response generation under uncertainty is associated with executive function ability in patient populations.
While the traditional behavioral hallmark of Alzheimer’s disease (AD) is an impairment of episodic memory, deficits in executive functions also occur early in the course of the disease (Hodges, 2006; Bondi and Salmon, 2009). Consistent with these behavioral findings, there is considerable evidence that the CCN is structurally and functionally disrupted by AD pathology (Agosta et al., 2012; He et al., 2014; Zhou et al., 2010). Functional neuroimaging studies have shown an abnormally high degree of functional connectivity between sub-regions of the CCN in early AD, an effect that is often interpreted as a compensatory mechanism in the face of depleted neural resources elsewhere in the brain (Celone et al., 2006; He et al., 2014; Supekar, Menon, Rubin, Musen, & Greicius, 2008; Wang et al., 2007). As the disease progresses, connectivity between CCN regions declines (Damoiseaux, Prater, Miller, & Greicius, 2012) and accelerated gray matter volume loss occurs in the anterior cingulate cortex (ACC), insular cortex, and parietal cortex (Foundas, Leonard, Mahoney, Agee, & Heilman, 1997; He et al., 2014; Ohnishi, Matsuda, Tabira, Asada, & Uno, 2001; Rombouts, Barkhof, Witter, & Scheltens, 2000).
In light of the structural and functional disruption of the CCN in AD, patients with AD should display deficits in choice RT tasks that are driven primarily by an inability to process uncertainty representation. While it is well established that AD patients are impaired relative to CN on choice RT tasks even when their simple RT is normal (Ferris, Crook, Sathananthan, & Gershon, 1976; Gordon & Carson, 1990; Pirozzolo, Christensen, Ogle, Hansch, & Thompson, 1981), and demonstrate greater choice RT impairment with increasing levels of uncertainty (Mahurin & Pirozzolo, 1993), the underlying source of this choice RT deficit remains undetermined. In particular, it is possible that AD patients display relatively intact choice RT performance under conditions which provide strong external support, but display impaired performance under conditions which place greater demands on the internal representation of uncertainty. Moreover, choice RT performance under high uncertainty conditions may be associated more with the degree of impairment in executive functions that facilitate the mental representation of uncertainty and the generation of appropriate behavioral responses in the choice RT task (Fan, 2014; Hsu, Bhatt, Adolphs, Tranel, & Camerer, 2005; Miller & Cohen, 2001) than with impairments in episodic memory processes that may be involved in the storage of internal representation of uncertainty.
The aims of the present study were threefold. First, we sought to confirm that the behavior of patients with AD and healthy older adults on a choice RT task adheres to the Hick/Hyman Law with a linear relationship between RT and degree of uncertainty. Second, we examined whether or not patients with AD are differentially sensitive, relative to CN, to increasing burden on internal representations of uncertainty in a decision-making task. We hypothesized that AD patients would be sensitive to increased uncertainty particularly under conditions that do not provide strong external support given the role of the CCN in the internal representation of uncertainty (Wu et al., 2017). Third, we examined whether or not choice RT performance associated with the internal representation of uncertainty is correlated with performance on standard neuropsychological tasks, particularly those that assess executive functions and episodic memory. We predicted that performance under conditions of high internal representation of uncertainty would be associated with performance on measures of executive functions.
Method
Participants
Two groups of AD patients and CN participated in this study; 13 AD patients and 12 CN were administered an externally cued task in which uncertainty was manipulated by the number of equally probable stimulus-response alternatives, and 11 AD patients and 14 CN were administered an internally driven task in which uncertainty was manipulated by the relative probability of a constant number of stimulus-response alternatives. All participants were drawn from the University of California San Diego (UCSD) Shiley-Marcos Alzheimer’s Disease Research Center (ADRC) where they underwent annual physical, neurologic, and neuropsychological assessments. A diagnosis of AD was made by a senior staff neurologist according to the criteria developed by the National Institute of Neurological and Communicative Disorders and Stroke (NINCDS) and the Alzheimer’s Disease and Related Disorders Association (ADRDA) (McKhann et al., 1984). A number of laboratory tests were performed to rule out various viral, metabolic, or traumatic causes of dementia. Patients with a history of severe head injury, alcoholism, and serious and prolonged psychiatric illness were excluded. To reduce the possibility of including multi-infarct dementias, patients with a score of 5 or greater on the Hachinski ischemia scale (Hachinski et al., 1975) were excluded from the AD group. CN were cognitively healthy older individuals participating in the UCSD ADRC. Individuals with a history of alcoholism, drug abuse, learning disabilities, or serious neurologic or psychiatric illness were excluded from this study.
Procedure
Neuropsychological Evaluation
A standard battery of neuropsychological tests was administered to each participant as part of the annual evaluation carried out by the UCSD ADRC. Each participant was tested individually by a trained psychometrist in a quiet, well-lit room. The neuropsychological battery included tests of language (Boston Naming Test, Wechsler Adult Intelligence Scale [WAIS-R; Wechsler, 1981] Vocabulary subtest, category fluency for ‘animals’ and ‘vegetables’), visuospatial abilities (WAIS-R Block Design subtest), auditory attention (WAIS-R Digit Span), processing speed (WAIS-R Digit Symbol Modalities subtest, Trail-Making Test A), executive functions (Trail-Making Test B, letter fluency for F, A and S, modified Wisconsin Card Sorting Test, clock-drawing test), and memory (California Verbal Learning Test [Delis, Freeland, Kramer, & Kaplan, 1988], Wechsler Memory Scale [WMS-R; Wechsler, 1984] Visual Reproduction subtest, WMS-R Logical Memory subtests). The Mini-Mental State Exam (MMSE), Blessed Dementia Scale (Blessed, Tomlinson, & Roth, 1968), Dementia Rating Scale (DRS; Mattis, 1988), and Geriatric Depression Scale (GDS; Yesavage et al., 1982) were also administered.
Card Sorting Tasks
Separate externally supported and internally supported uncertainty choice RT tasks used card sorting procedures that employed the same stimulus materials. The stimulus materials consisted of different decks of 7 cm by 10.8 cm laminated cards, with each card having one of five possible shapes (i.e., a square, star, rectangle, circle, or triangle) printed in black ink at the center of each card. The size of the shape was constrained to a height and width of 1.9 cm. Cards were assembled into decks of 60 cards each, with each deck comprised of a different frequency combination of shapes as described below. Participants were instructed to sort each deck into a specified number of response piles corresponding to the shapes on the cards as quickly as possible without making a mistake. Each response pile was labeled by a reference card with a shape corresponding to one of the possible stimulus cues for that condition. Outcome variables included the total time to sort each deck of 60 cards, as well as the total number of errors made while sorting each deck.
Externally Cued Uncertainty Task:
Participants completed four sorting conditions in which the total number of potential response piles varied from two to five; the number of response piles provides external cues regarding the stimulus-response uncertainty within each condition. These four conditions correspond to 1, 1.59, 2, and 2.32 bits of uncertainty (H), respectively, per the following formula:
where n = number of piles
Each sorting condition consisted of two decks of 60 cards. First, participants were presented with a deck of blank cards and instructed to sort them equally into the specified number of response piles by moving from the left-most pile toward the right-most pile, and then returning to the left-most pile to continue sorting. This blank sort served as a control for individual differences in psychomotor speed. The second deck of cards was the test deck, in which participants sorted each card one at a time by matching it to the appropriate response pile corresponding to the shape displayed on each card. Critically, the test deck contained equal probabilities of each stimulus type (e.g., 50% of each shape for the two-pile condition; 33.3% of each shape for the three-pile condition, etc.). RT during the test block was recorded and served as the primary dependent variable. Linear fit between response uncertainty load and RT was calculated for each participant, yielding slopes for group comparison. The order of the sorting conditions (i.e., two, three, four, or five piles) was counterbalanced across participants.
Internally Driven Uncertainty Task:
Participants completed four sorting conditions in which the number of response piles always remained fixed at five piles (corresponding to the five potential shapes), but the relative frequencies (i.e., the probability of occurrence) of each shape varied across sorting conditions. Because the number of response piles remains constant across conditions, there are no external cues regarding uncertainty within each condition; rather, stimulus uncertainty is represented internally based on the frequency of occurrence of each shape. Each of four sorting conditions consisted of two decks of 60 cards each. Within each sorting condition, one shape appeared more frequently than the other four shapes, which appeared with equal probability. The four sorting conditions differed in the probability disparity between the more frequent shape and the other four shapes in the deck. Specifically, the relative frequencies of the shapes in the four sorting conditions were: 1) 93.3% of one shape and 1.67% of the other four shapes; 2) 73.3% of one shape and 6.67% of the other shapes; 3) 46.6% of one shape and 13.3% of the other shapes; and 4) 20% of all five shapes. These four sorting conditions correspond to a stimulus uncertainty of .49, 1.37, 2.06, and 2.32, respectively, per the following formula:
where pi = probability of each of the possible types of trials, and n = number of piles
Participants sorted two decks within each sorting condition; the stimulus composition (i.e., the frequency of each shape) remained the same across the two decks, but the specific sequence of stimuli varied across decks. The first deck was used to give the participants the opportunity to acquire the probability structure of the deck, and the second block was the test block. RT during the test block was the primary dependent variable for this task. Linear fit between stimulus uncertainty load and RT was calculated for each participant, yielding slopes for group comparison. The order of the four sorting conditions was counterbalanced across participants.
Data Analysis
Separate general linear models were created to assess the effects of task (externally cued or internally driven), with RT as the dependent variable, diagnostic group as a between-subjects variable, and uncertainty load (measured in bits) as a within-subjects variable. Group comparisons of slopes of the best linear fit, which reflect information processing efficiency under increasing uncertainty demand, were compared using t-tests. Statistical significance was determined using permutation testing. Group labels were randomly permuted (N = 5000 permutations) to create a null distribution for each statistical model.
Associations between RT and performance on standard neuropsychological tests were examined using Pearson’s correlations. Because the diagnostic groups differ in neuropsychological test performance, separate correlations were performed for CN and AD patients. To minimize the total number of statistical comparisons, composite scores were constructed by summing z-scores of individual tests of memory (CVLT delayed recall, WMS Logical Memory delayed recall, and WMS Visual Reproduction delayed recall) and executive functioning (letter fluency, Trail-Making Test B, WCST perseverative errors). Analyses were performed using IBM SPSS Statistics (Version 25.0) and MATLAB (Release 2017a).
Results
Demographic characteristics are summarized in Table 1. The AD patient group was significantly younger (p’s < .05) than the CN group. The groups did not statistically differ in sex, years of education, or estimated premorbid IQ, though effect sizes for these comparisons ranged from small to medium (Cohen’s d or φ = 0.09–0.55), with AD patients having lower premorbid IQ estimates and a greater proportion of men than CN. As expected, the patients with AD performed significantly worse than CN across all neuropsychological tests. Groups completing the externally cued task did not differ significantly from groups completing the internally driven task on any demographic or neuropsychological variable (Table 1).
Table 1.
Demographic Characteristics
| Within-Condition Differences | Between-Condition Differences | |||||||||||
|---|---|---|---|---|---|---|---|---|---|---|---|---|
| Externally Driven | Internally Driven | CN | AD | |||||||||
| CN (N = 12) | AD (N = 13) | d or φ | t or χ2 | CN (N = 14) | AD (N = 11) | d or φ | t or χ2 | d or φ | t or χ2 | d or φ | t or χ2 | |
| Age (years) | 77.4 (5.6) | 71.6 (7.1) | 0.91 | 2.28* | 76.4 (4.9) | 71.6 (4.6) | 1.01 | 2.50* | 0.19 | 0.48 | 0.00 | 0.01 |
| Sex (M:F) | 3:9 | 8:5 | 0.37 | 3.38 | 4:10 | 6:5 | 0.26 | 1.73 | 0.18 | 0.84 | 0.17 | 0.73 |
| Education (years) | 13.8 (1.9) | 13.5 (3.6) | 0.10 | 0.26 | 13.5 (2.1) | 13.8 (4.0) | 0.09 | 0.26 | 0.14 | 0.42 | 0.08 | 0.18 |
| MMSE | 29.6 (0.7) | 23.0 (3.2) | 2.85 | 6.88*** | 29.3 (1.7) | 21.5 (4.2) | 2.43 | 5.50*** | 0.23 | 0.56 | 0.40 | 0.94 |
| Blessed Dementia Scale | 0.6 (0.7) | 11.3 (4.8) | 3.12 | 7.76*** | 1.2 (1.9) | 11.5 (5.5) | 2.50 | 5.67*** | 0.42 | 1.08 | 0.04 | 0.08 |
| DRS-2 Total | 141.0 (3.3) | 116.9 (13.4) | 2.47 | 6.29*** | 139.3 (6.8) | 111.0 (12.2) | 2.87 | 7.34*** | 0.32 | 0.79 | 0.46 | 1.10 |
| Estimated FSIQ | 119.2 (6.9) | 115.3 (8.8) | 0.49 | 1.21 | 119.2 (5.2) | 115.9 (6.7) | 0.55 | 1.35 | 0.00 | 0.03 | 0.08 | 0.19 |
| Boston Naming Test | 27.8 (1.4) | 23.7 (3.8) | 1.43 | 3.51** | 27.5 (3.5) | 24.0 (5.2) | 0.79 | 1.97* | 0.11 | 0.23 | 0.07 | 0.17 |
| Vocabulary | 58.8 (6.5) | 46.9 (11.1) | 1.31 | 3.17** | 61.1 (5.6) | 54.3 (9.5) | 0.87 | 1.94* | 0.38 | 0.97 | 0.72 | 1.58 |
| Block Design | 44.3 (8.9) | 25.3 (16.9) | 1.41 | 3.47** | 44.1 (10.5) | 21.9 (17.1) | 1.56 | 3.94*** | 0.02 | 0.07 | 0.20 | 0.46 |
| Digit Span | 17.1 (4.6) | 10.8 (4.7) | 1.35 | 3.28** | 16.5 (3.2) | 12.4 (2.9) | 1.34 | 3.06** | 0.15 | 0.38 | 0.41 | 0.91 |
| SDMT | 44.3 (7.0) | 27.0 (13.4) | 1.62 | 3.94** | 42.8 (8.8) | 19.1 (14.3) | 2.00 | 4.42*** | 0.19 | 0.49 | 0.57 | 1.27 |
| Trails A (sec) | 39.1 (10.2) | 67.0 (34.3) | 1.10 | 2.60* | 46.5 (21.8) | 82.1 (40.4) | 1.10 | 2.68* | 0.43 | 1.08 | 0.40 | 0.91 |
| Trails B (sec) | 95.4 (27.7) | 201.2 (84.1) | 1.69 | 3.81** | 114.1 (61.6) | 237.5 (73.3) | 1.82 | 4.15*** | 0.39 | 0.96 | 0.46 | 0.96 |
| Letter Fluency | 49.3 (12.4) | 26.6 (15.0) | 1.65 | 4.03*** | 48.4 (17.5) | 23.6 (11.5) | 1.67 | 3.90*** | 0.06 | 0.15 | 0.22 | 0.51 |
| Category Fluency | 47.6 (6.3) | 27.2 (6.8) | 3.11 | 7.60*** | 47.1 (12.2) | 21.0 (10.9) | 2.26 | 5.42*** | 0.05 | 0.11 | 0.68 | 1.63 |
| WCST | 5.8 (0.4) | 2.7 (2.1) | 2.05 | 4.72*** | 5.6 (0.8) | 2.1 (2.5) | 1.89 | 4.29*** | 0.32 | 0.72 | 0.26 | 0.62 |
| CVLT Total Learning | 54.2 (9.7) | 21.4 (9.0) | 3.51 | 8.36*** | 53.1 (15.4) | 17.6 (5.5) | 3.07 | 7.91*** | 0.09 | 0.20 | 0.51 | 1.11 |
| CVLT Delayed Recall | 12.8 (2.4) | 1.4 (2.6) | 4.56 | 10.95*** | 11.2 (4.3) | 0.4 (0.9) | 3.48 | 9.11*** | 0.46 | 1.16 | 0.51 | 1.00 |
| WMS VR I | 14.4 (2.5) | 5.6 (2.1) | 3.81 | 9.13*** | 16.0 (2.9) | 6.8 (3.7) | 2.77 | 6.60*** | 0.59 | 1.46 | 0.4 | 0.88 |
| WMS VR II | 12.7 (4.4) | 1.1 (1.9) | 3.42 | 8.37*** | 12.3 (3.1) | 0.4 (1.0) | 5.17 | 12.68*** | 0.11 | 0.24 | 0.46 | 0.92 |
| WMS LM I | 29.8 (5.8) | 8.2 (6.3) | 3.57 | 8.63*** | 27.4 (7.7) | 7.7 (4.4) | 3.14 | 7.79*** | 0.35 | 0.89 | 0.09 | 0.21 |
| WMS LM II | 27.0 (7.0) | 2.9 (5.5) | 3.83 | 9.10*** | 23.7 (10.1) | 1.0 (2.3) | 3.10 | 8.07*** | 0.38 | 0.95 | 0.45 | 0.96 |
Note. Values represent M(SD). Between-condition differences represent differences in demographic characteristics among participants in the externally driven versus internally driven condition. AD = Alzheimer’s Disease; CN = cognitively normal; MMSE = Mini-Mental Status Examination; DRS = Dementia Rating Scale; FSIQ = full scale intelligence quotient; SDMT = Symbol Digit Modalities Test; WCST = Wisconsin Card Sorting Test; CVLT = California Verbal Learning Test; WMS = Wechsler Memory Scale; VR = Visual Reproduction; LM = Logical Memory.
p < .05,
p < .01,
p < .001
Both CN and AD patients had high accuracy in both the externally cued and internally driven tasks (97.9% to 99.9% accuracy across conditions). Group differences in RTs under increasing uncertainty burden are presented in Table 2. As predicted, patients with AD performed significantly more slowly than CN in both the externally cued and internally driven tasks. To eliminate RT ceiling effects at the lowest uncertainty levels and to keep uncertainty loads roughly equivalent across externally cued and internally driven tasks, data from the three highest uncertainty loads for each task were retained (i.e., 3, 4, and 5 piles in the externally cued task, corresponding to 1.59, 2, and 2.32 bits; 73.3%, 46.6%, and 13.3% frequencies for the most frequent shape in the internally driven task, corresponding to 1.37, 2.06, and 2.32 bits).
Table 2.
Group Differences in RT under Increasing Uncertainty Load.
| Block 1 (Practice) | Block 2 (Test) | |||||
|---|---|---|---|---|---|---|
| CN | AD | t | CN | AD | t | |
| Externally Cued Task | ||||||
| 1.00 bits | 38.9 (6.2) | 57.1 (29.6) | 2.09 | 44.3 (5.8) | 73.8 (36.0) | 3.03** |
| 1.59 bits | 41.1 (8.5) | 70.2 (36.4) | 2.70* | 49.9 (6.9) | 95.4 (53.8) | 2.92* |
| 2.00 bits | 39.7 (8.5) | 71.0 (36.4) | 2.81* | 53.8 (5.5) | 102.9 (50.8) | 3.33** |
| 2.32 bits | 39.7 (8.7) | 67.8 (26.6) | 3.49** | 68.2 (17.7) | 122.3 (65.3) | 2.79* |
| Internally Cued Task | ||||||
| 0.49 bits | 47.2 (7.4) | 62.0 (26.8) | 1.91 | 44.6 (7.3) | 57.6 (21.3) | 2.07 |
| 1.37 bits | 53.3 (12.2) | 53.5 (17.4) | 1.88 | 50.3 (9.7) | 61.6 (15.8) | 2.15* |
| 2.06 bits | 57.8 (7.6) | 76.4 (14.7) | 4.02*** | 54.3 (6.1) | 72.7 (13.9) | 4.34*** |
| 2.32 bits | 59.0 (7.7) | 79.2 (26.6) | 2.62* | 56.8 (6.1) | 77.7 (24.3) | 3.00** |
Note. Values represent M(SD). In the externally cued task condition, Block 1 consisted of a blank deck of cards sorted into the specified number of piles; this served as a control for psychomotor speed. CN = cognitively normal; AD = Alzheimer’s Disease.
p < .05,
p < .01,
p < .001
Externally Cued Uncertainty Task
RT when sorting blank cards into differing numbers of piles served as a control for psychomotor speed in the externally cued condition. There was a significant main effect of group on RT, F(1, 24) = 11.14, p < .001, = .32, with AD patients responding more slowly than CN (see Table 2). However, the main effect of load was not significant, (p = .77, = .02) nor was the group x uncertainty load interaction (p = .84, = .01). Thus, psychomotor speed did not significantly change as a function of increasing uncertainty burden.
There was a significant main effect of degree of uncertainty (i.e., uncertainty load) in the externally cued task, F(2, 23) = 28.80, p < .001, = .72, with RT increasing linearly with increasing uncertainty (Figure 1A). Patients with AD were, in general, significantly slower to respond than CN, F(1, 24) = 10.83, p < .001, = .31, but the group x uncertainty load interaction was not significant (p = .39, = .10). Slopes of the linear fit between uncertainty and RT did not significantly differ between CN and AD patients, t(24) = 1.38, p = .18, = .39. The best linear fit for each group yielded a slope of 24.3 for CN and 35.9 for patients with AD, indicating that each bit of uncertainty in the externally cued task was associated with 405 ms (24.3 sec/60 trials) or 598 ms (35.9 sec/60 trials) increase in RT per trial, respectively.
Figure 1.
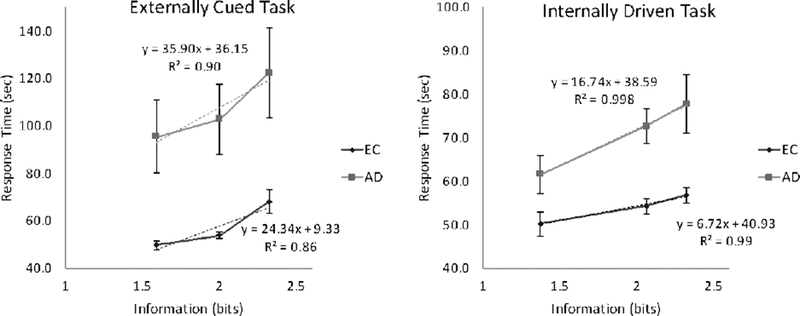
Groups do not differ in sensitivity to uncertainty in the externally cued task, but patients with Alzheimer’s disease (AD) show greater slowing than cognitively normal older adults (CN) as uncertainty increases in the internally driven task.
Internally Driven Uncertainty Task
There was a significant main effect of uncertainty load in the internally driven task, F(2, 22) = 26.05, p < .001, = .70, with RT increasing linearly with increasing uncertainty load (Figure 1B). Patients with AD were, in general, slower to respond than CN, F(1, 23) = 9.87, p = .002, = .30. In addition, there was a significant group x uncertainty load interaction effect, F(2, 22) = 4.95, p = .019, = .31. When examining slopes of the linear fit between uncertainty and RT, patients with AD had significantly steeper slopes than CN, t(23) = 2.97, p = .006, d = 1.19, indicating that they were less efficient to respond under higher uncertainty loads. Overall, each bit of uncertainty in the internally driven task was associated with a 112 ms per trial increase in RT for CN (6.7 sec/60 trials) and 279 ms for patients with AD (16.7 sec/60 trials).
Relationship between Uncertainty and Neuropsychological Measures
Pearson’s correlations were performed to assess associations between neuropsychological composite scores and RT under the highest and lowest uncertainty loads within each task. Analyses were restricted to the neuropsychological domains of memory and executive functioning to test the hypothesis that poorer choice RT in the internally-driven uncertainty task is associated with degree of impairment in executive functions, rather than impaired memory storage of the internal representation of uncertainty. Separate correlation analyses were run for each group to avoid group status (with AD patients performing worse on neuropsychological tests as well as having longer RTs) from confounding results. Results are summarized in Table 3. For the internally driven task, higher RTs under high and low uncertainty load were significantly associated with poorer executive functioning among CN and AD patients. There were no significant associations between RT and memory. For the externally cued task, higher RTs under high uncertainty load were significantly associated with poorer memory performance in CN. There were no significant associations between RTs and executive functions for either group.
Table 3.
Correlations between RT under Increasing Uncertainty Load and Neuropsychological Test Performance
| Externally Cued | Internally Cued | |||
|---|---|---|---|---|
| Low Load | High Load | Low Load | High Load | |
| Memory | ||||
| CN | −0.24 | −0.66* | −0.08 | 0.13 |
| AD | −0.44 | −0.30 | −0.33 | −0.29 |
| Executive Functioning | ||||
| CN | −0.39 | −0.36 | −0.67* | −0.65* |
| AD | −0.09 | −0.09 | −0.66* | −0.62† |
Note. Values reflect Pearson’s r. CN = cognitively normal; AD = Alzheimer’s disease
p < .1
p < .05,
p < .01,
p < .001
Discussion
The current study used a card sorting paradigm to assess the effects of uncertainty on choice RT within the context of healthy and pathological aging and to characterize neuropsychological correlates of internal versus external representations of uncertainty. The results showed that CN participants and patients with AD both demonstrated highly significant linear increases in RT as uncertainty increased in both the externally cued task and the internally driven task, with the linear regression models in each case having an R2 of .90 or greater. Thus, the behavior of both groups conformed to the Hick/Hyman Law. These results are consistent with several previous studies that have reported linear relationships between information uncertainty and RT in healthy older adults (Sleimen-Malkoun, Temprado, & Berton, 2013; Welford, 1984) and in patients with AD (Mahurin & Pirozzolo, 1993). Our results extend these findings by demonstrating that the relationship holds for both groups regardless of whether uncertainty is increased through the manipulation of external cues (i.e., the number of equally probable sorting piles) or internal representations (i.e., the relative probability of a fixed number of sorting piles).
A second finding from this study is that increased uncertainty led to significantly larger increases in choice RT (i.e., steeper slopes) in AD patients compared to CN participants in the internally driven task but not in the externally cued task. The significantly decreased information processing efficiency displayed by AD patients in the internally driven task but not the externally cued task does not appear to be due simply to differences in difficulty across the two tasks, since: a) accuracy was equivalent in the two tasks; and b) RT in the internally driven uncertainty task was equivalent to RT in the comparable five-choice condition of the externally cued uncertainty task. Indeed, slopes were larger for both AD patients and CN participants in the externally cued task, consistent with a greater contribution of response uncertainty (present in the externally cued task but not the internally driven task) to choice RT slope under the Hick/Hyman Law (Wifall et al., 2016). Taken together, these results suggest that AD patients’ choice RT impairments may be attributable primarily to a deficiency of the processing of internal representations of uncertainty.
Our third finding is that RT performance during the processing of internal representation of uncertainty was significantly associated with performance on standard neuropsychological tests of executive function but not episodic memory. That is, more efficient responding under either high or low stimulus uncertainty conditions (i.e., shorter RTs) was associated specifically with better executive function for both CN and AD patients. This suggests that AD patients’ choice RT impairments in the internally cued condition are not due to a deficit in episodic memory for the probability structure of the stimulus deck. Rather, efficient performance in the internally driven condition appears to require cognitive control processes to facilitate the mental representations of and coordinate responses to uncertainty. This provides neuropsychological support for the neuroimaging findings that the CCN plays an important role in processing uncertainty (e.g., Wu et al., 2017). Neuropsychological and neuroimaging studies have previously shown that performance on executive function tasks (including the verbal fluency, Trail-Making Test B, and the modified WCST used in the current study) is associated with structural change or abnormal activation of brain regions that comprise the CCN (Baldo & Shimamura, 1998; Birn et al., 2010; Hsieh et al., 2010; Moll, de Oliveira-Souza, Moll, Bramati, & Andreiuolo, 2002; Seeley et al., 2007; Shibuya-Tayoshi et al., 2007; Wager, Jonides, & Reading, 2004). Thus, the observed associations between performances on the executive function and internally cued choice RT tasks suggests that the ability to respond efficiently under conditions which place high demands on the internal representation of uncertainty requires the recruitment of executive resources governed by the CCN. The same top-down executive control processes do not appear to be as critical for coordinating action under conditions in which bottom-up external visual cues provide information regarding stimulus-response uncertainty. Consistent with this notion, RT performance on the externally cued task was found to be significantly associated with episodic memory rather than executive function.
Taken together, the present results are consistent with the hypothesis that the choice RT deficits displayed by patients with AD are driven primarily by an inability to process uncertainty due to disruption of the CCN. Several studies have reported that AD patients have altered functional connectivity of the frontoparietal and salience networks (Agosta et al., 2012; He et al., 2014; Zhou et al., 2010), which are subcomponents of the CCN, as well as greater gray matter volume loss in CCN subregions (Foundas et al., 1997; He et al., 2014; Ohnishi et al., 2001; Rombouts et al., 2000). Thus, processes mediated by the CCN would be expected to be differentially impaired in patients with AD. Emerging evidence suggests that representations of uncertainty is one such process that is mediated by the CCN. For example, Wu and colleagues (Wu et al., 2017) demonstrated that the CCN is activated in healthy adults during tasks that require processing the relationship between representations of uncertainty and the generation of an appropriate response. The anterior cingulate cortex, a critical sub-region of the CCN, may be particularly important for processing uncertainty given that it is more highly activated during decision-making tasks with random (i.e., high uncertainty) than fixed sequences of stimuli to which the subject must respond (Koechlin, Corrado, Pietrini, & Grafman, 2000). Although the entire CCN activates as a function of information uncertainty, the anterior cingulate cortex and anterior insula show particularly strong activation when switching between anticipation of a stimulus and generation of a target response (Fan et al., 2014). This disparity may underlie the specificity of the impact of AD on the relationship between uncertainty and RT observed in our study.
Limitations
The present study has substantial methodological weaknesses, and results should be considered with these limitations in mind. First, the sample sizes for each condition were modest, which limited statistical power. It is possible that a better powered study may have detected group differences in the externally cued condition as well as the internally cued condition. Second, the between-subjects design made it challenging to make meaningful comparisons between performance on the externally versus internally cued tasks. Although between-task differences in demographic and clinical characteristics did not reach statistical significance, examination of effect sizes of these comparisons suggests that the groups differed in several critical ways. Most notably, AD patients in the internally driven condition performed worse on measures of clinical disease severity (e.g., MMSE, Blessed Dementia Scale, DRS-2) than AD patients in the externally driven condition. These comparisons had medium effect sizes (Cohen’s d = 0.09–0.46). Thus, participant characteristics could have magnified group differences in the internally cued task compared to the externally cued task. The between-subjects design also makes it impossible to determine intra-individual patterns of performance on these tasks. Replicating these findings in a study with a within-subjects design would provide the strongest test of our hypothesis that AD differentially affects internal representations of uncertainty due to disruption of the CCN. Finally, the patient group consisted of individuals with mild to moderate dementia. Investigating choice uncertainty performance in MCI patients or individuals with preclinical AD is needed to establish this measure as a possible cognitive marker of AD. Given these significant weaknesses in study design, results should be interpreted with caution. Replication of these findings in an independent sample with a within-subjects design is warranted.
In summary, we report that the behavior of both CN and AD patients conformed to the Hick/Hyman Law, with a positive linear relationship between RT and uncertainty load. Despite congruent performance in an externally cued condition, AD patients were significantly less efficient than CN to respond in a condition requiring internal representations of uncertainty. Performance in the internally driven task was associated with neuropsychological tests of executive functioning, consistent with the putative role of the CCN in mediating internal representations of uncertainty. Collectively, these findings provide neuropsychological evidence supporting the role of the CCN in representing of uncertainty, a process disrupted in AD.
Acknowledgments
We thank the participants and staff of the Shiley-Marcos Alzheimer’s Disease Research Center at the University of California, San Diego. This study was supported by NIH grant AG05131 and the Helen A. Jarrett Chair for Alzheimer’s Disease Research.
References
- Agosta F, Pievani M, Geroldi C, Copetti M, Frisoni GB, & Filippi M (2012). Resting state fMRI in Alzheimer’s disease: beyond the default mode network. Neurobiol Aging, 33(8), 1564–1578. doi: 10.1016/j.neurobiolaging.2011.06.007 [DOI] [PubMed] [Google Scholar]
- Baldo JV, & Shimamura AP (1998). Letter and category fluency in patients with frontal lobe lesions. Neuropsychology, 12(2), 259–267. [DOI] [PubMed] [Google Scholar]
- Birn RM, Kenworthy L, Case L, Caravella R, Jones TB, Bandettini PA, & Martin A (2010). Neural systems supporting lexical search guided by letter and semantic category cues: a self-paced overt response fMRI study of verbal fluency. Neuroimage, 49(1), 1099–1107. doi: 10.1016/j.neuroimage.2009.07.036 [DOI] [PMC free article] [PubMed] [Google Scholar]
- Blessed G, Tomlinson BE, & Roth M (1968). The association between quantitative measures of dementia and of senile change in the cerebral grey matter of elderly subjects. Br J Psychiatry, 114(512), 797–811. [DOI] [PubMed] [Google Scholar]
- Celone KA, Calhoun VD, Dickerson BC, Atri A, Chua EF, Miller SL, … Sperling RA (2006). Alterations in memory networks in mild cognitive impairment and Alzheimer’s disease: an independent component analysis. J Neurosci, 26(40), 10222–10231. doi: 10.1523/JNEUROSCI.2250-06.2006 [DOI] [PMC free article] [PubMed] [Google Scholar]
- Cole MW, & Schneider W (2007). The cognitive control network: Integrated cortical regions with dissociable functions. Neuroimage, 37(1), 343–360. doi: 10.1016/j.neuroimage.2007.03.071 [DOI] [PubMed] [Google Scholar]
- Crossman E (1953). Entropy and choice time: The effect of frequency unbalance on choice-response. Quarterly Journal of Experimental Psychology, 5, 41–51. [Google Scholar]
- Damoiseaux JS, Prater KE, Miller BL, & Greicius MD (2012). Functional connectivity tracks clinical deterioration in Alzheimer’s disease. Neurobiol Aging, 33(4), 828.e819–830. doi: 10.1016/j.neurobiolaging.2011.06.024 [DOI] [PMC free article] [PubMed] [Google Scholar]
- Delis DC, Freeland J, Kramer JH, & Kaplan E (1988). Integrating clinical assessment with cognitive neuroscience: construct validation of the California Verbal Learning Test. J Consult Clin Psychol, 56(1), 123–130. [DOI] [PubMed] [Google Scholar]
- Fan J (2014). An information theory account of cognitive control. Front Hum Neurosci, 8, 680. doi: 10.3389/fnhum.2014.00680 [DOI] [PMC free article] [PubMed] [Google Scholar]
- Fan J, Van Dam NT, Gu X, Liu X, Wang H, Tang CY, & Hof PR (2014). Quantitative characterization of functional anatomical contributions to cognitive control under uncertainty. J Cogn Neurosci, 26(7), 1490–1506. doi: 10.1162/jocn_a_00554 [DOI] [PMC free article] [PubMed] [Google Scholar]
- Ferris S, Crook T, Sathananthan G, & Gershon S (1976). Reaction time as a diagnostic measure in senility. J Am Geriatr Soc, 24(12), 529–533. [DOI] [PubMed] [Google Scholar]
- Fitts PM, & Biederman I (1965). S-R compatibility and information reduction. J Exp Psychol, 69, 408–412. [DOI] [PubMed] [Google Scholar]
- Foundas AL, Leonard CM, Mahoney SM, Agee OF, & Heilman KM (1997). Atrophy of the hippocampus, parietal cortex, and insula in Alzheimer’s disease: a volumetric magnetic resonance imaging study. Neuropsychiatry Neuropsychol Behav Neurol, 10(2), 81–89. [PubMed] [Google Scholar]
- Gordon B, & Carson K (1990). The basis for choice reaction time slowing in Alzheimer’s disease. Brain Cogn, 13(2), 148–166. [DOI] [PubMed] [Google Scholar]
- Greenwood PM, Lambert C, Sunderland T, & Parasuraman R (2005). Effects of apolipoprotein E genotype on spatial attention, working memory, and their interaction in healthy, middle-aged adults: results From the National Institute of Mental Health’s BIOCARD study. Neuropsychology, 19(2), 199–211. doi: 10.1037/0894-4105.19.2.199 [DOI] [PMC free article] [PubMed] [Google Scholar]
- He X, Qin W, Liu Y, Zhang X, Duan Y, Song J, … Yu C (2014). Abnormal salience network in normal aging and in amnestic mild cognitive impairment and Alzheimer’s disease. Hum Brain Mapp, 35(7), 3446–3464. doi: 10.1002/hbm.22414 [DOI] [PMC free article] [PubMed] [Google Scholar]
- Hick WE (1952). On the rate of gain of information. Quarterly Journal of Experimental Psychology, 4(1), 11–26. [Google Scholar]
- Hsieh PC, Yeh TL, Lee IH, Huang HC, Chen PS, Yang YK, … Liao MH (2010). Correlation between errors on the Wisconsin Card Sorting Test and the availability of striatal dopamine transporters in healthy volunteers. J Psychiatry Neurosci, 35(2), 90–94. [DOI] [PMC free article] [PubMed] [Google Scholar]
- Hsu M, Bhatt M, Adolphs R, Tranel D, & Camerer CF (2005). Neural systems responding to degrees of uncertainty in human decision-making. Science, 310(5754), 1680–1683. doi: 10.1126/science.1115327 [DOI] [PubMed] [Google Scholar]
- Keele SW (1970). Effects of input and output on decision time. Journal of Experimental Psychology, 85(2), 157. [Google Scholar]
- Koechlin E, Corrado G, Pietrini P, & Grafman J (2000). Dissociating the role of the medial and lateral anterior prefrontal cortex in human planning. Proc Natl Acad Sci U S A, 97(13), 7651–7656. doi: 10.1073/pnas.130177397 [DOI] [PMC free article] [PubMed] [Google Scholar]
- Lowndes G, & Savage G (2007). Early detection of memory impairment in Alzheimer’s disease: a neurocognitive perspective on assessment. Neuropsychol Rev, 17(3), 193–202. doi: 10.1007/s11065-007-9032-z [DOI] [PubMed] [Google Scholar]
- Mahurin RK, & Pirozzolo FJ (1993). Application of Hick’s law of response speed in Alzheimer and Parkinson diseases. Percept Mot Skills, 77(1), 107–113. doi: 10.2466/pms.1993.77.1.107 [DOI] [PubMed] [Google Scholar]
- Mattis S (1988). Dementia rating scale (DRS). Odessa, FL: Psychological Assessment Resources. [Google Scholar]
- Miller EK, & Cohen JD (2001). An integrative theory of prefrontal cortex function. Annu Rev Neurosci, 24, 167–202. doi: 10.1146/annurev.neuro.24.1.167 [DOI] [PubMed] [Google Scholar]
- Moll J, de Oliveira-Souza R, Moll FT, Bramati IE, & Andreiuolo PA (2002). The cerebral correlates of set-shifting: an fMRI study of the trail making test. Arq Neuropsiquiatr, 60(4), 900–905. [DOI] [PubMed] [Google Scholar]
- Morin RE, Forrin B, & Archer W (1961). Information processing behavior: the role of irrelevant stimulus information. J Exp Psychol, 61, 89–96. [DOI] [PubMed] [Google Scholar]
- Ohnishi T, Matsuda H, Tabira T, Asada T, & Uno M (2001). Changes in brain morphology in Alzheimer disease and normal aging: is Alzheimer disease an exaggerated aging process? AJNR Am J Neuroradiol, 22(9), 1680–1685. [PMC free article] [PubMed] [Google Scholar]
- Pirozzolo FJ, Christensen KJ, Ogle KM, Hansch EC, & Thompson WG (1981). Simple and choice reaction time in dementia: clinical implications. Neurobiol Aging, 2(2), 113–117. [DOI] [PubMed] [Google Scholar]
- Pollack I (1963). Speed of classification of words into superordinate categories. Journal of Verbal Learning and Verbal Behavior, 2(2), 159–165. [Google Scholar]
- Proctor RW, & Schneider DW (2017). Hick’s Law for Choice Reaction Time: A Review. Q J Exp Psychol (Hove), 1–56. doi: 10.1080/17470218.2017.1322622 [DOI] [PubMed] [Google Scholar]
- Rabbitt PM (1968). Repetition effects and signal classification strategies in serial choice-response tasks. Q J Exp Psychol, 20(3), 232–240. doi: 10.1080/14640746808400157 [DOI] [PubMed] [Google Scholar]
- Rombouts SA, Barkhof F, Witter MP, & Scheltens P (2000). Unbiased whole-brain analysis of gray matter loss in Alzheimer’s disease. Neurosci Lett, 285(3), 231–233. [DOI] [PubMed] [Google Scholar]
- Ruff RM (2003). A friendly critique of neuropsychology: facing the challenges of our future. Arch Clin Neuropsychol, 18(8), 847–864. [DOI] [PubMed] [Google Scholar]
- Seeley WW, Menon V, Schatzberg AF, Keller J, Glover GH, Kenna H, … Greicius MD (2007). Dissociable intrinsic connectivity networks for salience processing and executive control. J Neurosci, 27(9), 2349–2356. doi: 10.1523/JNEUROSCI.5587-06.2007 [DOI] [PMC free article] [PubMed] [Google Scholar]
- Shannon CE (1948). A mathematical theory of communication. The Bell Technical System Journal, 27, 379–423 [Google Scholar]
- Shannon CE & Weaver W (1949). The mathematical theory of communication. Urbana: University of Illinois Press. [Google Scholar]
- Shibuya-Tayoshi S, Sumitani S, Kikuchi K, Tanaka T, Tayoshi S, Ueno S, & Ohmori T (2007). Activation of the prefrontal cortex during the Trail-Making Test detected with multichannel near-infrared spectroscopy. Psychiatry Clin Neurosci, 61(6), 616–621. doi: 10.1111/j.1440-1819.2007.01727.x [DOI] [PubMed] [Google Scholar]
- Sleimen-Malkoun R, Temprado JJ, & Berton E (2013). Age-related dedifferentiation of cognitive and motor slowing: insight from the comparison of Hick-Hyman and Fitts’ laws. Front Aging Neurosci, 5, 62. doi: 10.3389/fnagi.2013.00062 [DOI] [PMC free article] [PubMed] [Google Scholar]
- Sperling RA, Karlawish J, & Johnson KA (2013). Preclinical Alzheimer disease-the challenges ahead. Nat Rev Neurol, 9(1), 54–58. doi: 10.1038/nrneurol.2012.241 [DOI] [PMC free article] [PubMed] [Google Scholar]
- Supekar K, Menon V, Rubin D, Musen M, & Greicius MD (2008). Network analysis of intrinsic functional brain connectivity in Alzheimer’s disease. PLoS Comput Biol, 4(6), e1000100. doi: 10.1371/journal.pcbi.1000100 [DOI] [PMC free article] [PubMed] [Google Scholar]
- Wager TD, Jonides J, & Reading S (2004). Neuroimaging studies of shifting attention: a meta-analysis. Neuroimage, 22(4), 1679–1693. doi: 10.1016/j.neuroimage.2004.03.052 [DOI] [PubMed] [Google Scholar]
- Wang K, Liang M, Wang L, Tian L, Zhang X, Li K, & Jiang T (2007). Altered functional connectivity in early Alzheimer’s disease: a resting-state fMRI study. Hum Brain Mapp, 28(10), 967–978. doi: 10.1002/hbm.20324 [DOI] [PMC free article] [PubMed] [Google Scholar]
- Wechsler D (1945). Wechsler memory scale.
- Wechsler D (1981). WAIS-R manual: Wechsler adult intelligence scale-revised: Psychological Corporation.
- Welford AT (1984). Between bodily changes and performance: some possible reasons for slowing with age. Exp Aging Res, 10(2), 73–88. doi: 10.1080/03610738408258548 [DOI] [PubMed] [Google Scholar]
- Wifall T, Hazeltine E, & Toby Mordkoff J (2016). The roles of stimulus and response uncertainty in forced-choice performance: an amendment to Hick/Hyman Law. Psychol Res, 80(4), 555–565. doi: 10.1007/s00426-015-0675-8 [DOI] [PubMed] [Google Scholar]
- Wu T, Dufford AJ, Egan LJ, Mackie MA, Chen C, Yuan C, … Fan J (2017). Hick-Hyman Law is Mediated by the Cognitive Control Network in the Brain. Cereb Cortex, 1–16. doi: 10.1093/cercor/bhx127 [DOI] [PMC free article] [PubMed] [Google Scholar]
- Yesavage JA, Brink TL, Rose TL, Lum O, Huang V, Adey M, & Leirer VO (1982). Development and validation of a geriatric depression screening scale: a preliminary report. J Psychiatr Res, 17(1), 37–49. [DOI] [PubMed] [Google Scholar]
- Zhou J, Greicius MD, Gennatas ED, Growdon ME, Jang JY, Rabinovici GD, … Seeley WW (2010). Divergent network connectivity changes in behavioural variant frontotemporal dementia and Alzheimer’s disease. Brain, 133(Pt 5), 1352–1367. doi: 10.1093/brain/awq075 [DOI] [PMC free article] [PubMed] [Google Scholar]