Abstract
As a renewable, Miscanthus offers numerous advantages such as high photosynthesis activity (as a C4 plant) and an exceptional CO2 fixation rate. These properties make Miscanthus very attractive for industrial exploitation, such as lignin generation. In this paper, we present a systematic study analyzing the correlation of the lignin structure with the Miscanthus genotype and plant portion (stem versus leaf). Specifically, the ratio of the three monolignols and corresponding building blocks as well as the linkages formed between the units have been studied. The lignin amount has been determined for M. x giganteus (Gig17, Gig34, Gig35), M. nagara (NagG10), M. sinensis (Sin2), and M. robustus (Rob4) harvested at different time points (September, December, and April). The influence of the Miscanthus genotype and plant component (leaf vs. stem) has been studied to develop corresponding structure-property relationships (i.e., correlations in molecular weight, polydispersity, and decomposition temperature). Lignin isolation was performed using non-catalyzed organosolv pulping and the structure analysis includes compositional analysis, Fourier transform infradred (FTIR), ultraviolet/visible (UV-Vis), hetero-nuclear single quantum correlation nuclear magnetic resonsnce (HSQC-NMR), thermogravimetric analysis (TGA), and pyrolysis gaschromatography/mass spectrometry (GC/MS). Structural differences were found for stem and leaf-derived lignins. Compared to beech wood lignins, Miscanthus lignins possess lower molecular weight and narrow polydispersities (<1.5 Miscanthus vs. >2.5 beech) corresponding to improved homogeneity. In addition to conventional univariate analysis of FTIR spectra, multivariate chemometrics revealed distinct differences for aromatic in-plane deformations of stem versus leaf-derived lignins. These results emphasize the potential of Miscanthus as a low-input resource and a Miscanthus-derived lignin as promising agricultural feedstock.
Keywords: biomass, chemometrics, genotype, HSQC NMR, lignin, Miscanthus x giganteus, monolignol ratio, principal component analysis
1. Introduction
Miscanthus, a perennial rhizome-forming sweet grass (Poaceae), is originally cultivated in subtropical regions in Asia. Currently, there are approximately 17 species investigated in Europe for energy and material development including Miscanthus tinctorius, M. sinensis, M. sacchariflorus, and the triploid genotype M. x giganteus, which is an allotriploid hybrid of the diploid M. sinensis and the tetraploid M. sacchariflorus. Miscanthus field trials have been performed in Europe over the past 25 years confirming that M. x giganteus hybrids show high yields over a wide range of environmental conditions [1,2,3]. As a C4 plant, Miscanthus is effective in carbon sequestration due to the formation of oxaloacetate, as opposed to D-3-phosphoglycerate for C3 plants [4,5,6]. Thus, Miscanthus is one of the very few crops that is studied to serve as a CO2 sink [7,8,9,10,11,12,13]. In addition, this sterile genotype does not generate fertile seeds, which avoids uncontrolled spreading [14]. After planting, the production of the perennial crop lasts for about 20 years. In the production phase, the plant needs much less fertilizer than other crops, even at arid conditions, due to an effective nitrogen metabolism. Plant protection is, in general, not required except for weed control in the first year of establishment [2,15,16]. M. x giganteus reaches a height of about four meters and an annual production up to 25 t/ha, which saves production costs that decrease the environmental impact due to reduced tillage and less soil compaction and erosion [17]. Within the last five years, the upscaling of Miscanthus biomass production in Europe could significantly be improved by using seed-based hybrids. Consequently, Miscanthus hybrids are expected to play an increasing role in the provision of perennial lingo-cellulosic feedstock in Europe, which contributes to a lower carbon economy [1,18,19].
The use of Miscanthus as a source for raw materials would significantly improve the environmental performance of lignocellulose-based biorefineries [20,21,22]. Miscanthus is already used for direct combustion in a sustainable and CO2 neutral manner. In addition to the exploitation of Miscanthus as an energy plant, there is urgent need to exploit the potential of Miscanthus for chemical production. Recent work by Kraska et al. has shown Miscanthus’ potential for chemical production through a cascade utilization [23,24]. Other studies focus on the production of bioethanol [25], hydrogen [26], and the utilization of the plant fibers for fiber-based composites [27,28,29,30,31].
So far, only a few systematic studies have been published focusing on the structure-property relationships for Miscanthus-derived lignins. El Hage et al. reported the pre-treatment of biomass for ethanol-based organsolv pulping, in which they specify correlations of structural changes with process conditions [32,33,34]. Catalyzed organosolv pulping was studied to depolymerize lignins using vanadium and nickel-based catalysts, which shows correlations between lignin structure and reactivity toward the catalysts [35,36,37]. Timilsena et al. studied Miscanthus plants and compared different pre-treatment methods (i.e., autohydrolysis, 2-naphthol treatment) [38]. Other authors studied different Miscanthus genotypes regarding their composition (cellulose, hemicellulose, lignin), but did not analyze the lignin structure [39]. Van der Weijde investigated eight M. sinensis samples regarding their cell wall constitution [40]. Enzymatic depolymerization of Miscanthus-derived lignin was studied by various groups [41,42,43].
The most detailed study was reported by Da Costa et al., which investigated the cell tissue type of 25 Miscanthus genotypes (i.e., M. x giganteus, M. sinensis, and M. sacchariflorus) [44]. Cell-wall compositional differences between Miscanthus stem and leaf samples were mainly associated with differences of structural carbohydrates. The authors could proof direct correlations between the lignin content isolated form specific plant portions and the genotype. However, no structural details regarding the monolignol ratio and/or corresponding linkages were reported [44].
Iqbal et al. reported a multi-genotype trial performed in south Germany focusing correlations of biomass yield and composition with climatic conditions and harvesting time using multivariate data analysis methods [45]. For example, in M. sacchariflorus, the harvest date–aging interaction influenced the Mg concentration and ash content. The harvest date–rainfall interaction significantly decreased calcium, silicon, and nitrogen concentrations. In addition, these deviations in mineral concentration depend on the Miscanthus genotypes (as studied for M. x giganteus and M. sinensis). This study did not include lignin 3D structure analysis [45].
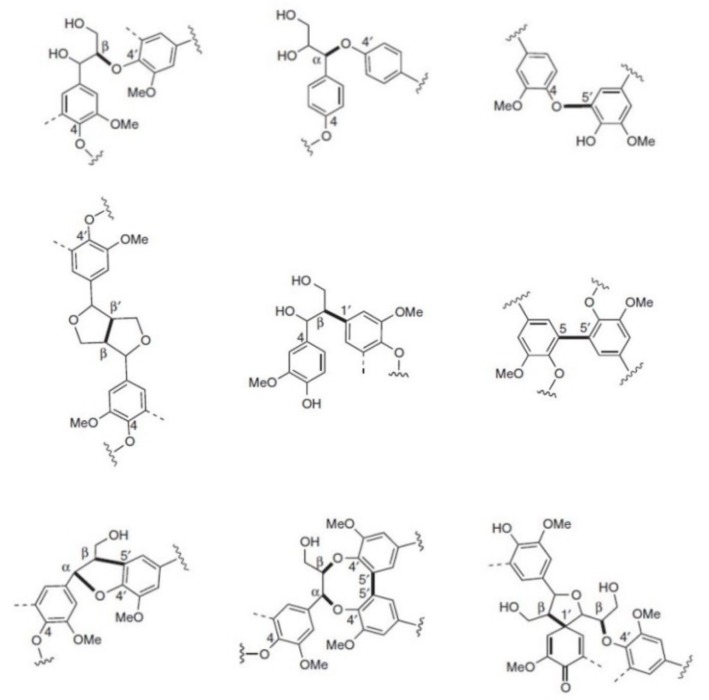
In contrast to the lack of a systematic structural study for Miscanthus-derived lignins, numerous studies are reported regarding the structure of wood-derived kraft lignin obtained from industrial black liquor. In this scenario, HSQC 2D-NMR is one of the most widely used tool for structural characterization of lignins of any origin, which is comprehensively reviewed by Ralph, Lupoi, and Tarasov et al. [46,47,48]. Most interestingly, HSQC provides information on the units (G, H, S) and corresponding inter-unit linkages. Depending on the biomass source (soft and hard wood, grasses) and the pulping process (kraft, steam explosion, organosolv etc.), the monolignol ratio, and their linkages differ significantly [49,50,51,52,53,54,55,56,57,58,59,60]. Figure 1 shows the most common linkages of lignin formed during biosynthesis in which some of them were confirmed within the last five years [55,61,62].
Figure 1.
Monolignol linkages. First line: Ether bonds (ß-O-4’, α-O-4’, 4-O-5’). Second line: C-C-bonds. (ß-ß’, ß-1’, 5-5’) and third line: more complex linkages (ß-5’/ α-O-4’, 5-5’/ ß-O-4’/ α-O-4’, ß-1’/ ß-O-4’).
Very recently, Lan et al. reported the synthesis of several 4’–O–ß-coupling products of tricin with coniferyl and sinapyl alcohol and revealed new correlations in the HSQC spectrum [63]. Table 1 gives an overview about differences regarding the linkages found for hard wood, soft wood, and Miscanthus grasses [61,62,63].
Table 1.
Abundance of linkages in lignins of soft and hard wood [61] and Miscanthus grasses [62,63] including KOH-extractable and non-KOH-extractable in %.
| Linkage | Hard Wood H/G/S traces/25–50/50–75 |
Soft Wood H/G/S 0.5–3.4/90–95/0–1 |
Miscanthus H/G/S 24/49/27 |
|---|---|---|---|
| β-O-4‘ | 50–65 | 43–50 | 93 |
| A-O-4‘ | 4–8 | 6–8 | ns* |
| β-β‘ | 3–7 | 2–4 | 4 |
| β-5‘ | 4–6 | 9–12 | 3 |
| β-1‘ | 5–7 | 3–7 | traces |
| 4-O-5’ | 6–7 | 4 | ns * |
| 5-5’ | 4–10 | 10–25 | ns * |
* ns: not specified.
In addition, the combination of NMR and chemometrics has been successfully applied in the origin analysis of biopolymers including polysaccharides and lignin. For example, Monakhova et al. were recently able to specify porcine and ovine-derived heparins using 2D DOSY NMR and size exclusion chromatography (SEC) data [64]. In general, chemometric methods can also be used for multivariate FTIR data analysis. Boeriu et al. combined FTIR and principal component analysis (PCA) to be used as a fast and reliable non-destructive technique to classify the botanical origin of lignins. In addition, chemometric models (partial least squares, PLS regression) allowed an accurate determination of phenolic hydroxyl groups and corresponding antioxidant capacity [65]. Chen et al. used multivariate data analysis to characterize wood samples qualitatively and quantitatively by FTIR spectroscopy. To determine the contents of lignin, cellulose, and hemicellulose, respectively, the authors included a broad variety of input parameters such as wood species obtaining results with the root-mean-square errors of 1.51%, 0.96%, and 0.62% [66]. Very recently, Christou et al. reported a study examining the combination of FTIR spectroscopy and chemometrics to differentiate carob samples from seven different Mediterranean countries using the first derivatives of the FTIR spectra, which resulted in a confidence level up to 95% [67].
For the first time, this study presents comprehensive analytical data (including compositional analysis, FTIR, UV-Vis, HSQC-NMR, SEC, TGA, Py-GC/MS) for Miscanthus x giganteus-derived lignins correlating with plant portions (stem versus leaf). The biomass was separated into stem and leaf portions to be treated separately using the organosolv process for lignin isolation. In addition to conventional analysis of the chemical structure of the obtained lignins, multivariate data analysis of FTIR data is used to specify structural details that allow the discrimination of stem versus leaf-derived lignins.
2. Results and Discussion
2.1. Miscanthus Crop Analysis
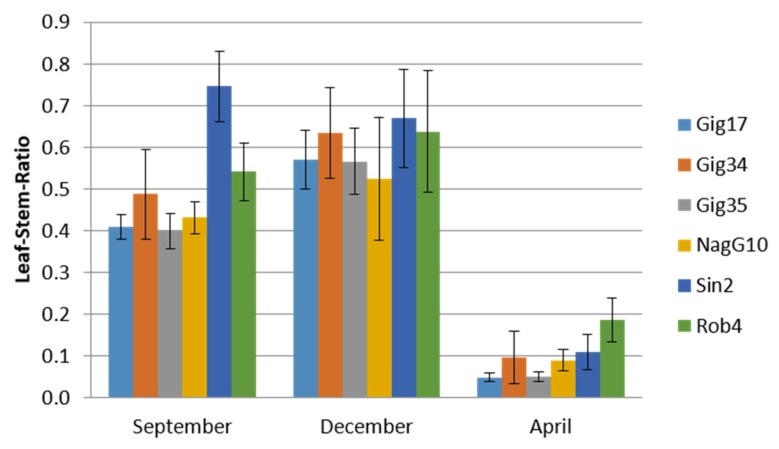
The seasonal influence on plant constitution was examined. Stem and leaf samples for lignin analysis were harvested in December 2014 as well as in April and September 2015 to compare across different years and harvest times. Plant constitution analysis showed significant differences regarding the lignin amount with respect to the year and harvest date (Figure 2). In early autumn (September), the leaf content did not reach the maximum (except for M. sinensis) when compared to the December harvest. Until spring, the plants lose their leaves, which results in an extremely low leaf versus stem ratio. The highest values were found for M. robustus (Rob4).
Figure 2.
Miscanthus crop analysis via NREL measurements. Leaf versus stem content of Miscanthus genotypes: M. x giganteus (Gig17, Gig34, Gig35), M. nagara (NagG10), M. sinensis (Sin2), and M. robustus (Rob4) harvested in September (09/15), December (12/14), and April (04/15), respectively (arranged to follow the seasonal order from autumn to spring).
In the following, the leaf-derived and stem-derived lignins will be discussed in detail for two M. x giganteus cultivars (Gig17, Gig34). Special focus is given to similarities and differences in lignin content and monolignol constitution depending on the plant portion (stem vs. leaf).
2.2. NREL Compositional Analysis
Four samples were analyzed regarding their element constitution following the NREL protocol. Both M. x giganteus samples were harvested in April 2015 and were then separated into stem and leaf portions to be analyzed separately (Table 2).
Table 2.
Compositional analysis data (according to NREL protocol) of Miscanthus x giganteus (Gig17, Gig34) and biomasses of leaf versus grasses, harvested in April 2015. AIL: acid-insoluble lignin. ASL: acid-soluble lignin. AIR: acid-insoluble residuals. AISA: acid-insoluble ash.
| Genotype Harvest Time Portion |
Gig17 April Leaf |
Gig34 April Leaf |
Gig17 April Stem |
Gig34 April Stem |
|---|---|---|---|---|
| AIL (%) | 20.65 ± 0.47 | 21.06 ± 0.31 | 21.18 ± 0.01 | 20.97 ± 0.43 |
| ASL (%) | 5.06 ± 0.30 | 4.13 ± 0.05 | 4.71 ± 0.26 | 4.31 ± 0.02 |
| AIR (%) | 21.83 ± 0.51 | 22.14 ± 0.42 | 22.46 ± 0.22 | 22.31 ± 0.60 |
| Total lignin (%) | 25.52 ± 0.54 | 25.32 ± 0.48 | 26.00 ± 0.36 | 25.25 ± 0.39 |
| AISA (%) | 1.18 ± 0.10 | 1.08 ± 0.22 | 1.29 ± 0.11 | 1.01 ± 0.05 |
| Glucan (%) | 44.79 ± 1.50 | 44.98 ± 2.30 | 50.02 ± 0.63 | 50.49 ± 0.87 |
| Xylan (%) | 28.37 ± 1.77 | 29.52 ± 0.63 | 27.41 ± 2.81 | 26.23 ± 0.49 |
| Galactan (%) | 0.00 ± 0.00 | 0.00 ± 0.00 | 0.00 ± 0.00 | 0.00 ± 0.00 |
| Arabinan (%) | 3.11 ± 0.05 | 4.11 ± 1.63 | 1.89 ± 0.51 | 2.04 ± 0.34 |
| Mannan (%) | 0.00 ± 0.00 | 0.00 ± 0.00 | 0.00 ± 0.00 | 0.00 ± 0.00 |
| Dry matter (%) | 92.55 | 91.25 | 92.18 | 92.16 |
| Total ash (%) | 4.53 | 6.82 | 2.50 | 3.07 |
The total ash content between stem-derived and leaf-derived lignins differs. Average values for stem lignins are 2.58% vs. 5.71% for leaf lignins due to a higher mineral content in leaves. Wahid et. al. reported total ash contents for stems of 2.6%–4.0% (M. x giganteus) and 1.5%–3.4% (M. sinensis). Leaves varied between 3.9%–7.2% (M. x giganteus) and 3.3%–5.0% (M. sinensis) [68]. Acid-insoluble residuals (AIR) showed very low ash contents (average 0.94%, calculated for all six genotype samples listed in Figure 2, [69]) due to low mineral impurities in this fraction. Due to a higher cellulose content in stems compared to leaves, higher glucose values were obtained for both M. x giganteus samples. In literature, carbohydrate contents vary in the range of 40 to 50 wt % for Miscanthus x giganteus genotypes, mainly consisting of glucan and xylan [70]. Other sugars, i.e., arabinan, mannan, and galactan are usually below 2%, which was very recently reported by Scaglione-Mellor for different Miscanthus genotypes [71]. No significant differences were found for the total lignin content for leaf and stem-derived biomasses. In literature, Miscanthus-derived lignin contents vary in the range of 19–25%. This mainly depends on the plant genotype [72,73].
2.3. FTIR Spectroscopy
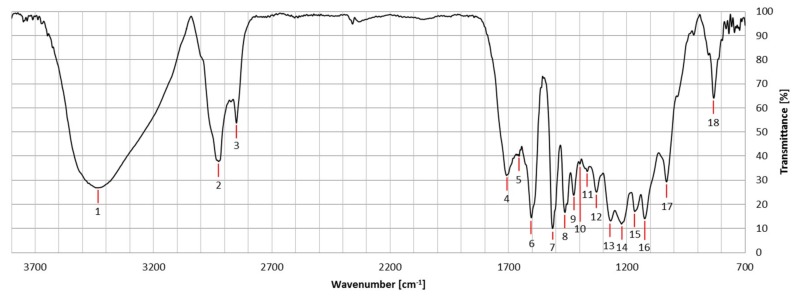
The results of the FTIR analysis confirmed reported literature data for lignins obtained from M. x giganteus plants [74,75]. As an example of the results, Table 3 summarizes the FTIR signals of sample Gig17, which is an M. x giganteus stem/leaf mixture. Signal numbers are given in Figure 3.
Table 3.
FTIR signals and corresponding assignment for a lignin isolated from M. x giganteus (Gig17, stem/leaf mixture).
| Number | Wave Number [cm−1] | Functional Group | Assignment |
|---|---|---|---|
| 1 | 3428 ± 60 | O-H | Stretching |
| 2 | 2926 ± 11 | C-H | Stretching |
| 3 | 2850 ± 6 | C-H | Stretching |
| 4 | 1708 ± 11 | C=O | Stretching |
| 5 | 1655 ± 4 | C=O | Stretching |
| 6 | 1605 ± 12 | Aromatic ring | Symmetric Stretching |
| 7 | 1514 ± 6 | Aromatic ring | Antisymmetric Stretching |
| 8 | 1460 ± 4 | C-H | Antisymmetric Deformation |
| 9 | 1424 ± 4 | C-H in O-CH3 | Antisymmetric Deformation (S mode) |
| 10 | 1398 ± 4 | C-H | Bending C-H in-plane |
| 11 | 1371 ± 15 | Aromatic skeleton | Deformation |
| 12 | 1331 ± 9 | Aromatic skeleton; C-O | Skeleton Stretching (S mode) |
| 13 | 1267 ± 2 | Aromatic skeleton; C-O | Skeleton Stretching (G mode) |
| 14 | 1225 ± 12 | C-C; C-O; C=O | Stretching (G mode) |
| 15 | 1166 ± 10 | C-H (in G) | Stretching |
| 16 | 1124 ± 2 | Aromatic C-H | In-plane Deformation |
| 17 | 1033 ± 2 | Aromatic C-H | In-plane Deformation |
| 18 | 834 ± 4 | Aromatic C-H | Out-of-plane Deformation (S mode) |
Figure 3.
FT-IR spectra of Gig17 (stem, leaf, and mixture) with numbered signals listed in Table 4.
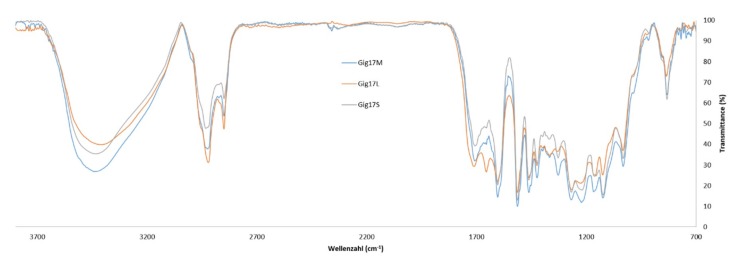
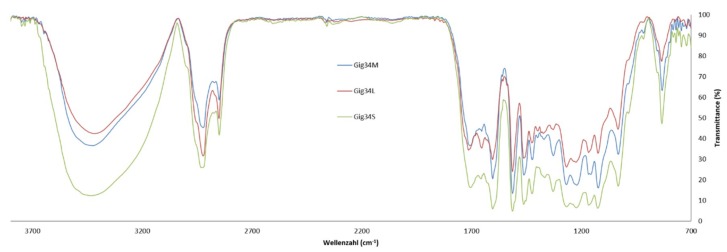
Comparing the FTIR data of stem/leaf mixtures (Gig17M) versus separated biomass (Gig17L, Gig17S), similarities were found for mixture and stem-derived lignin (Figure 4 and Figure 5).
Figure 4.
FT-IR spectra of mixture (Gig17M), leaf (Gig17L), and stem-derived (Gig17S) lignins obtained from M. x giganteus (Gig17).
Figure 5.
FT-IR spectra of mixture (Gig34M), leaf (Gig34L), and stem-derived (Gig34S) lignins obtained from M. x giganteus (Gig34).
This is in good accordance with the low amount of leaves in the plant (<5 wt %). In detail, both leaf samples showed a signal at about 1655 cm−1 (number 5), which is very weak for stem (Gig17S, Gig34S) and the mixtures (Gig17M, Gig34M). Further differences are obtained for signal No. 12 (ca. 1331 cm−1), No. 14 (ca. 1225 cm−1), and 16 (ca. 1124 cm−1). All three are very weak for leaf-derived lignin versus stem and mixture, respectively. The two M. x giganteus cultivars (17 and 34) showed no significant differences.
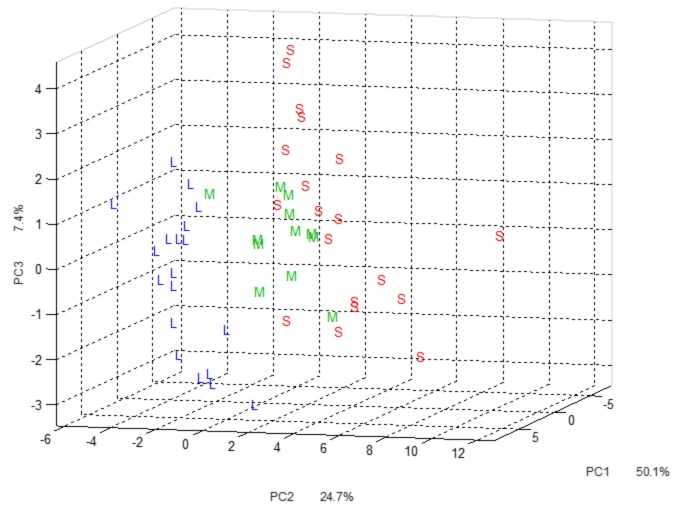
PCA characterization of lignin samples was carried out to evaluate the potential of multivariate data analysis to specify lignin obtained from Miscanthus x giganteus plants derived from stems, leaves, and their mixtures. The projections of IR spectra of lignin samples on the first three principal components (PCs), which express 82% of variance, are shown in Figure 6.
Figure 6.
Multivariate data analysis of FT-IR data using the principal component analysis (PCA). L: leaf-derived lignin. M: mixture-derived lignin. S: stem-derived lignin.
The first two PCs are enough to differentiate steam-derived and leaf-derived materials, whereas PC3 is necessary to highlight the third group of samples (mixtures). The mixture class (M) is completely separated from the leaf class (L), but still shows overlap with the stem class (S). Again, this is most likely due to the low ratio of leaf versus stem lignin in the mixture. Advanced chemometric methods such as discriminant analysis are required to separate all three groups in the multivariate space. Loadings plots confirmed our univariate findings described above.
2.4. Size Exclusion Chromatography
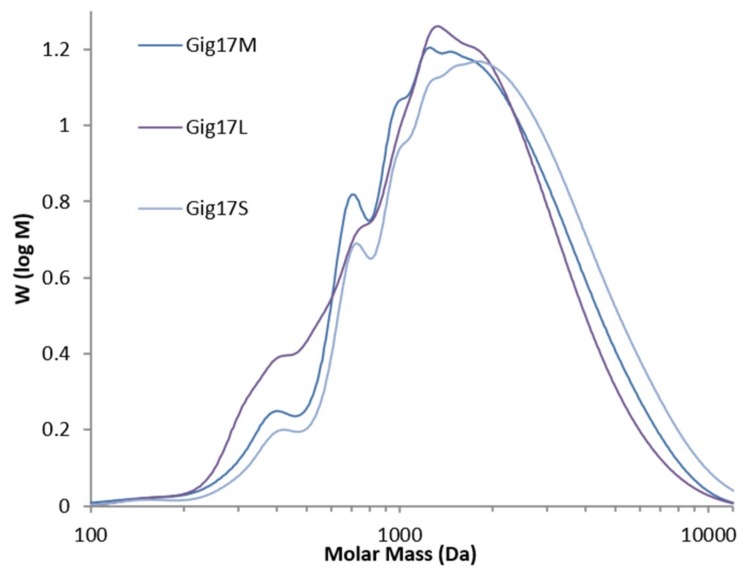
Analogous to the FTIR results, SEC studies revealed distinct differences between stem-derived and leaf-derived lignins and similarities for stem/leaf mixtures and stem lignins. In detail, the SEC curve profile differs for leaf-derived lignin, which shows weak shoulders at molar mass below 1000 Da instead of small but sharp peaks for stem-derived and mixture-derived lignin (Figure 7).
Figure 7.
SEC curves of lignins obtained from Miscanthus x giganteus (Mixture: Gig17M. Leaf: Gig17L. Stem Gig17S).
All obtained data (number and weight average molar masses (Mn, Mw) and polydispersities (PD) are summarized in Table 4.
Table 4.
SEC results (detected via refractive index (RI) and ultraviolet (UV) detectors) including the number average (Mn) and weight average (Mw) molecular weight and polydispersity (PD) of lignin obtained from Miscanthus x giganteus mixtures (Gig17M, Gig34M), leaves (Gig17L, Gig34L), and stems (Gig17S, Gig34S).
| SEC Results | Detector | Gig17M | Gig34M | Gig17L | Gig34L | Gig17S | Gig34S |
|---|---|---|---|---|---|---|---|
| M n (g·mol−1) | RI | 1138.80 | 1139.10 | 967.13 | 960.96 | 1314.40 | 1206.30 |
| UV | 1077.70 | 1084.40 | 904.49 | 931.43 | 1168.90 | 1120.00 | |
| M w (g·mol−1) | RI | 2041.40 | 2146.40 | 1758.70 | 1800.10 | 2385.00 | 2098.70 |
| UV | 1983.40 | 2050.90 | 1691.60 | 1745.00 | 2216.30 | 2033.90 | |
| PD | RI | 1.79 | 1.88 | 1.82 | 1.87 | 1.81 | 1.74 |
| UV | 1.84 | 1.89 | 1.87 | 1.87 | 1.90 | 1.82 |
There are weak deviations for Mn and Mw in stem versus leaf lignin. However, these differences did not influence the final polydispersity, which is very narrow for all samples. Literature data for organosolv-derived Miscanthus lignin vary between 2.0 to 2.5 kDa (Mw), 1.1 to 1.6 kDa (Mn), and 1.5 to 2.0 (PD) [76]. This is a much lower PD than beech wood-derived organosolv lignins, which showed polydispersities of 2.7 to 2.9 [47,77,78]. Brandt et al. reported SEC data for M. x giganteus-derived lignin isolated via ionic solvents showed significantly higher polydispersities of 3.7–7.6 depending on pre-treatment times [79]. The M. x giganteus samples isolated via organosolv treatment showed the narrowest polydispersity and the resulting macromolecular homogeneity reported so far for grass-derived lignins.
Structural differences for stem-derived versus leaf-derived lignins, namely lower molecular weight of the leaf-lignins, could also be confirmed by spectroscopic methods (FTIR, UV-Vis, see Section 2.3 and Section 2.5).
2.5. UV-Vis Spectroscopy
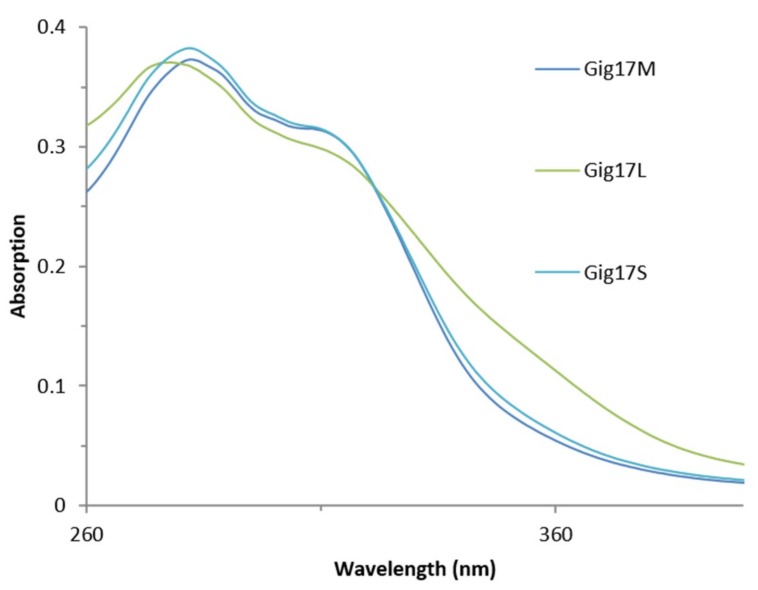
As shown in Figure 8, M. x giganteus lignin obtained via organosolv pulping samples showed two distinct signals, which is in accordance to literature data [35].
Figure 8.
UV/Vis curves for lignins obtained from Miscanthus x giganteus. (Mixture: Gig17M. Leaf: Gig17L. Stem Gig17S).
Again (due to the much higher amount of stems in the mixture), mixtures (Gig17M) and stem-derived lignin (Gig17S) are comparable in their UV absorption profile, whereas leaf-derived lignin (Gig17L) differ in their UV-Vis absorption behavior. In particular, leaf-lignin consists of higher amounts of conjugated fragments resulting in a weak but visible shoulder around 320 to 350 nm. This is in accordance with the absorption profile of lignin from other biomasses [22,32,47,80]. Apart from this, four distinct absorption maxima were found for kraft lignins obtained from technical black liquor (spruce/pine mixtures) and purified via sequential extraction from organic solvents. Clearly, stepwise purification influenced the intensity of UV/Vis absorption signals (in addition to effects caused by biomass and the pulping process) [80].
2.6. Thermogravimetric Analysis
The thermal behavior of the lignins was determined by thermogravimetric analysis (TGA). In Table 5, the TGA data obtained in this study are summarized including time-depending mass loss (in %/min), residual masses, and decomposition temperatures for mixtures (Gig17M) and leaf/stem-separated samples (Gig17L, Gig17S).
Table 5.
TGA results including first and second mass loss (ML), residual mass (RM), and decomposition temperature (Td) for two M. x giganteus lignins. Mixtures (Gig17M, Gig34M), stem-derived lignins (Gig17S, Gig34S), and leaf-derived lignins (Gig17L, Gig34L).
| Sample | First ML (120 °C) | Second ML (350 °C) | RM | Td |
|---|---|---|---|---|
| Gig17M | 0.86% | 75.88% | 23.26% | 358.2 °C |
| Gig17L | 0.91% | 64.98% | 34.11% | 354.8 °C |
| Gig17S | 0.42% | 65.48% | 34.10% | 381.6 °C |
| Gig34M | 0.54% | 73.79% | 25.67% | 360.0 °C |
| Gig34L | 0.72% | 71.41% | 27.87% | 336.1 °C |
| Gig34S | 4.60% | 84.08% | 11.32% | 379.2 °C |
The first mass loss at about 120 °C (after 5 min) can be assigned to water elimination. Subsequently, lignin was systematically depolymerized between 170–350 °C (starting after ca. 8 min). Corresponding decomposition temperatures vary between 335–380 °C with the lowest values for leaf-derived lignins. However, the data obtained for Td and residual mass differed by less than 10% and no clear correlation could be drawn between the thermal behavior and plant portion and/or Miscanthus genotype. Most likely, differences in sample pre-treatment and preparation are of more significant influence, which confirms results reported in the literature [81,82].
In general, lignins are thermally degraded in a broad temperature range (100–700 °C) due to their rather complex 3D structure consisting of phenolic hydroxyl, carbonyl, and benzylic hydroxyl functionalities resulting in several weight-loss steps during TGA measurements. The first loss (between 100–200 °C) can be attributable to moisture and other volatile substances such as carbon monoxide and dioxide, which confirms literature data [83]. According to Wittkowski et al., the degradation of propanoid side chains occurs between 230 to 260 °C, which results in the splitting of methyl, ethyl, and vinyl guaiacol derivatives, whereas aryl ether bonds are usually split below 310 °C [84]. In most lignins, about two-thirds of the monolignol units are connected by β-O-4’ linkages, which results in decomposition temperatures varying from 350 to 425 °C for lignin for all analyzed sources of biomass (soft and hard wood, grasses, LCF-rich waste) [47]. Glasser and El-Saied reported a correlation of decomposition temperature and a monolignol ratio. Lignins with higher contents of G units and a corresponding high amount of very stable intermolecular C–C bonds show higher decomposition temperatures [85,86].
2.7. Pyrolysis Gas Chromatography/Mass Spectrometry
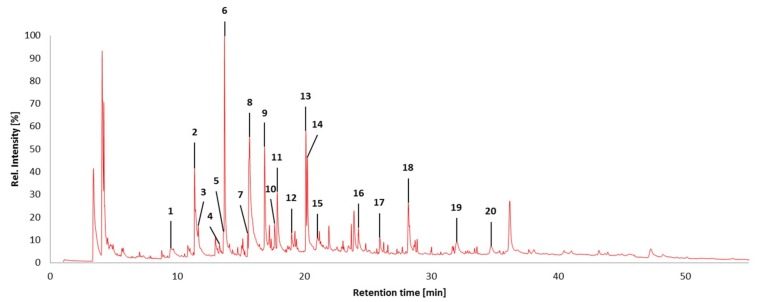
Pyrolysis GC/MS analysis has indicated significant variations in monolignol ratios between stem, leaf, and mixed samples. In this case, the assignment of the Py-GC/MS data was performed in accordance with data reported by Hodgson et al. [87,88]. Figure 9 shows a typical pyrogram (obtained for Gig17M). All aromatic pyrolysis products are numbered and summarized in Table 6.
Figure 9.
Pyrolysis-GC/MS pyrogram of a lignin obtained from Miscanthus x giganteus Gig17M. Stem/leaf mixture with numbers for all aromatic fragments listed and assigned in Table 6.
Table 6.
Pyrolysis-GC/MS fragments of the sample Gig17M and assignment to H, G, and S units.
| Peak No. | Retention Time (min) | Amount (%) | Name | Assignment |
|---|---|---|---|---|
| 1 | 9.49 | 3.77 | Phenol | H |
| 2 | 11.36 | 10.07 | Guaiacol | G |
| 3 | 11.65 | 1.83 | p-Cresol | H |
| 4 | 13.32 | 0.70 | Creosol | G |
| 5 | 13.67 | 1.27 | 4-Ethylphenol | H |
| 6 | 13.72 | 12.92 | Creosol | G |
| 7 | 15.55 | 0.91 | 4-Ethylguaiacol | G |
| 8 | 15.69 | 22.08 | Coumaran | H |
| 9 | 16.874 | 8.17 | 4-Hydroxy-2-methylacetophenone | H |
| 10 | 17.66 | 1.67 | Eugenol | G |
| 11 | 17.87 | 5.68 | Syringol | S |
| 12 | 19.00 | 1.55 | Eugenol | G |
| 13 | 20.13 | 6.80 | 4-Methylsyringol | S |
| 14 | 20.24 | 6.23 | (E)-Isoeugenol | G |
| 15 | 21.05 | 1.91 | Vanillin | G |
| 16 | 24.26 | 1.68 | 4-Allylsyringol | S |
| 17 | 25.95 | 1.56 | (E)-4-Propenylsyringol | S |
| 18 | 28.20 | 6.91 | (E)-4-Propenylsyringol | S |
| 19 | 32.03 | 2.50 | Syringaldehyde | S |
| 20 | 34.70 | 1.78 | Acetosyringone | S |
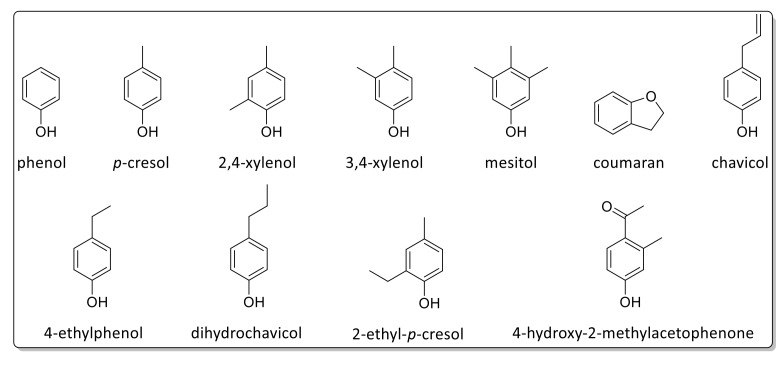
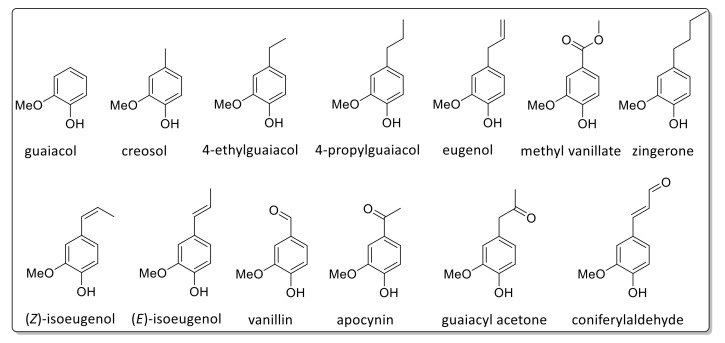
A few signals could not be attributed to a certain monolignol unit. Based on these data, monolignol ratios were estimated (Figure 10, Figure 11 and Figure 12).
Figure 10.
Detected Py-GC/MS fragments attributed to the H-unit.
Figure 11.
Detected Py-GC/MS fragments attributed to the G-unit.
Figure 12.
Detected Py-GC/MS fragments attributed to the S-unit.
As summarized in Table 7, Py-GC/MS fragments assigned to the syringyl (S) unit showed the lowest values for both leaf-derived lignin samples whereas the highest values were found for p-hydroxyphenyl (H) units. However, it should be emphasized that this is merely the first estimation since not all Py-GC/MS data could be assigned. In general, all samples investigated in this study showed a high amount of H units (Table 7), which confirms data reported by Brandt et al. for lignin isolated from M. x giganteus using ionic liquids [78].
Table 7.
Monolignol ratio of lignins according to pyrolysis GC/MS data of M. x giganteus samples (in %): Mixtures (Gig17M, Gig34M), leaves (Gig17L, Gig34L), and stems (Gig17S, Gig34S).
| Sample | H (%) | G (%) | S (%) |
|---|---|---|---|
| Gig17M | 37.13 | 35.96 | 26.91 |
| Gig17L | 46.35 | 45.82 | 7.83 |
| Gig17S | 35.11 | 32.94 | 31.95 |
| Gig34M | 43.79 | 29.50 | 26.71 |
| Gig34L | 46.30 | 39.25 | 14.45 |
| Gig34S | 35.06 | 38.55 | 26.39 |
According to Py-GC-MS analysis, fragments released from untreated Miscanthus originated from H/p-coumaric acid, G/ferulic acid, and S in roughly equal amounts (32%, 35%, and 33%, respectively). For quantification in pyrolysis gas chromatography, FID detectors are used and give nearly the same response as MS detectors once the compounds have been identified [89]. The application of the MS detector for the quantification and determination of the monolignol ratio of lignins in our work could be the cause of the discrepancy between the quantitative results obtained from Py-GC/MS and HSQC-NMR methods (see next Section 2.8).
2.8. Nuclear Magnetic Resonance
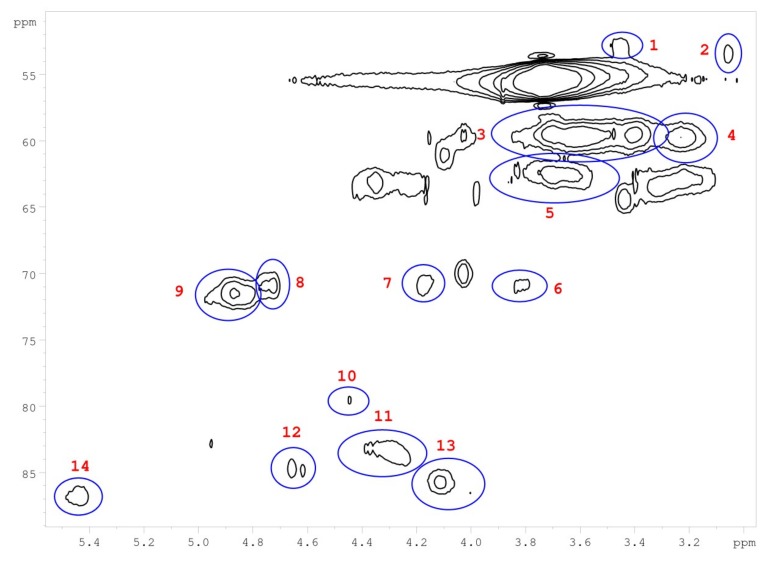
Heteronuclear single quantum correlation (HSQC) 2D-NMR was used to characterize the structure of M. x giganteus derived lignin with a particular focus on monolignol ratio and corresponding linkages. In accordance with literature data, cell wall and lignin HSQC spectra can be divided into the following regions: the aliphatic (side chain) and the aromatic (core) region. The aliphatic region does not provide structural information except for acetyl substituents and/or hemi-cellulosic component. Table 8 summarizes the obtained HSQC data.
Table 8.
HSQC 2D NMR data for an M. x giganteus stem/leaf mixture (Gig17M).
| Number | Integral (rel) | δ 1H (ppm) | δ 13C (ppm) | Name | Assignment |
|---|---|---|---|---|---|
| 1 | 0.0190 | 3.45 | 52.88 | B | B |
| 2 | 0.0254 | 3.06 | 53.34 | C | C |
| 3 | 0.7089 | 3.56 | 59.66 | A | A |
| 4 | 0.1322 | 3.23 | 59.71 | B | B |
| 5 | 0.1932 | 3.68 | 62.73 | A | A |
| 6 | 0.0321 | 3.82 | 71.00 | C | C |
| 7 | 0.0441 | 4.17 | 70.76 | C | C |
| 8 | 0.0561 | 4.74 | 70.95 | A | A |
| 9 | 0.1541 | 4.86 | 71.37 | A | A |
| 10 | 0.0435 | 4.47 | 79.78 | A | A |
| 11 | 0.1160 | 4.31 | 83.63 | A | A |
| 12 | 0.0361 | 4.64 | 84.75 | C | C |
| 13 | 0.1106 | 4.07 | 85.77 | A | A |
| 14 | 0.0626 | 5.45 | 86.79 | B | B |
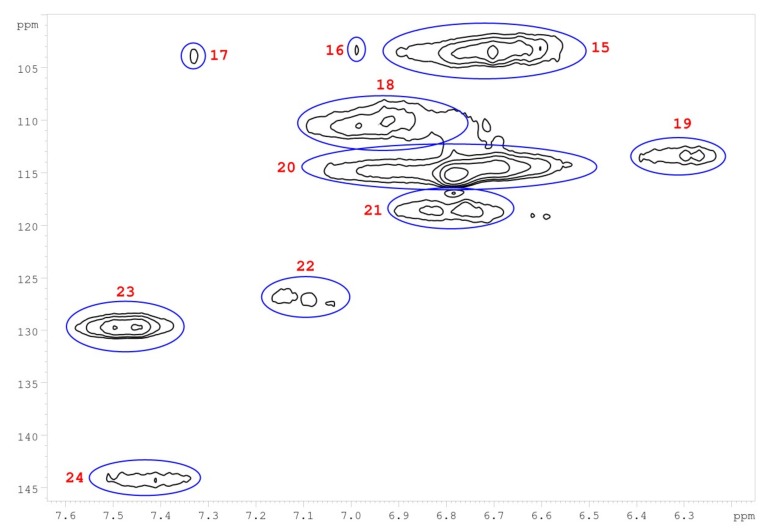
| 15 | 0.7042 | 6.73 | 103.42 | S 2/6 | S |
| 16 | 0.0411 | 6.99 | 103.24 | S 2/6 | S |
| 17 | 0.0337 | 7.33 | 103.79 | S 2/6 | S |
| 18 | 0.4662 | 6.96 | 109.88 | G 2 | G |
| 19 | 0.1192 | 6.30 | 113.46 | D | D |
| 20 | 1.0000 | 6.71 | 114.80 | G 5 | G |
| 21 | 0.1827 | 6.79 | 118.61 | G 6 | G |
| 22 | 0.1588 | 7.12 | 127.35 | H 2/6 | H |
| 23 | 0.4032 | 7.48 | 129.07 | H 2/6 | H |
| 24 | 0.1315 | 7.43 | 143.84 | D | D |
Integral numbers 1–14 found in the non-aromatic region and attributed monolignol linkages (Figure 13). Integrals 15–24 were obtained in the aromatic region assigned to the monolignol units (H, G, S) (Figure 14).
Figure 13.
Non-aromatic HSQC region of a lignin obtained from M. x giganteus stem/leaf mixture (Gig17M). Numbers are listed and assigned in Table 9.
Figure 14.
Aromatic HSQC region of a lignin obtained from M. x giganteus stem/leaf mixture (Gig17M). Numbers are listed and assigned in Table 9.
Corresponding ratios of monolignols and linkages were estimated. As summarized in Table 9, the data show differences between mixtures and lignin obtained from a separated stem versus a leaf. In leaves, about two-thirds of the G unit was found, whereas stem and mixture samples showed rather low G content. Instead, H and S units are at a higher ratio in mixtures.
Table 9.
Ratio of the monomer units (H, G, S) in lignins obtained from M. x giganteus. Stem/leaf mixtures (Gig17M, Gig34M), stems (Gig17S, Gig34S), and leaves (Gig17L, Gig34L).
| Sample | H | G | S |
|---|---|---|---|
| Gig17M | 23.03 | 45.05 | 31.92 |
| Gig17L | 13.65 | 67.24 | 19.11 |
| Gig17S | 15.77 | 57.67 | 26.56 |
| Gig34M | 21.17 | 53.54 | 25.29 |
| Gig34L | 14.87 | 63.43 | 21.70 |
| Gig34S | 19.07 | 54.80 | 26.13 |
However, HSQC NMR only considers signals for free C-H coupling (in case of further aromatic substituents, those fragments would not be recognized) [48,63,90]. Therefore, further detailed analysis is required to explain deviations of the monolignol ratios obtained via pyrolysis GC/MS and HSQC-NMR. Based on the HSQC data, the ratio of most abundant monolignol linkages was estimated (Table 10 and Figure 15).
Table 10.
Ratio of the most abundant linkages in lignins obtained from M. x giganteus. Stem/leaf mixtures (Gig17M, Gig34M), stems (Gig17S, Gig34S), and leaves (Gig17L, Gig34L).
| Sample | A (β-Aryl Ether) % | B (Phenylcoumaran) % | C (Resinol) % | D (Unsaturated Ester) % |
|---|---|---|---|---|
| Gig17M | 61.84 | 9.56 | 6.16 | 22.43 |
| Gig17L | 65.31 | 9.43 | 4.35 | 20.91 |
| Gig17S | 58.14 | 9.37 | 8.18 | 24.31 |
| Gig34M | 62.62 | 7.70 | 8.00 | 21.68 |
| Gig34L | 66.41 | 10.10 | 4.92 | 18.57 |
| Gig34S | 54.73 | 8.22 | 7.28 | 29.77 |
Figure 15.
Lignin structure elements for HSQC NMR signal assignment (A: β-O-4 linkage, B: phenylcoumaran, C: resinol, D: β-unsaturated ester).
In accordance with reported data for Miscanthus-based lignins, β-arylether were most abundant linkages, which vary between 55% and 65%. About 10% of the signals could be assigned to phenylcoumarane and resinol linkages. Unsaturated esters (D) are most abundant in stem-based lignins (up to 30%). Contrary to literature data, no signals were found for residual carbohydrates confirming the purity of the lignins obtained via organsolv pulping.
3. Materials and Methods
3.1. Miscanthus Field Trial Lignin Isolation via Organosolv Pulping
Miscanthus genotypes used in this study are cultivated at the field lab Campus Klein-Altendorf (University of Bonn, Rheinbach, Germany). The field stand was established in 2012. Genotypes used in this study were M. x giganteus (cultivars 17, 34, and 35, named as Gig17, Gig34, Gig35), M. nagara (NagG10), M. sinensis (cultivar 2, named Sin2), and M. robustus (cultivar 4, named Rob4, a hybrid of M. sacchariflorus and M. sinensis) [15,16]. Miscanthus samples were taken from the field stand in December 2014, April 2015, and September 2015.
3.2. Lignin Isolation via Organosolv Pulping
The samples were milled (using a ball mill Pulverisette 6, Fritsch, Idar-Oberstein, Germany) and sieved (using a Modell AS 200 basic, Retsch, Haan, Germany) to a particle size <0.5 mm. The organosolv process was performed according to an earlier published procedure [34,91,92,93]. All samples were prepared without using catalysts. Approximately 50 g Miscanthus x giganteus was passed through a 0.5 mm sieve and then mixed with 400 mL Ethanol (80% υ/υ). The mixture was heated at 170 °C for 90 min under continuous stirring in a Parr reactor with a Parr 4848 Reactor Controller. Afterwards, the Miscanthus biomass is vacuum filtrated and washed 5 times with 50 mL Ethanol (80% υ/υ). Three volumes of water and approximately 10 mL hydrochloric acid was added to the filtrate to precipitate the organosolv lignin, which was collected by centrifugation at 3500 rpm for 5 min and washed 3 times with distilled water. Lastly, the samples were freeze-dried for 72 h.
3.3. Lignin Purity, Ash, and Sugar Content via NREL Measurements
The chemical composition (%, w/w) was determined according to the standard analytical procedures published by the National Renewable Energy Laboratory (NREL) (Determination of Structural Carbohydrates and Lignin in Biomass) [94]. NREL measurements were performed by the BIOPOS Research Institute (Teltow-Seehof, Germany). HPLC analysis was conducted using water at a flow rate of 0.4 mL/min in a column (300 × 7.8 mm, Machery-Nagel, Bethlehem, PA, USA) at a constant temperature of 90 °C. Shortly, structural carbohydrates in biomass and lignin samples were determined following NREL/TP-510-42618 [95], biomass extracts in water and ethanol, according to NREL/TP-510-42619 [96], dry matter in biomass according to NREL/TP-510-42621 (Sluiter et al., 2008) [97] and ash contents according to NREL/TP-510-42622 [98].
3.4. Size-Exclusion Chromatography
To evaluate the depolymerization of the lignins, SEC was performed using the parameters shown in Table 11. Samples with a concentration of 10 mg·mL−1 were prepared in tetrahydrofuran (THF) and filtrated through 0.2 µm PTFE filter prior to analysis. For molar weight evaluation, polystyrene was used as a calibration standard.
Table 11.
SEC set up and parameters.
| Component | Description | Parameter |
|---|---|---|
| Eluent | THF p.a. | HPLC-grade |
| Pump | Agilent 1100 Series | Flowrate: 1.000 mL min−1 |
| Injector | Rheodyne 7725i sample loop | Injection volume: 60 µL |
| Oven | Agilent 1100 Series | Temperature: 35 °C |
| Column | 1× PSS SDV 8 × 50 mm pre-column | Particle size: 5 µm |
| 2× PSS SDV 8 × 300 mm Linear M 5µ | Particle size: 5 µm Molar weight range: 50–10,000,000 g mol−1 |
|
| Detector | Agilent 1100 Series VWD | Wavelength: 280 nm |
| Calibration | PSS ReadyCal-Kit Polystyren | Calibration range: 376–2,570,000 g mol−1 |
Size exclusion chromatography was performed using a PSS SECurity2 GPC System, Mainz, Germany (UV detector, 280 nm) to determine the weight-average (Mw) and number-average (Mn) molecular weights of the lignins as well as their polydispersity (PD). Tetrahydrofuran (THF) was the mobile phase with a run time of 30 min and an injection volume of 60 µL and polystyrene calibration standards. The lignin sample was completely dissolved in THF (1 mg·mL−1) with gentle stirring at room temperature.
3.5. UV-Vis Spectroscopy
The lignin UV-Vis absorption was measured using a Hewlett-Packard (Waltham, MA, USA) 450 Diode Array spectrometer. Samples of 1 mL containing 0.5 mg·mL−1 lignin in THF were measured at room temperature in a range of 260 to 400 nm.
3.6. Fourier Transform Infrared Spectroscopy
FTIR-spectra were recorded in a wavenumber range of 400–700 cm−1 with a resolution of 4 cm−1 and eight scans per sample (Jasco, Tokyo, Japan). KBr disc containing 2 mg of sample and 300 mg of KBr were prepared using a hydraulic press (10 metric tons).
3.7. Multivariate Data Analysis
Multivariate data analysis was performed using principal component analysis (PCA) in MATLAB 2019a (The Math Works, Natick, MA, USA). SAISIR package for MATLAB was used for statistical calculations [99,100]. The data points from IR spectral regions (800–1’800 and 2’800–3’700 cm−1) were selected. Autoscaling was used as the pretreatment before PCA. To normalize the intensities in different samples, they were additionally scaled to the total intensity.
3.8. Nuclear Magnetic Resonance Spectroscopy
2D HSQC NMR spectra were recorded using a NMR spectrometer Avance III 600 (Bruker, Karlsruhe, Germany) with 4 scans and 16 prior dummy scans. Deuterated dimethyl sulfoxide (DMSO d-6) was used as the solvent, tetramethylsilane as the standard, and 100 mg/mL as the sample concentration. A spectral width of 7211 Hz was used, resulting in 4000 points (receiver gain of 2050). A total acquisition time of 0.28 s. O1 was set to 5 ppm (1H) and 80 ppm (13C).
3.9. Thermogravimetric Analysis
Approximately 10 mg of lignin were used for thermogravimetric analysis (TGA) using a Netzsch (Selb, Germany) TGA 209 F1 (at a heating rate of 20 °C·min−1, nitrogen atmosphere). The temperature ranged from an ambient temperature to 900 °C. At 900 °C, synthetic air was used for an isothermic combustion.
3.10. Pyrolysis-Gas Chromatography/Mass Spectrometry
Pyrolysis-GC/MS measurements were performed on a combination of two GC 2010 Plus gas chromatographs, a GCMS-QP2010 Ultra mass spectrometer (Shimadzu, Kyoto, Japan), and an EGA/PY-3030D multi-shot pyrolyzer (Frontier Lab, Fukushima, Japan). The two fused silica capillary columns were Ultra Alloy columns (UA5-30M-0.25F and UACW-20M-0.25F) with a length of 30 m each, an inside diameter of 0.25 mm, and a film thickness of 0.25 μm. Shimadzu software MDGC Analysis GC solution 2.41.00.SU1 was used for the measurement and Shimadzu GC/MS solution 2.72 for the evaluation [73]. A 0.5 mg lignin sample was placed in a pyrolysis crucible made of stainless steel (PY1-EC50F), inserted into the pyrolyzer, and pyrolysed at 550 °C. For the first capillary column, the following temperature program was used: 75 °C for 1 min and 280 °C for 25 min at a heating rate of 7 °C·min−1. The column of the second GC instrument was held isothermal at 200 °C. Helium, grade 4.0 (99.990 %, v/v) (Westfalen AG, Münster, Germany) was used as carrier gas. After GC separation of the pyrolysis products, the MS detection was carried out. The ionization of the substances took place via electron impact ionization (EI) at 70 eV. The substances were accelerated in a high vacuum by the electric field of the quadrupole, separated, and then detected by their mass/charge ratio (m/z) in the electron multiplier. The m/z measuring range was 35–740 u.
4. Conclusions
This study presents the first systematic analysis of lignin amount and 3D structure for two different M. x giganteus genotypes (Gig17, Gig34) separated into stem and leaf portions. For biomass pulping, the organosolv process was used. Depending on the plant component (leaf vs. stem), structure-property-relationships have been developed. According to SEC analysis, lignin molecular weights and polydispersities differ for stem and leaf-derived lignins. Spectroscopic data (HSQC-NMR) revealed differences in the monolignol ratio and linkages for stem-based and leaf-based lignins. Further studies are required to explain deviations of pyrolysis GC/MS and HSQC-NMR results. FTIR data discrimination was approved using multivariate data analysis such as the principal component analysis (PCA). In this case, aromatic in-plane deformation FTIR absorption signals (at about 1160 cm−1) corresponding to the monolignol substitution pattern could be assigned to differentiate between stem and leaf lignins. Due to HSQC NMR results, there are also differences in monolignol composition for the two M. x giganteus samples (Gig17, Gig34). In comparison to beech wood-based lignin obtained from organosolv pulping at similar conditions, Miscanthus lignins possess a lower molecular weight and a very narrow polydispersity (<1.5 for M. genotypes versus >2.5 for beech wood lignins) due to a more homogeneous structure of grass versus wood-derived lignins. The obtained results emphasize the potential of Miscanthus crop as a low-input resource and agricultural feedstock for sustainable material production.
Author Contributions
M.B. mainly contributed to the manuscript, performed the experiments, analyzed the data, and contributed the main parts of the manuscript. G.V. and R.P. cultivated the crop genotypes and provided the Miscanthus samples of different particle sizes. Y.M. performed the NMR measurements and assisted in data analysis. X.T.D. performed multivariate data analysis (i.e., principal component analysis). P.K. performed Py-GC-MS measurements. T.K. contributed to writing the manuscript. C.K. performed parts of the lignin FTIR measurements during his DAAD RISE internship at HBRS and, as a native speaker, contributed to writing the manuscript. M.S. conceived and designed the experimental studies and was mainly involved in writing the manuscript.
Funding
The BMBF program “IngenieurNachwuchs” project “LignoBau” (03FH013IX4) and BioSC project “Miscanthus Cascade Utilization” (NRW state ministry for research) funded this project. The Graduate Institute of Bonn-Rhein-Sieg University of Applied Sciences gave M.B. a PhD scholarship. Y.M. acknowledges support from the Russian Science Foundation (project 18-73-10009).
Conflicts of Interest
The authors declare no conflict of interest.
References
- 1.Emmerling C., Pude R. Introducing Miscanthus to the greening measures of the EU Common Agricultural Policy. GCB Bioenergy. 2017;9:274–279. doi: 10.1111/gcbb.12409. [DOI] [Google Scholar]
- 2.Lewandowski I., Clifton-Brown J., Trindade L.M., van der Linden G.C., Schwarz K.-U., Müller-Sämann K., Anisimov A., Chen C.-L., Dolstra O., Donnison I.S., et al. Progress on optimizing miscanthus biomass production for the European bioeconomy: Results of the EU FP7 project OPTIMISC. Front. Plant Sci. 2016;7:1620. doi: 10.3389/fpls.2016.01620. [DOI] [PMC free article] [PubMed] [Google Scholar]
- 3.McCalmont J.P., Hastings A., McNamara N.P., Richter G.M., Robson P., Donnison I.S., Clifton-Brown J. Environmental costs and benefits of growing Miscanthus for bioenergy in the UK. GCB Bioenergy. 2017;9:489–507. doi: 10.1111/gcbb.12294. [DOI] [PMC free article] [PubMed] [Google Scholar]
- 4.Kellogg E.A. C4 photosynthesis. Curr. Biol. 2013;23:R594–R599. doi: 10.1016/j.cub.2013.04.066. [DOI] [PubMed] [Google Scholar]
- 5.Villaverde J.J., Ligero P., Vega A. Miscanthus x giganteus as a Source Of Biobased Products Through Organosolv Fractionation: A Mini Review. TOAJ. 2010;4:102–110. doi: 10.2174/1874331501004010102. [DOI] [Google Scholar]
- 6.Teese P. Intraspecific variation for CO2 compensation point and differential growth among variants in a C3-C4 intermediate plant. Oecologia. 1995;102:371–376. doi: 10.1007/BF00329804. [DOI] [PubMed] [Google Scholar]
- 7.Felten D., Fr€oba N., Fries J., Emmerling C. Energy balances and CO2-mitigation potentials of bioenergy crops (Miscanthus, rapeseed, maize) based on farming conditions in Western Germany. Renew. Energy. 2013;55:160–174. doi: 10.1016/j.renene.2012.12.004. [DOI] [Google Scholar]
- 8.Felten D., Emmerling C. Accumulation of Miscanthus-derived carbon in soils in relation to soil depth and duration of land-use under commercial farming conditions. J. Plant Nutr. Soil Sci. 2012;175:661–670. doi: 10.1002/jpln.201100250. [DOI] [Google Scholar]
- 9.Kiesel A., Nunn C., Iqbal Y., Van der Weijde T., Wagner M., Özgüven M., Tarakanov I., Kalinina O., Trindade L.M., Clifton-Brown J., et al. Site-Specific Management of Miscanthus Genotypes for Combustion and anaerobic digestion: A comparison of energy yields. Front. Plant Sci. 2017;8:347. doi: 10.3389/fpls.2017.00347. [DOI] [PMC free article] [PubMed] [Google Scholar]
- 10.Brosse N., Dufour A., Meng X., Sun Q., Ragauskas A. Miscanthus: A fast growing crop for biofuels and chemicals production. Biofuels Bioprod. Biorefin. 2012;6:580–598. doi: 10.1002/bbb.1353. [DOI] [Google Scholar]
- 11.Jørgensen U. Genotypic variation in dry matter accumulation and content of N, K and Cl in Miscanthus in Denmark. Biomass Bioenergy. 1997;12:155–169. doi: 10.1016/S0961-9534(97)00002-0. [DOI] [Google Scholar]
- 12.Clifton-Brown J.C., Lewandowski I. Frosttoleranz der Rhizome verschiedener Miscanthus Genotypen. Mitteilungen der Gesellschaft fuer Pflanzenbauwissenschaften. 1998;11:225–226. [Google Scholar]
- 13.Eppel-Hotz A., Jodl S., Kuhn W., Marzini K., Munzer W. Miscanthus: New cultivars and results of research experiments for improving the establishment rate; Biomass for Energy. In Proceedings of the 10th European Biomass Conference; Würzburg, Germany. 8–11 July 1998; pp. 780–786. [Google Scholar]
- 14.Greef J.M., Deuter M., Jung C., Schondelmaier J. Genetic diversity of European Miscanthus species revealed by AFLP fingerprinting. Genet. Resour. Crop Evol. 1997;44:185–195. doi: 10.1023/A:1008693214629. [DOI] [Google Scholar]
- 15.Pude R., Treseler C.H., Noga G. Morphological, chemical and technical parameters of Miscanthus genotypes. J. Appl. Bot. 2004;78:58–63. [Google Scholar]
- 16.Pude R., Treseler C.H., Trettin R., Noga G. Suitability of Miscanthus genotypes for lightweight concrete. Die Bodenkultur. 2005;56:61–69. [Google Scholar]
- 17.Dahmen N., Lewandowski I., Zibek S., Weidtmann A. Integrated lignocellulosic value chains in a growing bioeconomy: Status quo and perspectives. GCB Bioenerg. 2019;11:107–117. doi: 10.1111/gcbb.12586. [DOI] [Google Scholar]
- 18.Clifton-Brown J., Breuer J., Jones M.B. Carbon mitigation by the energy crop Miscanthus. Glob. Chang. Biol. 2007;13:2296–2307. doi: 10.1111/j.1365-2486.2007.01438.x. [DOI] [Google Scholar]
- 19.Clifton-Brown J.C., Lewandowski I., Andersson B., Basch G., Christian D.G., Kjeldsen J.B., Jørgensen U., Mortensene J.V., Riched A.B., Schwarz K.U., et al. Performance of 15 Miscanthus Genotypes at Five Sites in Europe. Agron. J. 2011;93:1013–1019. doi: 10.2134/agronj2001.9351013x. [DOI] [Google Scholar]
- 20.Kamm B., Kamm M., Hirth T., Schulze M. Lignocelluloses Based Chemical Products and Product Family Trees. In: Kamm M., Kamm B., Gruber P.C., editors. Biorefineries-Industrial Processes and Products. Wiley-VCH; Weinheim, Germany: 2006. pp. 97–150. [Google Scholar]
- 21.Kamm B., Gruber P.R., Kamm M. Ullmann’s Encyclopedia of Industrial Chemistry. Wiley-VCH; Weinheim, Germany: 2016. Biorefineries-Industrial Processes and Products. [Google Scholar]
- 22.Alzagameem A., El Khaldi-Hansen B., Kamm B., Schulze M. Lignocellulosic biomass for energy, biofuels, biomaterials, and chemicals. In: Vaz S. Jr., editor. Biomass and Green Chemistry. 1st ed. Springer International Publishing; Basel, Switzerland: 2018. pp. 95–132. [DOI] [Google Scholar]
- 23.Kraska T., Kleinschmidt B., Weinand J., Pude R. Cascading use of Miscanthus as growing substrate in soilless cultivation of vegetables (tomatoes, cucumbers) and subsequent direct combustion. Sci. Hortic. 2018;235:205–213. doi: 10.1016/j.scienta.2017.11.032. [DOI] [Google Scholar]
- 24.Winzer F., Kraska T., Elsenberger C., Kötter T., Pude R. Biomass from fruit trees for combined energy and food production. Biomass Bioenergy. 2017;107:279–286. doi: 10.1016/j.biombioe.2017.10.027. [DOI] [Google Scholar]
- 25.Hemansi Gupta R., Yadav G., Kumar G., Yadav A., Saini J.K., Kuhad R.C. Second Generation Bioethanol Production: The State of Art. In: Srivastava N., Srivastava M., Mishra P., Upadhyay S., Ramteke P., Gupta V., editors. Sustainable Approaches for Biofuels Production Technologies. Biofuel and Biorefinery Technologies. Volume 7. Springer International Publishing; Heidelberg, Germany: 2019. pp. 121–146. [Google Scholar]
- 26.de Vrije T., de Haas G.G., Tan G.B., Keijsers E.R.P., Claassen P.A.M. Pretreatment of Miscanthus for hydrogen production by Thermotoga elfii. Int. J. Hydrogen Energy. 2002;27:1381–1390. doi: 10.1016/S0360-3199(02)00124-6. [DOI] [Google Scholar]
- 27.Kjeldsen J.B., Joergensen U., Kristensen E.F. Thatching: Use of Miscanthus. Danmarks Jordbrugsforskning; Foulum, Denmark: 1999. DJF Rapport. [Google Scholar]
- 28.Wagenaar B.M., van den Heuvel E. Co-combustion of Miscanthus in a pulverised coal combustor: Experiments in a droptube furnace. Biomass Bioenergy. 1997;12:185–197. doi: 10.1016/S0961-9534(97)00009-3. [DOI] [Google Scholar]
- 29.Khelfa A., Sharypov V., Finqueneisel G., Weber J.V. Catalytic pyrolysis and gasification of Miscanthus Giganteus: Haematite (Fe2O3) a versatile catalyst. J. Anal. Appl. Pyrolysis. 2009;84:84–88. doi: 10.1016/j.jaap.2008.11.009. [DOI] [Google Scholar]
- 30.Velasquez J.A., Ferrando F., Farriol X., Salvado J. Binderless fiberboard from steam exploded Miscanthus sinensis. Wood Sci. Technol. 2003;37:269–278. doi: 10.1007/s00226-003-0182-8. [DOI] [Google Scholar]
- 31.Vega A., Bao M., Lamas J. Application of factorial design to the modelling of organosolv delignification of Miscanthus sinensis (elephant grass) with phenol and dilute acid solutions. Bioresour. Technol. 1997;61:1–7. doi: 10.1016/S0960-8524(96)00056-9. [DOI] [Google Scholar]
- 32.El Hage R., Brosse N., Chrusciel L., Sanchez C., Sannigrahi P., Ragauskas A. Characterization of milled wood lignin and ethanol organosolv lignin from miscanthus. Polym. Degrad. Stab. 2009;94:1632–1638. doi: 10.1016/j.polymdegradstab.2009.07.007. [DOI] [Google Scholar]
- 33.El Hage R., Perrin D., Brosse N. Effect of the pre-treatment severity on the antioxidant properties of ethanol organosolv Miscanthus × giganteus lignin. Nat. Resour. 2012;3:29–34. doi: 10.4236/nr.2012.32005. [DOI] [Google Scholar]
- 34.El Hage R., Brosse N., Sannigrahi P., Ragauskas A. Effects of process severity on the chemical structure of Miscanthus ethanol organosolv lignin. Polym. Degrad. Stab. 2010;95:997–1003. doi: 10.1016/j.polymdegradstab.2010.03.012. [DOI] [Google Scholar]
- 35.Chan J.M.W., Bauer S., Sorek H., Sreekumar S., Wang K., Toste F.D. Studies on the vanadium-catalyzed nonoxidative depolymerization of Miscanthus giganteus-derived lignin. ACS Catal. 2013;3:1369–1377. doi: 10.1021/cs400333q. [DOI] [Google Scholar]
- 36.Luo H., Klein I.M., Jiang Y., Zhu H., Liu B., Kenttämaa H.I., Abu-Omar M.M. Total Utilization of Miscanthus Biomass, Lignin and Carbohydrates, Using Earth Abundant Nickel Catalyst. ACS Sustain. Chem. Eng. 2016;4:2316–2322. doi: 10.1021/acssuschemeng.5b01776. [DOI] [Google Scholar]
- 37.Vanderghem C., Richel A., Jacquet N., Blecker C., Paquot M. Impact of formic/acetic acid and ammonia pre-treatments on chemical structure and physico-chemical properties of Miscanthus x giganteus lignins. Polym. Degrad. Stab. 2011;96:1761–1770. doi: 10.1016/j.polymdegradstab.2011.07.022. [DOI] [Google Scholar]
- 38.Timilsena Y.P., Abeywickrama C.J., Rakshit S.K., Brosse N. Effect of different pretreatments on delignification pattern and enzymatic hydrolysability of miscanthus, oil palm biomass and typha grass. Bioresour. Technol. 2013;135:82–88. doi: 10.1016/j.biortech.2012.09.010. [DOI] [PubMed] [Google Scholar]
- 39.Jin X., Chen X., Shi C., Li M., Guan Y., Yeon C., Yamada Y.T., Sacks E.J., Peng J. Determination of hemicellulose, cellulose and lignin content using visible and near infrared spectroscopy in Miscanthus sinensis. Bioresour. Technol. 2017;241:603–609. doi: 10.1016/j.biortech.2017.05.047. [DOI] [PubMed] [Google Scholar]
- 40.van der Weijde T., Kiesel A., Iqbal Y., Muylle H., Dolstra O., Visser R.G.F., Lewandowski I., Trindade L.M. Evaluation of Miscanthus sinensis biomass quality as feedstock for conversion into different bioenergy products. GCB Bioenergy. 2016;9:176–190. doi: 10.1111/gcbb.12355. [DOI] [Google Scholar]
- 41.Baker P.W., Winters A., Hale M.D.C. Biodegradation of Different Genotypes of Miscanthus by Wood Rot Fungi. BioResources. 2016;11:4379–4391. doi: 10.15376/biores.11.2.4379-4391. [DOI] [Google Scholar]
- 42.Ion S., Opris C., Cojocaru B., Tudorache M., Zgura I., Galca A.C., Bodescu A.M., Enache M., Maria G., Parvulescu V.I. One-Pot Enzymatic Production of Lignin-Composites. Front. Chem. 2018;6:124. doi: 10.3389/fchem.2018.00124. [DOI] [PMC free article] [PubMed] [Google Scholar]
- 43.Sonnenberg A.M., Baars J.J.P., Visser M.H.M., Lavrijssen B., Hendrickx P.M. Evaluation of Shiitake Strains (Lentinula edodes) on Selective Lignin Degradation in Miscanthus × giganteus. Wageningen UR, Plant Breeding; Wageningen, The Netherlands: 2016. [Google Scholar]
- 44.da Costa R.M.F., Lee S.J., Allison G.G., Hazen S.P., Winters A., Bosch M. Genotype, development and tissue-derived variation of cell-wall properties in the lignocellulosic energy crop Miscanthus. Ann. Bot. 2014;114:1265–1277. doi: 10.1093/aob/mcu054. [DOI] [PMC free article] [PubMed] [Google Scholar]
- 45.Iqbal Y., Lewandowski I. Inter-annual variation in biomass combustion quality traits over five years in fifteen Miscanthus genotypes in south Germany. Fuel Process. Technol. 2014;121:47–55. doi: 10.1016/j.fuproc.2014.01.003. [DOI] [Google Scholar]
- 46.Ralph J., Landucci L. Lignin and Lignans: Advances in Chemistry. Taylor & Francis; Boca Raton, FL, USA: 2010. NMR of lignins; pp. 137–244. [Google Scholar]
- 47.Lupoi J.S., Singh S., Parthasarathi R., Simmons B.A., Henry R.J. Recent innovations in analytical methods for the qualitative and quantitative assessment of lignin. Renew. Sustain. Energy. Rev. 2015;49:871–906. doi: 10.1016/j.rser.2015.04.091. [DOI] [Google Scholar]
- 48.Tarasov D., Leitch M., Fatehi P. Lignin–carbohydrate complexes: Properties, applications, analyses, and methods of extraction: A review. Biotechnol. Biofuels. 2018;11:269. doi: 10.1186/s13068-018-1262-1. [DOI] [PMC free article] [PubMed] [Google Scholar]
- 49.Li M., Pu Y., Ragauskas A.J. Current Understanding of the Correlation of Lignin Structure with Biomass Recalcitrance. Front. Chem. 2016;4:45. doi: 10.3389/fchem.2016.00045. [DOI] [PMC free article] [PubMed] [Google Scholar]
- 50.Lang J.M., Shrestha U.M., Dadmun M. The Effect of Plant Source on the Properties of lignin-Based Polyurethanes. Front. Energy Res. 2018;6:4. doi: 10.3389/fenrg.2018.00004. [DOI] [Google Scholar]
- 51.Klein S.E., Rumpf J., Kusch P., Albach R., Rehahn M., Witzleben S., Schulze M. Utilization of Unmodified Kraft Lignin for the Preparation of Highly Flexible and Transparent Polyurethane Coatings. RSC Adv. 2018;8:40765–40777. doi: 10.1039/C8RA08579J. [DOI] [PMC free article] [PubMed] [Google Scholar]
- 52.Klein S.E., Rumpf J., Rehahn M., Witzleben S., Schulze M. Biobased Flexible Polyurethane Coatings Prepared from Kraft Lignin: One-Pot Synthesis and Antioxidant Activity. J. Coat. Technol. Res. 2019 in press. [Google Scholar]
- 53.Witzler M., Alzagameem A., Bergs M., El Khaldi-Hansen B., Klein S.E., Hielscher D., Kamm B., Kreyenschmidt J., Tobiasch E., Schulze M. Lignin-Derived Biomaterials for Drug Release and Tissue Engineering. Molecules. 2018;23:1885. doi: 10.3390/molecules23081885. [DOI] [PMC free article] [PubMed] [Google Scholar]
- 54.Groenewold G.S., Johnson K.M., Fox S.C., Rae C., Zarzana C.A., Kersten B.R., Rowe S.M., Westover T.L., Gresham G.L., Emerson R.M. Pyrolysis Two-Dimensional GC-MS of Miscanthus Biomass: Quantitative Measurement using an Internal Standard Method. Energy Fuels. 2017;31:1620–1630. doi: 10.1021/acs.energyfuels.6b02645. [DOI] [Google Scholar]
- 55.Bottcher A., Cesarino I., dos Santos A.B., Vicentini R., Mayer J.L.S., Vanholme R., Morreel K., Goeminne G., Moura J.C.M.S., Nobile P.M., et al. Lignification in sugarcane: Biochemical characterization gene discovery, and expression analysis in two genotypes contrasting for lignin content. Plant Physiol. 2013;163:1539–1557. doi: 10.1104/pp.113.225250. [DOI] [PMC free article] [PubMed] [Google Scholar]
- 56.Del Río J.C., Rencoret J., Prinsen P., Martinez A.T., Ralph J., Gutierrez A. Structural characterization of wheat straw lignin as revealed by analytical pyrolysis, 2D-NMR, and reductive cleavage methods. J. Agric. Food Chem. 2012;60:5922–5935. doi: 10.1021/jf301002n. [DOI] [PubMed] [Google Scholar]
- 57.Villaverde J.J., Li J., Ek M., Ligero P., Vega A.D. Native lignin structure of Miscanthus × giganteus and its changes during acetic and formic acid fractionation. J. Agric. Food Chem. 2009;57:6262–6270. doi: 10.1021/jf900483t. [DOI] [PubMed] [Google Scholar]
- 58.Boerjan W., Ralph J., Baucher M. Lignin biosynthesis. Annu. Rev. Plant Biol. 2003;54:519–546. doi: 10.1146/annurev.arplant.54.031902.134938. [DOI] [PubMed] [Google Scholar]
- 59.Kukkola E.M., Koutaniemi S., Pollanen E., Gustafsson M., Karhunen P., Lundell T.K., Saranpaa P., Kilpelainen I., Teeri T.H., Fagerstedt K.V. The dibenzodioxocin lignin substructure is abundant in the inner part of the secondary wall in Norway spruce and silver birch xylem. Planta. 2004;218:497–500. doi: 10.1007/s00425-003-1107-3. [DOI] [PubMed] [Google Scholar]
- 60.Argyropoulos D.S., Jurasek L., Kristofova L., Xia Z., Sun Y., Palus E. Abundance and reactivity of dibenzodioxocins in softwood lignin. J. Agric. Food Chem. 2002;50:658–666. doi: 10.1021/jf010909g. [DOI] [PubMed] [Google Scholar]
- 61.Wang S., Dai G., Yang H., Luo Z. Lignocellulosic biomass pyrolysis mechanism: A state-of-the-art review. Prog. Energy Combust. Sci. 2017;62:33–86. doi: 10.1016/j.pecs.2017.05.004. [DOI] [Google Scholar]
- 62.Li Z., Zhao C., Zha Y., Wan C., Si S., Liu F., Zhang R., Li F., Yu B., Yi Z., et al. The minor wall-networks between monolignols and interlinked-phenolics predominantly affect biomass enzymatic digestibility in Miscanthus. PLoS ONE. 2014;9:e105115. doi: 10.1371/journal.pone.0105115. [DOI] [PMC free article] [PubMed] [Google Scholar]
- 63.Lan W., Yue F., Rencoret J., Carlos del Río J., Boerjan W., Lu F., Ralph J. Elucidating Tricin-Lignin Structures: Assigning Correlations in HSQC Spectra of Monocot Lignins. Polymers. 2018;10:916–922. doi: 10.3390/polym10080916. [DOI] [PMC free article] [PubMed] [Google Scholar]
- 64.Monakhova Y., Diehl B.W.K., Do X.T., Witzleben S., Schulze M. Novel method for the determination of average molecular weight of natural polymers based on 2D DOSY NMR and chemometrics: Example of heparin. J. Pharm. Biomed. Anal. 2018;149:128–132. doi: 10.1016/j.jpba.2017.11.016. [DOI] [PubMed] [Google Scholar]
- 65.Boeriu C.G., Bravo D., Gosselink R.J.A., van Dam J.E.G. Characterisation of structure-dependent functional properties of Lignin with infrared spectroscopy. Ind. Crops Prod. 2004;20:205–218. doi: 10.1016/j.indcrop.2004.04.022. [DOI] [Google Scholar]
- 66.Chen H., Ferrari C., Angiuli M., Yao J., Raspi C., Bramanti E. Qualitative and quantitative analysis of wood samples by Fourier transform infrared spectroscopy and multivariate analysis. Carbohydr. Polym. 2010;82:772–778. doi: 10.1016/j.carbpol.2010.05.052. [DOI] [Google Scholar]
- 67.Christou C., Agapiou A., Kokkinofta R. Use of FTIR spectroscopy and chemometrics for the classification of carobs origin. J. Adv. Res. 2018;10:1–8. doi: 10.1016/j.jare.2017.12.001. [DOI] [PMC free article] [PubMed] [Google Scholar]
- 68.Wahid R., Nielsen S.F., Hernandez V.M., Ward A.J., Gislum R., Jørgensen U., Møller H.B. Methane production potential from Miscanthus sp: Effect of harvesting time, genotypes and plant fractions. Biosyst. Eng. 2015;133:71–80. doi: 10.1016/j.biosystemseng.2015.03.005. [DOI] [Google Scholar]
- 69.Bergs M. Ph.D. Thesis. Rheinische Friedrich-Wilhelms-Universität Bonn; Bonn, Germany: Dec 20, 2018. Einfluss von Miscanthus-Genotyp und Erntezeit auf Gehalt und Struktur von Lignin aus Organosolv-Verfahren. [Google Scholar]
- 70.Hafez I., Hassan E.B. Rapid liquefaction of giant miscanthus feedstock in ethanol–water system for production of biofuels. Energy Conv. Manag. 2015;91:219–224. doi: 10.1016/j.enconman.2014.12.016. [DOI] [Google Scholar]
- 71.Scagline-Mellor S., Griggs T., Skousen J., Wolfrum E., Holásková I. Switchgrass and Giant Miscanthus Biomass and Theoretical Ethanol Production from Reclaimed Mine Lands. Bioenergy Res. 2018;11:562–573. doi: 10.1007/s12155-018-9915-2. [DOI] [Google Scholar]
- 72.Sørensen A., Teller P.J., Hilstrøm T., Ahring B.K. Hydrolysis of Miscanthus for bioethanol production using dilute acid presoaking combined with wet explosion pre-treatment and enzymatic treatment. Bioresour. Technol. 2008;99:6602–6607. doi: 10.1016/j.biortech.2007.09.091. [DOI] [PubMed] [Google Scholar]
- 73.Cha Y.-L., An G.H., Yang J., Moon Y.-H., Yu G.-D., Ahn J.-W. Bioethanol production from Miscanthus using thermotolerant Saccharomyces cerevisiae mbc 2 isolated from the respiration-deficient mutants. Renew. Energy. 2015;80:259–265. doi: 10.1016/j.renene.2015.02.016. [DOI] [Google Scholar]
- 74.Yang H., Yan R., Chen H., Lee D.H., Zheng C. Characteristics of hemicellulose, cellulose and lignin pyrolysis. Fuel. 2007;86:1781–1788. doi: 10.1016/j.fuel.2006.12.013. [DOI] [Google Scholar]
- 75.Schorr D., Diouf P.N., Stevanovic T. Evaluation of industrial lignins for biocomposites production. Ind. Crops Prod. 2014;52:65–73. doi: 10.1016/j.indcrop.2013.10.014. [DOI] [Google Scholar]
- 76.Bauer S., Sorek H., Mitchell V.D., Ibáñez A.B., Wemmer D.E. Characterization of Miscanthus giganteus lignin isolated by ethanol organosolv process under reflux condition. J. Agric. Food Chem. 2012;60:8203–8212. doi: 10.1021/jf302409d. [DOI] [PubMed] [Google Scholar]
- 77.Hansen B., Kusch P., Schulze M., Kamm B. Qualitative and quantitative analysis of lignin produced from beech wood by different conditions of the Organosolv process. J. Polym. Environ. 2016;24:85–97. doi: 10.1007/s10924-015-0746-3. [DOI] [Google Scholar]
- 78.Hansen B., Kamm B., Schulze M. Qualitative and quantitative analysis of lignins from different sources and isolation methods for an application as a biobased chemical resource and polymeric material. In: Vaz S. Jr., Seidl P., editors. Analytical Techniques and Methods for Biomass Products. Springer; Berlin, Germany: 2017. pp. 15–44. [Google Scholar]
- 79.Brandt A., Chen L., van Dongen B.E., Welton T., Hallett J.P. Structural changes in lignins isolated using an acidic ionic liquid water mixture. Green Chem. 2015;17:5019–5034. doi: 10.1039/C5GC01314C. [DOI] [Google Scholar]
- 80.Alzagameem A., El Khladi-Hansen B., Büchner D., Larkins M., Kamm B., Witzleben S., Schulze M. Environmentally Benign Lignin-based Antioxidants isolated from Lignocellulose Feedstock. Molecules. 2018;23:2664. doi: 10.3390/molecules23102664. [DOI] [PMC free article] [PubMed] [Google Scholar]
- 81.Fenner R.A., Lephardt J.O. Examination of the thermal decomposition of kraft pine lignin by Fourier transform infrared evolved gas analysis. J. Agric. Food Chem. 1981;29:846–849. doi: 10.1021/jf00106a042. [DOI] [Google Scholar]
- 82.Norambuena M., Vidal C., Carrasco L., Contreras D., Mendonça R.T. Alkaline-catalyzed Modification of Organosolv Lignin: Optimization of Experimental Conditions; Proceedings of the 5rd Nordic Wood Biorefinery Conference (NWBC 2015); Helsinki, Finland. 20–22 October 2015. [Google Scholar]
- 83.Domínguez C., Oliet M., Gilarranz M.A., Rodríguez F. Thermal stability and pyrolysis kinetics of organosolv lignins obtained from Eucalyptus globulus. Ind. Crops Prod. 2008;27:150–156. doi: 10.1016/j.indcrop.2007.07.006. [DOI] [Google Scholar]
- 84.Wittkowski R., Ruther J., Drinda H., Rafiei-Taghanaki F. Formation of Smoke Flavor Compounds by Thermal Lignin Degradation. ACS Symp. Ser. 1992;490:232–243. [Google Scholar]
- 85.El-Saied H., Nada A.M.A. The thermal behaviour of lignins from wasted black pulping liquors. Polym. Degrad. Stab. 1993;40:417–421. doi: 10.1016/0141-3910(93)90152-9. [DOI] [Google Scholar]
- 86.Glasser W.G., Jain R.K. Lignin derivatives. I. Alkanoates. Holzforschung. 1993;47:225–233. doi: 10.1515/hfsg.1993.47.3.225. [DOI] [Google Scholar]
- 87.Hodgson E.M., Nowakowski D.J., Shield I., Riche A., Bridgwater A.V., Clifton-Brown J.C., Donnison I.S. Variation in Miscanthus chemical composition and implications for conversion by pyrolysis and thermo-chemical bio-refining for fuels and chemicals. Bioresour. Technol. 2011;102:3411–3418. doi: 10.1016/j.biortech.2010.10.017. [DOI] [PubMed] [Google Scholar]
- 88.Hodgson E.M., Lister S.J., Bridgwater A.V., Clifton-Brown J., Donnison I.S. Genotypic and environmentally derived variation in the cell wall composition of Miscanthus in relation to its use as a biomass feedstock. Biomass Bioenergy. 2010;34:652–660. doi: 10.1016/j.biombioe.2010.01.008. [DOI] [Google Scholar]
- 89.Lourenço A., Gominho J., Pereira H. Chemical characterization of lignocellulosic materials by analytical pyrolysis. In: Kusch P., editor. Analytical Pyrolysis. 1st ed. IntechOpen; London, UK: 2018. [DOI] [Google Scholar]
- 90.Du X., Pérez-Boada M., Fernández C., Rencoret J., del Río J.C., Jiménez-Barbero J., Li J., Gutiérrez A., Martínez A.T. Analysis of lignin-carbohydrate and lignin-lignin linkages after hydrolase treatment of xylan-lignin, glucomannan-lignin and glucan-lignin complexes from spruce wood. Planta. 2014;239:1079–1090. doi: 10.1007/s00425-014-2037-y. [DOI] [PubMed] [Google Scholar]
- 91.Obama P., Ricochon G., Muniglia L., Brosse N. Combination of enzymatic hydrolysis and ethanol organosolv pretreatments: Effect of lignin structures, delignification yields and cellulose-to-glucose con-version. Bioresour. Technol. 2012;112:156–163. doi: 10.1016/j.biortech.2012.02.080. [DOI] [PubMed] [Google Scholar]
- 92.Grisel R.J.H., van der Waal J.C., de Jong E., Huijgen W.J.J. Acid catalysed alcoholysis of wheat straw: Towards second generation furan-derivatives. Catal. Today. 2014;223:3–10. doi: 10.1016/j.cattod.2013.07.008. [DOI] [Google Scholar]
- 93.Toledano A., Serrano L., Labidi J. Improving base catalyzed lignin depolymerization by avoiding lignin repolymerization. Fuel. 2014;116:617–624. doi: 10.1016/j.fuel.2013.08.071. [DOI] [Google Scholar]
- 94.Determination of Structural Carbohydrates and Lignin in Biomass. [(accessed on 10 October 2018)]; Available online: https://www.nrel.gov/docs/gen/fy13/42618.pdf.
- 95.Sluiter A., Hames B., Ruiz R., Scarlata C., Sluiter J., Templeton D., Crocker D. Determination of extractives in biomass. Lab. Anal. Proced. 2008;1617:1–16. [Google Scholar]
- 96.Sluiter A., Ruiz R., Scarlata C., Sluiter J., Templeton D. Determination of Extractives in Biomass (NREL/TP-510-42619) National Renewable Energy Laboratory; Golden, CO, USA: 2008. [Google Scholar]
- 97.Sluiter A., Hames B., Hyman D., Payne C., Ruiz R., Scarlata C., Sluiter J., Templeton D., Wolfe J. Determination of Total Solids in Biomass and Total Dissolved Solids in Liquid Process Samples. National Renewable Energy Laboratory; Golden, CO, USA: 2008. pp. 1–6. NREL Technical Report No. NREL/TP-510-42621. [Google Scholar]
- 98.Sluiter A., Hames B., Ruiz R., Scarlata C., Sluiter J., Templeton D. Determination of Ash in Biomass (NREL/TP-510-42622) National Renewable Energy Laboratory; Golden, CO, USA: 2005. [Google Scholar]
- 99.Cordella C.B.Y., Bertrand D. SAISIR: A new general chemometric toolbox. Trends Anal. Chem. 2014;54:75–82. doi: 10.1016/j.trac.2013.10.009. [DOI] [Google Scholar]
- 100.Martens H., Naes T. Multivariate calibration by data compression. In: William P., Noris K., editors. Near Infrared Technology in the Agriculture and Food Industries. American Association of Cereal Chemists; St. Paul, MN, USA: 1987. [Google Scholar]


