Abstract
The impact of the complex structure of the stratum corneum on transdermal penetration is not yet fully described by existing models. A quantitative and thorough study of skin permeation is essential for chemical exposure assessment and transdermal delivery of drugs. The objective of this study is to analyze the effects of heterogeneity, anisotropy, asymmetry, follicular diffusion, and location of the main barrier of diffusion on percutaneous permeation. In the current study, the solution of the transient diffusion through a two-dimensional-anisotropic brick-and-mortar geometry of the stratum corneum is obtained using the commercial finite element program COMSOL Multiphysics. First, analytical solutions of an equivalent multilayer geometry are used to determine whether the lipids or corneocytes constitute the main permeation barrier. Also these analytical solutions are applied for validations of the finite element solutions. Three illustrative compounds are analyzed in these sections: diethyl phthalate, caffeine and nicotine. Then, asymmetry with depth and follicular diffusion are studied using caffeine as an illustrative compound. The following findings are drawn from this study: the main permeation barrier is located in the lipid layers; the flux and lag time of diffusion through a brick-and-mortar geometry are almost identical to the values corresponding to a multilayer geometry; the flux and lag time are affected when the lipid transbilayer diffusivity or the partition coefficients vary with depth, but are not affected by depth-dependent corneocyte diffusivity; and the follicular contribution has significance for low transbilayer lipid diffusivity, especially when flux between the follicle and the surrounding stratum corneum is involved. This study demonstrates that the diffusion is primarily transcellular and the main barrier is located in the lipid layers.
Keywords: Diffusion, Corneocyte, Lipid bilayers, Skin appendages, Partition coefficient, Lag time
1. Introduction
The main barrier for permeation through the skin resides in the stratum corneum (SC) [1]. The SC is heterogeneous [2], since it is composed of corneocytes surrounded by lipid layers and there is not a complete agreement on whether lipid layers or corneocytes are the main contributor to the permeability barrier [3]. It is now widely accepted that corneocytes are permeable and they should be included in the geometry of the permeation model [4–9]. The lipid layers are anisotropic—their permeability is direction-dependent—and this property greatly affects the diffusion characteristics in the skin [4].
The asymmetry of the SC with depth (termed vertical heterogeneity by some authors) has been demonstrated by detailed examination of its structure [9–12], by sorption and desorption tests [10], by in vivo noninvasive measurement data [13], by observations of the non-uniform SC swelling [6], and by in vitro study on intact and tape-stripped skin samples [14]. Asymmetry with depth could result from the increasing water content of the SC with depth, from 50% to 70% for fully hydrated SC and from 20% to 60% for partially hydrated SC [15], and this may imply an increase in the corneocyte diffusivity in the inner layers. Asymmetry, located in the lipid layers, is reflected by the decrease in the C–H stretch frequency associated with the lipid alkyl chains of outer layers of the SC [16]. A decrease in the lipid ordering may result in an increase in the lipid diffusivity in the outer layers. Watkinson et al. [17] tested the hypothesis of higher diffusivity in the surface of the skin with a model geometry of one and two isotropic slabs; they found that the concentration profiles when diffusivity is dependent on depth (diffusivity in the surface 3 times that of the inner layers) did not differ much from the profiles where diffusivity was kept constant with depth. Anissimov and Roberts [18] studied desorption with variable diffusion coefficients (linear, exponential, and two isotropic slab models) and variable partition coefficients (exponential, two slab, and exponential-constant models) and demonstrated that permeation is insensitive to diffusion and partition coefficient asymmetry. On the other hand, desorption flux could be explained by partition asymmetry. They concluded that partition coefficient asymmetry had more effect than diffusivity asymmetry and should be included when modeling tape-stripping data. Mueller et al. [19] measured experimentally a biphasic concentration profile of clobetasol propionate (a logarithmic decrease on the top four to five tape strips and a constant low concentration in the inner layers) concluding that a variable partition coefficient was the main cause for this unexpected result. Furthermore, asymmetry could be caused by the degraded state of a protein—corneodesmosin—in the outer layers of the SC, possibly increasing corneocytes uptake toward the surface of the SC [20]. All these previous studies use geometry of one or two isotropic slabs to represent the SC.
Skin appendages, hair follicles and sweat ducts, constitute another pathway of permeation [10]. In spite of their small relative area, estimated as 0.1% [21] of the total surface area, their importance is revealed from observations of permeability of ions, highly polar molecules, and high molecular weight compounds, especially in initial transient times [21,22]. The follicular contribution could be of about 50% [23] to 60% [24], as measured by a sandwich system technique based on simplified mathematical assumptions [25,26]. Otberg et al. [27] observed larger absorption of caffeine, in an in-vivo study, when skin follicles were left open versus blocked (follicular contribution 35%). Trauer et al. [28] found a 58% follicular penetration of caffeine. By differential stripping technique, 10% to 24% of the total amount of finasteride in the stripping tapes was found in the hair follicles [29]. A simplified mathematical analysis of the follicular pathway, presented early on by Scheuplein [21], demonstrates that the smaller the permeability of a compound the more significant the role of appendages becomes [30]. A detailed mathematical model of local diffusion of unionized chemical species through a single hair shaft with follicular sheath surrounded by SC, viable epidermis, and dermis shows a high follicular penetration into dermal tissue, in concordance with experimental in vitro data [31,32]. Dancik et al. [32] presented concentration profiles of model permeants into the surrounding skin for different scenarios of permeability, partition and concentration. Mitragotri et al. [33] analyzed the diffusion through shunts assuming a smaller area fraction of the appendages, 1 × 10⁻⁴ or 0.01% of the total surface, claiming sebum reduces the area available for transport.
The input parameters for a percutaneous permeation model are geometric descriptors, affinity parameters, and transport parameters. The geometric descriptors are obtained from measurements and microscopic models of the SC [34]. The affinity parameters are the lipid and corneocyte partition coefficients. They can be obtained experimentally [35–37]; or from correlations as a function of the octanol-water partition coefficient regressed to experimental partition coefficients [38–42]. The dependency of the partition coefficient values on the method being employed, was pointed out as a caveat for obtaining an accurate model of permeation [3]. The transport parameters are lipid and corneocyte diffusivities. In general, they are computed from physico-chemical properties of solutes with correlations to experimental data [38]. A wide range of values of lipid and corneocyte diffusivities have been used in previous models. Whether the lipid or corneocyte is the main barrier of diffusion will greatly influence the permeability results and needs to be studied prior to the analysis of the SC asymmetry and follicular penetration. In the pioneering works by Yotsuyanagi and Higuchi [43], Michaels et al. [44] and Tojo [45], the lipids were considered the main barrier for diffusion. In contrast, in the models by Heisig [46] and Naegel-Hansen [35,47] the corneocytes were the main barrier for diffusion. Johnson et al. [48] developed the first SC model with anisotropic lipid but only lipids were included in the geometry. Frasch [49] and Barbero and Frasch [50] explored a full range of values. Wang et al. [4,51] introduced anisotropy in the lipid layers mathematically represented with a lateral diffusivity and a mass transfer coefficient for transbilayer hopping, with the lipid phase being the main diffusion barrier. Chen et al.’s model (2008) [52–55] included an isotropic lipid phase with the corneocyte being the main barrier to diffusion. In summary, of the most recent models, Wang et al. [4,51] and Johnson et al. [48] models locate the main barrier in the lipid phase, while Naegel-Hansen [35,47] and Chen et al. [52–55] models consider the corneocyte phase as the leading barrier.
This work addresses some unresolved issues [38] related to the impact of the SC structure on functionality. The objectives of this study are: the analysis of the effect of the location of the main barrier of diffusion, the presence of asymmetry with depth, and the inclusion of the follicular pathway on percutaneous permeation. First, analytical solutions of diffusion through a heterogeneous multilayer geometry or multi-laminate (ML) with each layer been isotropic are presented. Then, a 2 dimensional (2D) brick and mortar (B & M) geometry with anisotropic lipid layers is solved using a commercial finite element package COMSOL Multiphysics®. The SC asymmetry is represented with depth-dependent diffusivity and partition coefficient. Finally, this work analyzes the contribution of diffusion through appendages to total SC penetration.
2. Methods
2.1. Input parameters
A partition coefficient is defined as the ratio of concentrations of two phases at a boundary. Frequently, the partition coefficients are given with respect to water and the subscript w is often omitted. The lipid and corneocyte partition coefficients used in this study are defined as
| (1) |
where Clip is the concentration in the lipid, Cw is the concentration in water, Ccor is the concentration in the corneocyte, and Klip-cor the partition coefficient between lipid and corneocyte. In this study these parameters are computed with functions of the octanol-water partition coefficient Kow [35,38,40,42,56]. These relationships have a power law format as
| (2) |
where the parameters a and b are obtained from correlations to experimental data sets, and they are given in Table 1. Hansen et al. [38] presented a review of correlations from several authors, as well as their own correlations. The datasets used to compute the correlation parameters a and b are heavily dominated by lipophilic data [38]. In Wang et al. [51], Kcor includes a modified fiber volume fraction, but for the comparison with the present study it should be calculated with the protein partition coefficient and the water sorption volume [57]. The partitions included in Table 1 correspond to their Model 2, fully hydrated SC. In Chen et al. [52–55], for Kow ≥ 10, Kcor is computed with Eq. (2) but for Kow < 10, Kcor is computed as function of Klip, as shown in Table 1.
Table 1.
Parameters (volume-based) used to compute lipid and corneocyte partition coefficients from published works.
In this work, the partition coefficients, Kcor and Klip, are computed using the correlations from Hansen et al. [38] (from experimental data of 16 chemicals, r2 of 0.85). The weight-based parameters were converted to volume-based parameters multiplying by the specific density, 0.9 for lipid and 1.37 for protein. The expected range of partition coefficients, using Hansen’s correlations, for log Kow from −4 to 4, are 2 × 10⁻³ to 570 for Klip and 0.4 to 140 for Kcor.
The corneocyte diffusion coefficient Dcor is estimated with an expression from classical continuum theory in composite medium with fibrous inclusions considering the keratin fibers as non-accessible, as derived by Wang et al. [51].
| (3) |
where Daq is the diffusion coefficient in water calculated according to the Wilke–Chang relationship. The molecular volume VA is determined, according to the Schroeder’s method, by adding the number of atoms of each element and number of double or triple bonds (NC = number of Carbon atoms, NH = number of Hydrogen atoms, NDB = number of double bonds, NTB number of triple bonds, etc.) and the number of rings, if present, times the group contribution. The non-accessible fraction of the fibers φf is computed using λ, the ratio between the solute radius as and the fiber radius rfiber (taken as 35 A°) [58]. The solute radius as is considered a function of VA. Using Eq. (3) the expected range of values of Dcor is 1 × 10⁻⁶ to 1 × 10⁻⁵ cm2/s for a wide range of molecular volumes. On the contrary, the corneocyte diffusivity in Chen et al. [52–55] ranges from 1.4 × 10⁻¹² to 6.6 × 10⁻¹¹ cm2/s and includes hindrance parameters adjusted to match permeability data.
Since the lipid is anisotropic–composed of multiple bilayers–two diffusion coefficients are required: one parallel to lipid bilayers long direction (named lateral) Dlip-lat and another perpendicular to the lipid bilayers (named trans) Dlip-trans. The diffusivity in the lateral direction is commonly calculated as a function of the molecular weight (MW). In this study the equation derived by Wang et al. [4,51], based on Fluorescence Recovery after Photo bleaching and Electron Para-magnetic Resonance data, and arranged by Hansen et al. [38] is used:
| (4) |
The expected values of Dlip-lat, with MW ranging from 500 to 100, are from 5 × 10⁻⁹ to 1 × 10⁻⁷ cm2/s. On the contrary, Chen et al. [53], assumes the lipid is isotropic and computes the diffusivity in the lipid phase by the model developed by Mitragotri [33] which renders a range of diffusivities from 6 × 10⁻¹⁰ to 6 × 10⁻⁷ cm2/s for MW ranging from 500 to 100.
To our knowledge there are no correlations to compute the transbilayer lipid diffusivity Dlip-trans as a function of physico-chemical properties or experimental parameters. From studies of phospholipid transport through bilayers [59,60], it is demonstrated that the rate of lateral diffusion is much faster than that of transbilayer transport (up to 9 orders of magnitude), i.e., Dlip-trans is expected to be much smaller than Dlip-lat. Two authors have described the diffusion through the lipid bi-layers using a mass transfer coefficient, ktrans. Johnson et al. [48] assuming that the transbilayer transport resistance is much greater than the lateral diffusion, proposed an estimation of ktrans from the permeability value, the octanol-water partition coefficient and the number of bilayers. Similarly, Wang et al. [51] computed ktrans using their model in reverse, that is from measured SC permeability they calculated ktrans. Repeating this process for many chemicals they obtained the following correlation, specific for their particular model (named Model 2) considering hydrated SC, as a function of the molecular weight
| (5) |
Since the mass transfer occurs in a solid medium with concentrations varying with time and space, the flux is better described by a diffusion coefficient rather than a mass transfer coefficient, as discussed by Cussler [61]. In the present study, a range of values for the transbilayer lipid diffusion coefficients is proposed and the results from parametric sweeps are compared with experimental data of flux and lag time. Just for comparison, the transbilayer lipid diffusivity can be approximated by the product of the mass transfer coefficient times the thickness of the bilayers, which was measured as δ = 13 nm [62].
| (6) |
Since the bilayers surround the corneocytes, two lipid anisotropic-diagonal diffusivity matrices are defined: the diffusivity of the lipid parallel to the surface of the skin, Dlip-p
| (7) |
and the diffusivity of the lipid perpendicular (vertical) to the surface of the skin, Dlip-v
| (8) |
where Dlip-lat is the diffusivity along the lipid bilayer computed with the relationship given by Eq. (4) and Dlip-trans the diffusivity perpendicular to the lipid bilayer (transbilayer). Since the flux is mainly perpendicular to the surface of the skin, the principal diffusivity in the lipid parallel to the skin surface is Dlip-trans while the principal diffusivity in the lipid perpendicular to the skin surface is Dlip-lat. The expected range of values of the transbilayer diffusivity, Dlip-trans is from 1 × 10⁻¹³ to 1 × 10⁻⁹ cm2/s (Eqs. (5) and (6)), for molecular weight from 500 to 18.
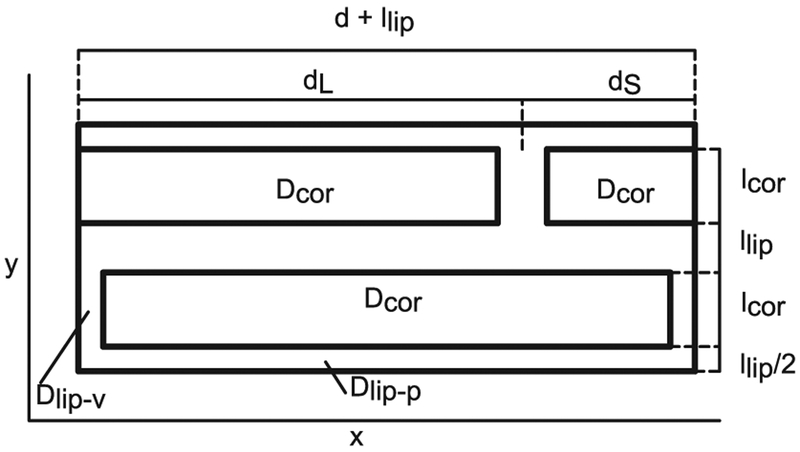
A unit cell of a B & M geometry is depicted not to scale in Fig. 1 with actual dimensions of a fully hydrated SC [4] given in Table 2.
Fig. 1.
B & M geometry, unit cell not to scale. Actual dimensions listed in Table 2.
Table 2.
Geometric descriptors of a fully hydrated SC used in SC models.
| Parameter | Description | Value | Units |
|---|---|---|---|
| Corneocyte thickness | lcor | 2.8 × 10⁻⁴ | cm |
| Lipid thickness | llip | 9.1 × 10⁻⁶ | cm |
| Corneocyte width | d | 0.00312 | cm |
| Overlap | ω = ds/dL | 0.19 | |
| Short overlap length | ds = (d + llip)ω/(1 + ω) | 5 × 10⁻⁴ | cm |
| Long overlap length | dL = (d + llip)/(1 + ω) | 0.0026 | cm |
| Lipid-corneocyte area ratio | ψ = llip(d + lcor + llip)/(d lcor) | 0.0355 | |
| Lipid-total area fraction | Φlip = ψ/(ψ + 1) | 0.0343 |
2.2. Diffusion in a multilayer geometry
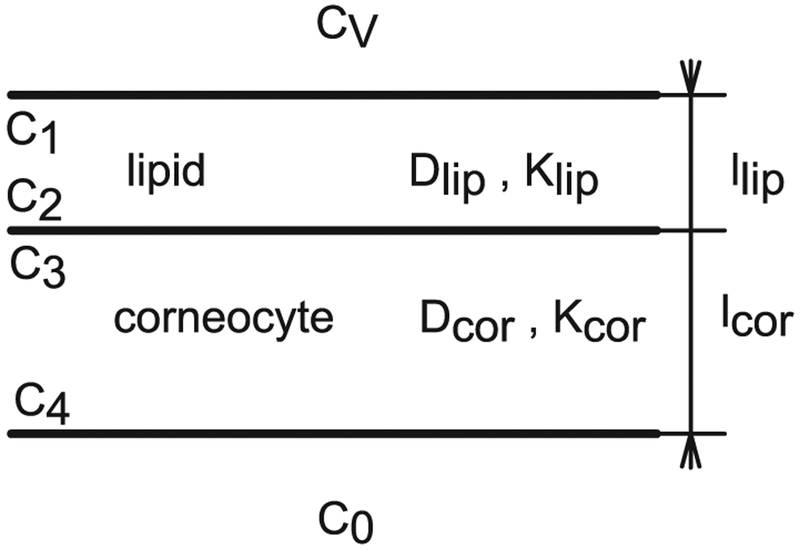
Observing the B & M geometry in Fig. 1 with the dimensions given in Table 2, the SC structure could be approximated by a multi-laminate geometry ML, as done previously [63–65]. The geometry for one pair of layers (one lipid layer and one corneocyte layer), also identified as AB pair [66], is depicted in Fig. 2. The equations that describe the flux and lag time of diffusion through ML structures were derived to study the diffusion and solution of gases in composite rubber membranes [66].
Fig. 2.
ML geometry not to scale with one pair of layers, n = 1.
For n = 1 pair of lipid-corneocyte layers the steady state flux JSS can be easily computed by equating the flux in each layer, assuming sink conditions in the bottom (C0 = C4 = 0), and using the partition coefficient relationship between layers as
| (9) |
Eq. (9) can be written as a function of the concentration inside the first layer C1 or the concentration in the vehicle Cv, and care should be taken in using the correct expression. If the model considers an aqueous vehicle and a uniform outer layer of lipids in the SC, then Cv = C1/Klip. Eq. (9) is also applicable when the corneocyte layer is the top layer. The lag time, τ, has been derived for permeation thru membranes [66] and for n = 1 is
| (10) |
For n pairs of lipid-corneocyte layers, the steady state flux Jss n is
| (11) |
the equivalent diffusivity Deq is
| (12) |
the permeability kp n
| (13) |
and the lag time of diffusion τn [67] is
| (14) |
Eq. (14) can be rearranged as the sum of two terms corresponding to the first and following pairs of layers [67]
| (15) |
Eqs. (11) to (15) can be used to approximate transcellular diffusion if more sophisticated methods of solution are not available. These algebraic equations and variations thereof will be used to estimate the effect of the location of the main barrier of diffusion on percutaneous permeation and for verification of the solutions obtained with COMSOL.
2.3. Diffusion in a brick-and-mortar geometry
B & M geometries have been used to simulate the SC, and this con-figuration allows for the inclusion of more details present in the SC structure than the ML geometry. A unit cell of the B & M geometry is depicted in Fig. 1. It has in total two layers of corneocytes and two layers of lipids and an overlap ω = dS/dL, which is often taken as 0.19 [4], with d the corneocyte width, dS the short overlap and dL the long overlap. The geometry selected here to represent the SC is idealized-rectangular since the objective of this article is to compare the relative effect of different input parameter values and the presence or absence of a follicular pathway. The complete SC geometry is composed of 7 unit cells through the thickness, a total of 14 pairs of lipid-corneocyte layers. A half-thickness lipid layer is included at the top of the SC in contact with the donor and another at the bottom of the SC where the sink condition is applied. Note that this leads to using the lipid partition coefficient to calculate the concentration inside the SC from the concentration in the vehicle, and for an aqueous vehicle then, Cv = C1/Klip. COMSOL Multiphysics (version 4.4 Comsol, Inc., Burlington, MA) is selected to solve this model because it allows for modeling of complicated geometries with nonlinear boundary conditions, variable parameters and transient solutions with easy implementation of parametric sweeps.
The presence of a partition coefficient creates a concentration discontinuity in the corneocyte-lipid boundary described by Eq. (1). In the finite element method of solution each point in space or node has a unique set of properties. There are different techniques to assign this discontinuity to a node or boundary: applying a change of variables in concentration for each medium [68,69], using the stiff-spring method [70], or other techniques [71]. The stiff-spring method is used in this study. The continuous flux equation in the corneocyte-lipid boundary is given below.
| (16) |
2.4. Brick-and-mortar model implementation in COMSOL Multiphysics
A 2D B & M model is created in COMSOL Multiphysics. Chemical species with transport of diluted species and time-dependent study are the physics selected. The input parameters are entered in the global definitions. The geometry is created and the average flux in the bottom and the integral of the flux are defined. The diffusion is described by
| (17) |
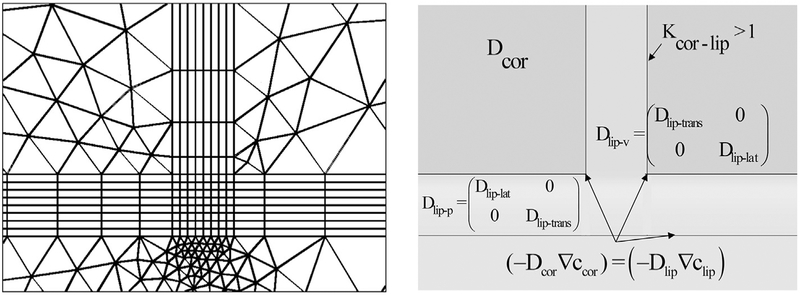
Where i = lip or cor, c is concentration, t is time, D is diffusivity and R is reaction (equal to zero in the present study since no binding or reactions are considered). The lipid domains are selected from the geometry and the corresponding diffusivities, internal boundary conditions between layers, periodicity conditions, and external boundary conditions (donor concentration in the top and the sink condition in the bottom) are applied. The process is repeated for the corneocytes. All domains are meshed, starting with the lipid layers. Mapped mesh (quadrilateral) is used for the lipid layers and free mesh (no restrictions in element shape) for the corneocytes. A snapshot of the mesh geometry as well as the diffusivities and internal boundary conditions are given in Fig. 3.
Fig. 3.
Finite element mesh and parameters used in finite element solutions of brick-and-mortar (B & M) models.
The computation of the transient solution with COMSOL requires start, step, and end-time values. The end-time T is estimated as 10 times the lag time computed with Eq. (14) for a ML geometry and the step as 1/1000 of the end-time. Ten lag times more than satisfy the rule of approximation to steady state of at least 0.45 l2/D [72]. Parametric runs over different values of Dlip-trans are set up in the study definition. The average flux in the bottom, JSS, and the time integral of the flux, QT, are computed. The lag time is then calculated as [73]
| (18) |
The flux and lag time computed using COMSOL are validated by comparison with analytical solutions, Eqs. (11) and (14), for the same ML geometry.
2.5. Diffusion with depth-dependent asymmetry
Three scenarios involving asymmetry are explored: 1) the corneocyte diffusivity higher toward the inner layers, due to the increase in the water content with depth, 2) the lipid diffusivity higher toward the surface of the skin, due to a decrease in the ordering of the lipids in the outer layers and 3) the corneocyte-lipid partition variation with depth: coefficient higher toward the surface of the skin, Kcor-lip-s > Kcor-lip-0 and vice versa Kcor-lip-s < Kcor-lip-0. These parameters are varied independently, with a linear equation.
| (19) |
where F represents corneocyte diffusivity, lipid diffusivity or partition coefficient. F0 is the parameter at the base of the SC, FS the one in the surface of the SC, y the coordinate (zero at the base of the SC), and l the SC thickness.
To compare with previous studies [17,18], a variable diffusivity with depth is applied to a “homogeneous” SC geometry. To evaluate the effect of asymmetry an equivalent diffusivity Deq* is computed from the flux obtained using a variable diffusivity
| (20) |
The model is run with this constant Deq* value and the results are compared to those resulting from depth-dependent diffusivity.
To evaluate the effect of asymmetry with a heterogeneous B & M geometry, an equivalent parameter in the specific medium of study needs to be calculated. The equivalent parameter will be computed as the midpoint between the two extremes (FS + F0)/2, the log midpoint (log FS + log F0)/2, using Eq. (11) with the flux obtained using a depth-dependent diffusivity with depth, or using Eq. (15) with the lag time obtained using a depth-dependent partition.
2.6. Diffusion through follicular appendages
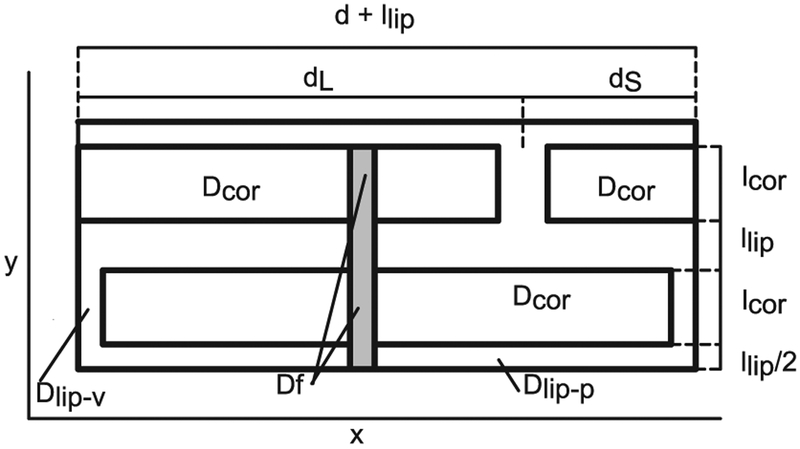
The study of the transport through skin appendages is done here adding an appendage with an area equivalent to the follicular fraction, as shown in Fig. 4. It has to be noted that this simplified approach is used only for comparisons, and not for quantitative evaluations of the follicular permeation.
Fig. 4.
B & M geometry with follicle.
An approximation of the steady state flux including follicular pathway can be computed as the sum of the flux in the follicle times the area fraction of the follicle f plus the flux in the rest of the ML geometry times (1 − f),
| (21) |
Eq. (21) is approximately equivalent to the case where there is no flux between the follicle and the rest of the SC. This approximated solution is a mathematical representation of the simplified analysis of the follicular pathway presented by Scheuplain [21]. The permeation through a B & M geometry with follicle diffusivity Df (grey area in Fig. 4) with flux in the SC-follicle boundary as described in Eq. (16) is compared to the solutions of B & M geometry without follicle to evaluate the follicular contribution. To describe the contribution through appendages authors use follicle flux fraction FF = (Jwf/Jwof), that is ratio of flux with follicle Jwf to flux without follicle Jwof or follicular contribution percent %FC = (Jf/Jwf) × 100 referring to flux in the follicle Jf to total flux with follicle Jwf. These expressions are related as %FC = 100 × (FF − 1)/FF. The effect of follicular penetration on the lag time is described by the lag time reduction caused by the follicular pathway, that is % τred = 100 × (τwof − τwf)/τwof.
2.7. Input parameters of illustrative compounds
Three chemicals are used as illustrative examples: caffeine (CAF) log Kow = −0.07, nicotine (NIC) log Kow = 1.17, and diethyl phthalate (DEP) log Kow = 2.47. The input parameters used in the models are given in Table 3. In the present work a range of the transbilayer lipid diffusivity values is studied.
Table 3.
Input parameters used in the models.
| Parameter | CAF | NIC | DEP | Units |
|---|---|---|---|---|
| MWa | 194.19 | 162.24 | 222.24 | Da |
| VA Eq. (3) | 189 | 189 | 238 | |
| Log Kowa | −0.07 | 1.17 | 2.47 | |
| Kow | 0.85 | 14.79 | 295.12 | |
| Klip Eq. (2) with a, b Hansen et al. [38] | 1.07 | 7.22 | 53.76 | |
| Kcor Eq. (2) with a, b Hansen et al. [38] | 6.96 | 17.36 | 45.24 | |
| Dlip-lat Eq. (4) | 2.71 × 10⁻⁸ | 4.06 × 10⁻⁸ | 2.01 × 10⁻⁸ | cm2/s |
| Dcor Eq. (3) | 5.58 × 10⁻⁶ | 5.58 × 10⁻⁶ | 4.72 × 10⁻⁶ | cm2/s |
| Dlip-trans range | 1 × 10⁻¹⁴ to 1 × 10⁻⁶ | cm2/s | ||
Source: PubChem Open Chemistry Database (http://pubchem.ncbi.nlm.nih.gov/).
The permeability, flux and lag time from permeation experiments using human skin for CAF, NIC and DEP as well as the donor concentration are given in Table 4 and these values are in the range of other published experimental data.
Table 4.
Experimental donor concentration, steady state flux and lag time for diethyl phthalate [74], caffeine [74] and nicotine [75] used for comparisons in this work.
| Parameter | CAF | NIC | DEP | Units |
|---|---|---|---|---|
| Cv | 19,465 | 24,000 | 1019.8 | μg/ml |
| Jss | 2.95 ± 1.5 | 130 ± 60 | 21.0 ± 2.9 | μg/cm2h |
| τ | 2.3 ± 1.5 | 1.6 ± 0.5 | 0.66 ± 0.06 | h |
| kp | 1.516 × l0−4 | 5.42 × 10⁻³ | 2.06 × 10⁻² | cm/h |
3. Results and discussion
3.1. Diffusion in a multilayer geometry and analysis of the main barrier location
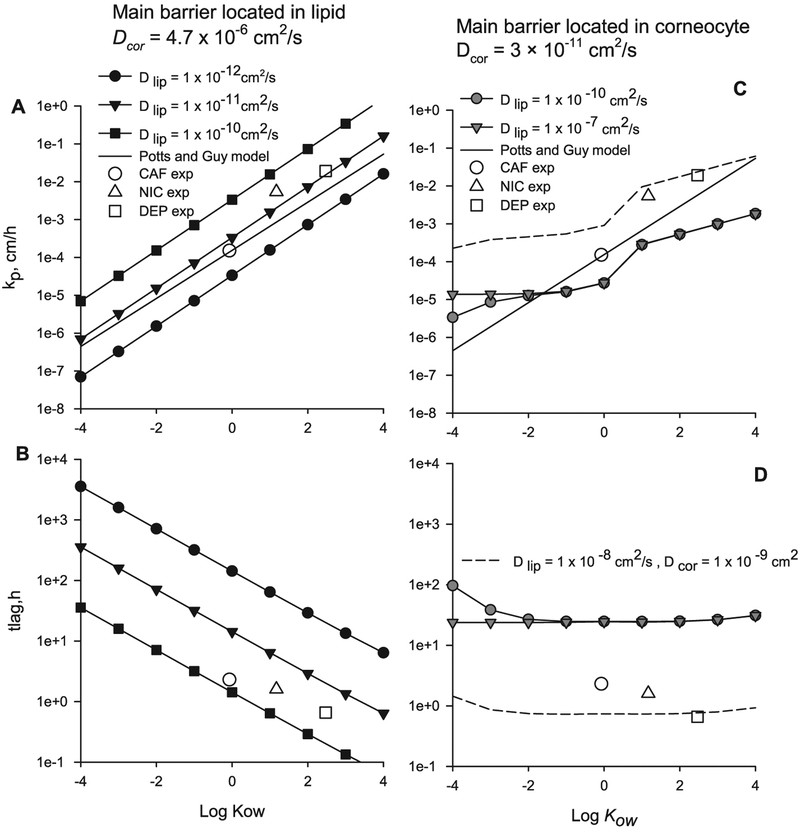
The permeability and lag time of diffusion through a ML geometry calculated with Eqs. (11) and (14) for n = 14 pairs of layers, when the main permeability barrier is located in the lipid phase and with geometric descriptors from Table 2, are shown in Fig. 5A and B. The input parameters values are: partition coefficients Kcor and Klip (Hansen et al. [38], Table 1) for a range of log Kow − 4 to 4, Dcor = 4.72 × 10⁻⁶ cm2/s (DEP value in Table 3) and Dlip from 1 × 10⁻¹² to 1 × 10⁻¹⁰ cm2/s. The experimental permeability and lag time values for CAF, NIC and DEP are shown with empty symbols in Fig. 5. The permeability computed with the Potts and Guy’s model [76] log kp = −2.811 + 0.635 log Kow − 0.005 MW with a MW of 200 is shown in Fig. 5A and C with a solid line. The experimental values and the permeability computed with the Potts and Guy’s model lie between of ratio Dlip/Dcor 1 × 10⁻⁷ to 1 × 10⁻⁵, indicating that the main permeation barrier is located in the lipids. Also when the main barrier is located in the lipids a lipophilic compound has higher permeability and lower lag time than a hydrophilic compound and the slope of the Potts and Guy equation is similar to the one from the ML model.
Fig. 5.
Permeability and lag time calculated using Eqs. (11) and (14) for n = 14 pairs of lipid-corneocytes layers with llip and lcor from Table 2. A and B main barrier located in the lipid. C and D main barrier located in the corneocyte.
The permeability and lag time of diffusion through the same ML geometry calculated using Eqs. (11) and (14) but now with main permeability barrier located in the corneocyte phase are shown in Fig. 5C and D. The input parameters values are: partition coefficients Kcor and Klip (Chen et al. [52–55], Table 1), Dcor = 3 × 10⁻¹¹ cm2/s, and Dlip from 1 × 10⁻¹⁰ to 1 × 10⁻⁷ cm2/s. Chen et al. [52–55] arbitrarily selects two equations for Kcor, as to create an increase of permeability with Kow value. It can be observed that when the main permeability is located in the corneocyte, grey symbols in Fig. 5C and D, the model results are not close to the experimental values; rendering lower permeability, and higher lag times. In fact to approach the experimental values the diffusivities in the corneocyte and lipid need to be closer to each other, Dcor = 1 × 10⁻⁹ and Dlip = 1 × 10⁻⁸ cm2/s, short-dashed line in Fig. 5C and D, making the SC almost homogeneous. There is little slope for the lag time as a function of Kow (Fig. 5D) and the slope in the flux versus Kow is due to the two different equations used to compute Kcor. It is possible that the Chen et al.’s model relies heavily on the vertical lipid path which is not included in the ML geometry. In the next section a B & M geometry will be presented.
The lipid diffusivity value in an ML geometry can be computed by combining Eqs. (11) and (13), as
| (22) |
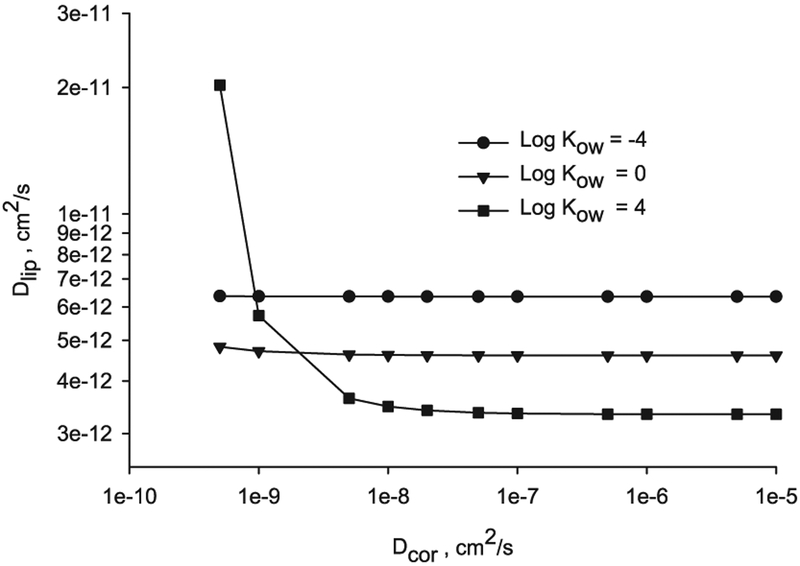
The lipid diffusivity for a range of Dcor 5 × 10⁻¹⁰ to 1 × 10⁻⁵ cm2/s, log Kow – 4, 0 and 4, and permeability computed with the Potts and Guy’s model [76] with an assumed molecular weight MW = 200, is depicted in Fig. 6.
Fig. 6.
Diffusivities in the lipid layers versus corneocyte for n = 14, log Kow = −4, 0 and 4 and MW = 200 computed using Eq. (22).
Again it is observed in Fig. 6, that the limiting barrier (lower diffusivities values) to satisfy the percutaneous permeation in an ML geometry with permeability from the Potts and Guy’s model is located in the lipid layers (Dlip in the order of 5 × 10⁻¹² cm2/s for the range explored) and this coincides with previous experimental conclusions [12].
Similar to what occurs in diffusion through an isotropic medium, the steady state flux or permeability in an ML geometry with n > 1 is inversely proportional to the lag time. Introducing Eq. (15) into Eq. (11) gives
| (23) |
The double logarithmic plot of permeability versus lag time for the ML geometry has a slope near −1, the same as for permeation through homogeneous media. The permeability versus lag time graph is a descriptive plot which will be used to evaluate the effect of anisotropy.
3.2. Validation of the finite element method of solution
To validate the implementation of the internal boundary conditions, the flux and lag time solutions obtained with COMSOL were compared to the analytical solutions, Eqs. (11) and (14) for the exact same ML geometry with the input parameters of the three illustrative compounds and the percent relative error between analytical and finite element solutions, was < 0.1% (data available but not presented here).
3.3. Diffusion in a brick-and-mortar geometry compared with a multilayer geometry and analysis of the main barrier location
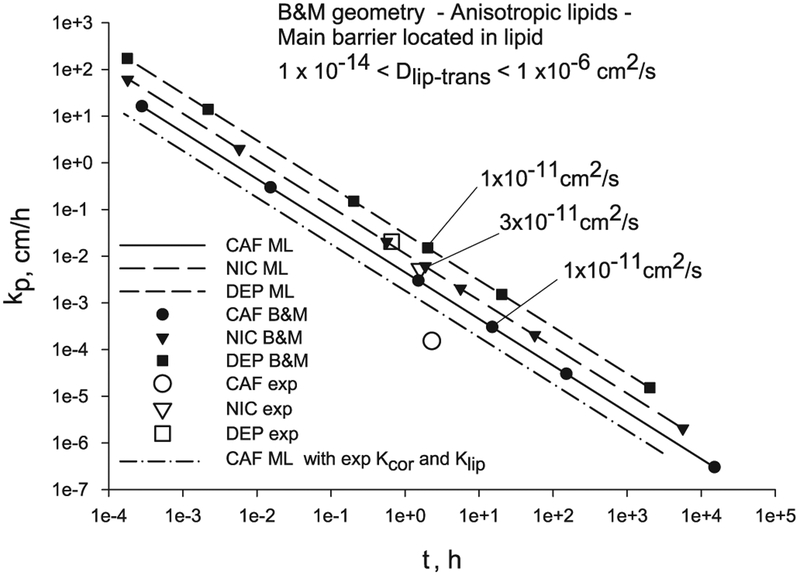
The permeability and lag time of diffusion through a 2D B & M geometry with n = 14 pairs of layers, geometric descriptors from Table 2, and input parameters values of the three illustrative chemicals from Table 3 for a range of Dlip-trans values, are displayed in Fig. 7. The permeability and lag time from the finite element solutions of the anisotropic B & M geometry (black symbols) are very close (1–3% differences) to the analytical solutions of the isotropic ML geometry (solid and dashed lines) when the value of the transbilayer lipid diffusivity is used as the isotropic lipid diffusivity in the ML geometry, for (0.91 < Kcor-lip < 6.5). This can be expected since the lipid area added by the B & M geometry is very small. On the other hand, there are differences between the two models when Kcor-lip ≤ 0.001 and Dlip-trans/Dcor ≥ 10 coinciding with results previously published, in Barbero and Frasch [68].
Fig. 7.
Transcellular diffusion through a B & M geometry and ML geometry when the main barrier of diffusion is located in the lipids compared to experimental values for CAF, NIC and DEP.
The modeled permeability values using either the ML or B & M models exceed the corresponding experimental points (empty symbols) for all three compounds, with CAF having the largest difference. This observation is possibly due to the fact that the partition coefficients are calculated from correlations which were obtained from experimental data sets with a few hydrophilic compounds [38]. The Kcor values required to match the experimental permeability and lag time (using Klip from correlations) can be computed with Eq. (22), and they are: 0.5 for CAF, 12.99 for NIC and 19.08 for DEP, which are smaller than the values from correlations (Table 3): 6.96 for CAF, 17.36 for NIC and 45.24 for DEP. These correlated Kcor values were computed using the protein density when they should have been computed using the corneocyte phase density, as noted by a reviewer. Using a corneocyte phase density the Kcor values will be about 20% lower, depending on the water content of the corneocyte. When using the experimental partition coefficient for CAF (Kcor = 2.74 and Klip = 2.15 [35] (dash-dot line in Fig. 7) the model solution is nearer the experimental permeability and lag time (Table 4).
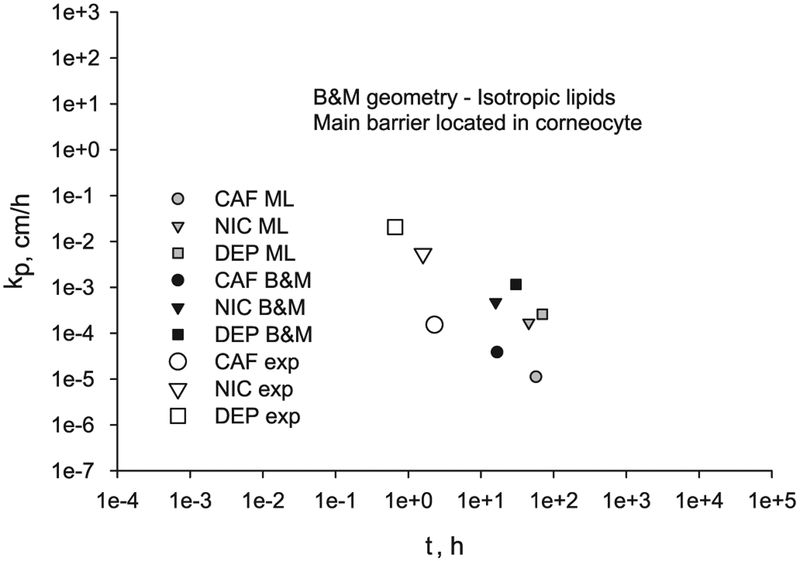
On the other hand, if the main permeability barrier is located in the corneocytes, the permeability and lag time results using the 2D B & M geometry (black symbols) differ from the ones using the ML geometry (grey symbols), as shown in Fig. 8. Both model’s results differ substantially from the experimental values, with the ML results being the ones farther away. The predicted permeabilities from the models when the corneocytes is the main barrier of diffusion are smaller than the experimental ones, while the lag times are larger.
Fig. 8.
Transcellular diffusion through a 2D B & M geometry and ML geometry when the main barrier of diffusion is located in the corneocytes compared to experimental values for CAF, NIC and DEP.
All model results are presented in Table 5 for comparison. For the ML and B & M models with the main barrier located in the lipids, the results shown in Table 5 are for the selected Dlip-trans values labeled in Fig. 7. For these selected lipid diffusivity values the model results of permeability and lag time for NIC are close to the experimental values, but for CAF and DEP, while the fluxes are close, the lag times are larger than the experimental values. For the ML and B & M models with the main barrier located in the corneocytes, more significant differences are found. The permeability values are smaller than the experimental values, while the lag times are significantly larger than the experimental values, for all three chemicals.
Table 5.
Comparison of ML and B & M results for both scenarios: main barrier located in the lipid and main barrier located in the corneocytes.
| Property | Experimental values | Main barrier: lipid | Main barrier: corneocyte | ||
|---|---|---|---|---|---|
| ML | B & M | ML | B & M | ||
| Caffeine | |||||
| Dlip-lat cm2/s | 2.71 × 10⁻⁸ | 2.71 × 10⁻⁸ | |||
| Dcor cm2/s | 5.58 × 10⁻⁶ | 1.28 × 10⁻¹¹ | |||
| Dlip-trans cm2/s | 1 × 10⁻¹¹ | ||||
| Cv μg/ml | 19,465 | 19,465 | 19,465 | ||
| Jss μg/cm2h | 2.95 ± 1.5 | 5.87 | 5.88 | 0.22 | 0.75 |
| kp cm/h | 1.516 × 10⁻⁴ | 3 × 10⁻⁴ | 3 × 10⁻⁴ | 1.1 × 10⁻⁵ | 3.84 × 10⁻⁵ |
| τ h | 2.3 ± 1.5 | 15 | 15.1 | 57.27 | 16.73 |
| Nicotine | |||||
| Dlip-lat cm2/s | 4.06 × 10⁻⁸ | 4.06 × 10⁻⁸ | |||
| Dcor cm2/s | 5.58 × 10⁻⁶ | 1.59 × 10⁻¹¹ | |||
| Dlip-trans cm2/s | 3 × 10⁻¹¹ | ||||
| Cv μg/ml | 24,000 | 24,000 | 24,000 | ||
| Jss μg/cm2h | 130 ± 60 | 147.18 | 147.24 | 4.06 | 11.34 |
| kp cm/h | 5.42 × 10⁻³ | 6.13 × 10⁻³ | 6.13 × 10⁻³ | 1.7 × 10⁻⁴ | 4.73 × 10⁻⁴ |
| τ h | 1.6 ± 0.5 | 1.86 | 1.88 | 45.57 | 15.95 |
| DEP | |||||
| Dlip-lat cm2/s | 2.01 × 10⁻⁸ | 2 × 10⁻⁸ | |||
| Dcor cm2/s | 4.72 × 10⁻⁶ | 1.09 × 10⁻¹¹ | |||
| Dlip-trans cm2/s | 1 × 10⁻¹¹ | ||||
| Cv μg/ml | 1019.8 | 1019.8 | 1019.8 | ||
| Jss μg/cm2h | 21.0 ± 2.9 | 15.49 | 15.49 | 0.26 | 1.17 |
| kp cm/h | 2.06 × 10⁻² | 1.52 × 10⁻² | 1.52 × 10⁻² | 2.6 × 10⁻⁴ | 1.15 × 10⁻³ |
| τ h | 0.66 ± 0.06 | 2.01 | 2.03 | 70.16 | 30.34 |
These results demonstrate that the main barrier of skin permeation resides in the lipid layers, for both a simple ML geometry and also a 2D-heterogeneous-anisotropic B & M geometry of the SC, coinciding with other authors’ conclusions [3,50]. When the corneocytes are the main barrier of diffusion the lag times become excessively long for all chemicals. Also, the trend of permeability and time lag with lipophilicity it is not present. Furthermore, the corneocytes as the main barrier contradicts the evidence of the increase in permeability with delipidization [3].
In the present study 14 pairs of lipid-corneocyte layers were used. Adding one pair of layers, like other models [4,51,48], decreases the flux or permeability by about 5% and increases the lag time about 10%. Although the skin permeation in reality takes place in three-dimensions, the results presented here demonstrate that the flow direction, perpendicular to the skin surface, is the primary component and in consequence it is acceptable to conclude that is not required to add the third dimension, as was concluded by other authors [77]. The 2D B & M model yields the same permeability than the 3D model when the diffusivity in the corneocytes is much larger than the one in the lipids [77], which is the case supported in this article.
The permeability and lag time results for the ML geometry are almost identical to the 2D B & M ones at steady state. Since transient solutions are computed with COMSOL Multiphysics, it is possible to compare the transient fluxes and differences are found between the ML and B & M model results at times less than half the lag time. For DEP the ML flux is larger than the B & M one (six times larger and exponentially decreasing to no difference at half the lag time), and the inverse occurs for NIC and CAF (data available but not presented here).
In the present study the lag time is computed with the time integral of the average transient flux at the bottom of the skin using Eq. (18). There are other methods to compute the lag time of diffusion through multiple laminates which do not require transient solutions [78]. The approximate lag time can be computed introducing Eq. (13) into Eq. (15) which results in τ = (n Klip/6kp) (llip + lcor/Kcor), which for CAF gives 15.14 h, compared to 15.1 h using Eq. (18), Table 5. This equation can also be written as τ = l KSC/6kp = l(φlip Klip + φcor Kcor)/6kp with φlip = n llip/l and φcor = n lcor/l, as in Wang et al. [4,51].
3.4. Effect of parameter depth-dependent asymmetry on permeability
Similar to the findings of Watkinson et al. [17] and Anissimov and Roberts [18], when the SC is taken as one layer with depth-dependent diffusivity little difference was found on flux and lag time versus constant equivalent diffusivity (results available but not presented here). Although, depth-dependent diffusivity caused a non-linear concentration distribution through the SC thickness at steady-state: convex, if the diffusivity in the surface is higher and concave if the diffusivity in the surface is lower than the one in the bottom, similar to the findings of Crank [79].
When the SC is represented with a heterogeneous geometry, three scenarios are investigated here: 1) increasing corneocyte diffusivity, 2) decreasing lipid diffusivity, and 3) both decreasing and increasing corneocyte-lipid partition coefficient with depth. The illustrative chemical compound used for this analysis is caffeine (CAF) with the main barrier of diffusion located in the lipids, Dlip-trans on the order of 10−11 cm2/s, based on the previous results.
-
1
Corneocyte diffusivity may increase with depth due to a corresponding increase in corneocyte water content [15]. However, even when the model Dcor was subjected to 3 orders of magnitude difference, almost no changes were observed in flux or lag time when compared with a constant corneocyte diffusivity (results available but not shown). This same conclusion can be reached from observations made from Fig. 6, were a range of four orders of magnitude in corneocyte diffusivities correspond to an almost constant value of diffusivity in the lipid and permeability. Variation of the corneocyte diffusivity with depth does not affect flux or lag time, since the main diffusion barrier is located in the lipid.
-
2
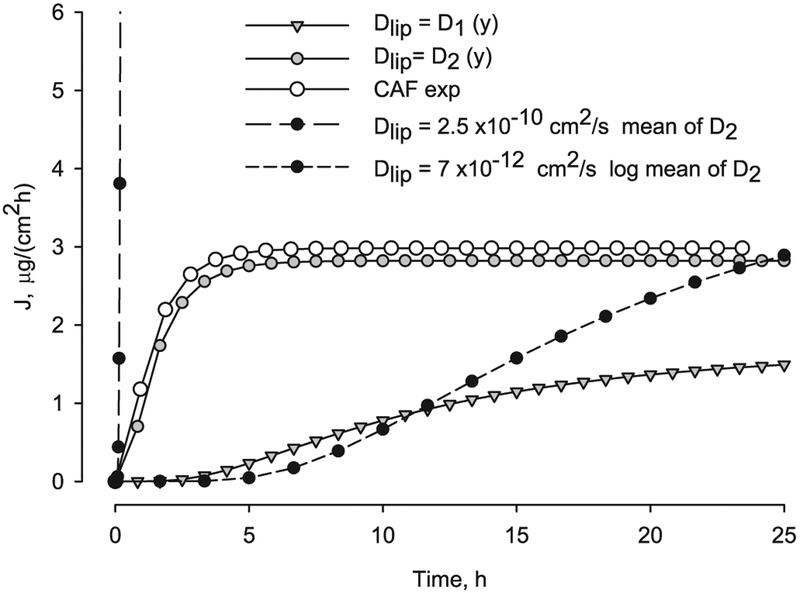
When the lipid diffusivity decreases with depth a significant effect was found. The dependency with depth was applied to the value of the transbilayer lipid diffusivity. The flux versus time is shown in Fig. 9, for lipid diffusivity following a linear function, Eq. (19), with two and three orders of magnitude variation (D1 and D2 in Table 6). The flux with variable diffusivity, D2 is much lower than the flux with constant mean value Dlip-mean = 2.5 × 10⁻¹⁰ cm2/s, and also differs from the logarithmic mean Dlip-log = 7 ×10− 12 cm2/s. The value of the equivalent diffusivity computed using Eq. (22) is similar to the logarithmic mean value of diffusivity, Table 6. The caffeine experimental flux, computed as the slope of the average accumulated permeation data from Barbero and Frasch [74], is also shown in Fig. 9.
Fig. 9.
Caffeine transient flux at the bottom of the SC, y = 0, as function of time for constant and depth dependent lipid diffusivity compared to experimental caffeine flux.
Table 6.
Lipid diffusion coefficients values used in the linear function Eq. (19).
| Function | Dlip-s | Dlip-0 | Dlip mean | Dlip log-mean | Eq. (22) | Units |
|---|---|---|---|---|---|---|
| D1 (y) | 6 × 10⁻¹¹ | 1 × 10⁻¹³ | 3 × 10⁻¹¹ | 2.5 × 10⁻¹² | 2.8 × 10⁻¹² | cmVs |
| D2 (y) | 5 × 10⁻¹⁰ | 1 × 10⁻¹³ | 2.5 × 10⁻¹⁰ | 7 × 10⁻¹² | 4.8 × 10⁻¹² | cm2/s |
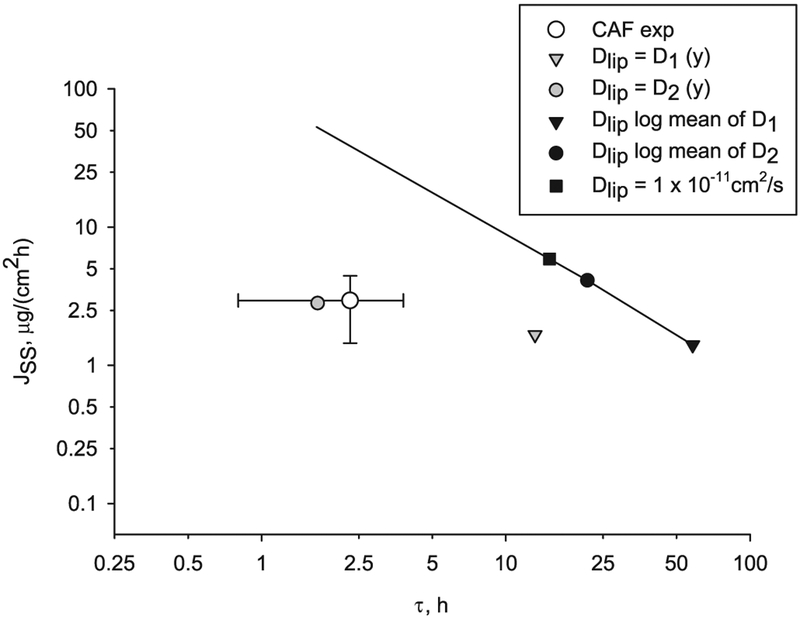
The steady state flux computed with variable lipid diffusivity differs from the one computed with equivalent constant lipid diffusivity and this difference depends on the selected range of variation. Also from the flux profile in Fig. 9 it can be observed that the lag time decreases when the diffusivity is higher at the surface of the skin, and again this deviation is a function of extent of the variation with depth. The steady state flux versus lag time for lipid diffusivity with linear functions, D1 and D2 (grey symbols and values from Table 6) and lipid diffusivity constant log midpoint values (black symbols) are shown in Fig. 10. The values of steady state flux and lag time using a lipid diffusivity decreasing three orders of magnitude with depth are near the CAF experimental values. Thus, when depth dependence of the diffusivity is introduced, the model results approach the experimental lag time values for CAF.
Fig. 10.
Transcellular diffusion of CAF thru a B & M geometry for two ranges of depth-dependent lipid diffusivities (grey symbols) versus lag time. Also shown is the CAF experimental flux and lag time (white circle) with error bars indicating standard deviation. The solid line connects points computed with constant diffusivity.
-
3
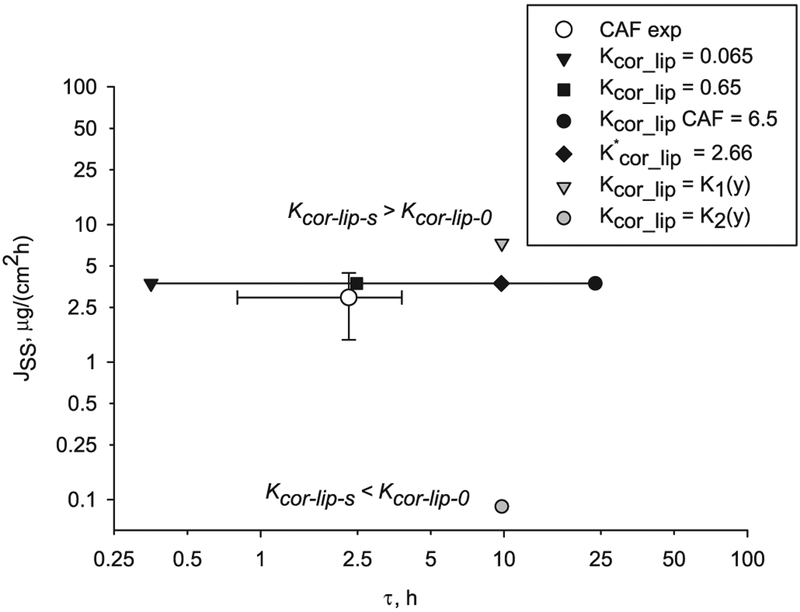
The corneocyte-lipid partition coefficient, Kcor-lip, applied to the internal boundary conditions between lipid and corneocyte is varied with depth. A corneocyte-lipid partition coefficient decreasing with depth, Kcor-lip-s > Kcor-lip-0 is studied first. For a function K1(y) with Kcor-lip-s = 100 Kcor-lip-0 (Table 7) the steady state flux is higher (grey triangle in Fig. 11) than the flux calculated with constant partition values 0.065, 0.65, 6.5 or equivalent partition value 2.66 computed with Eq. (15) (black symbols in Fig. 11). On the other hand, when the corneocyte-lipid partition coefficient increases with depth with a function K2(y) with Kcor-lip-s = 0.01 Kcor-lip-0 (Table 7 and grey circle in Fig. 11), the steady state flux is lower than the flux calculated with constant or equivalent partition. Note that partition functions K1(y) and K2(y) give the same lag time, which depends of the range of values and not the direction of change. The ranges tested cover a 100-fold reduction from the CAF Kcor-lip = 6.5 from correlations. Although asymmetry in the partitioning produces some reduction in lag time, it still exceeds five times the experimental lag time value (white circle in Fig. 11).
Table 7.
Partition coefficients values used in the linear function Eq. (19).
| Function | Kcor-lip-s | Kcor-lip-0 | Eq. (15) |
|---|---|---|---|
| K1 (y) | 6.5 | 0.065 | 2.66 |
| K2 (y) | 0.065 | 6.5 | 2.66 |
Fig. 11.
Effect of depth-dependent corneocyte-lipid partition coefficient Kcor-lip (grey symbols) on steady state flux and lag time of CAF diffusion through a B & M geometry compared to the corresponding constant Kcor-lip values through the depth (black symbols). The solid line connects points computed with constant partition coefficient. Also shown is the CAF experimental value (white circle) with error bars indicating standard deviation.
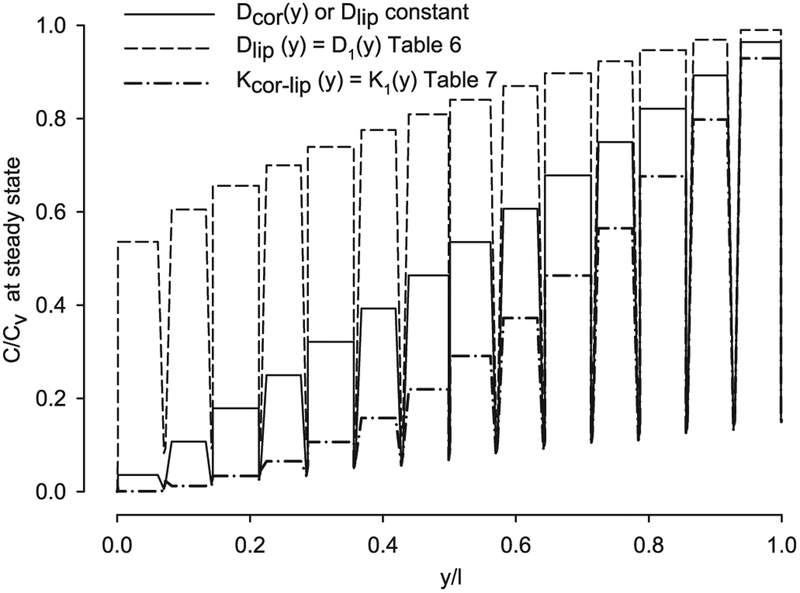
From the findings above, introducing asymmetry with depth in the lipid diffusivity conduces to a departure from the flux-lag time line of negative-one slope toward lower lag time, with a small effect on flux as shown in Fig. 10. While introducing asymmetry with depth in the partition coefficient leads to both lag time and flux variations, as shown in Fig. 11. Including parameter asymmetry could probable explain some of the differences between the model results with constant parameters and the corresponding experimental values; nevertheless this should be corroborated with experiments. The parameter asymmetry also affects the steady state concentration distribution profile through the SC thickness, as shown in Fig. 12. The steady-state concentration in the corneocytes and lipids along a vertical cutline in the middle of the SC geometry (Fig. 1) is plotted with the input parameters for caffeine (Table 3). Note the concentration in the corneocytes is higher than the one in the lipids due to the Kcor-lip value of 6.5. While the lipid diffusivity decreasing with depth produces a convex concentration distribution (dashed line in Fig. 12), the partition coefficient asymmetry produces a concave concentration distribution (dash-dot line in Fig. 12). Mueller et al. [19] found a logarithmic decrease of concentration of clobetasol propionate in SC tape strips and attributed this to a variable partitioning coefficient, which coincides with the findings presented here.
Fig. 12.
Concentration distribution profile through the SC thickness of a B & M geometry with constant and variable diffusivity and variable partition parameters for CAF.
In conclusion, variable lipid diffusivity with depth affects flux and lag time of permeation but variable corneocyte diffusivity with depth does not. When lipid diffusivity is depth dependent, the steady state flux of permeation will change depending of the range of variation of the diffusivity. However, the most significant effect occurs with the lag time, which is much smaller than the one computed with the constant equivalent diffusivity. Here the values of steady state flux and lag time computed using a lipid diffusivity decreasing three orders of magnitude with depth are nearer the CAF experimental values. Studies of diffusivity dependency with depth found no effect when the SC was considered homogeneous with one or two isotropic layers. The findings here address the importance of using heterogeneous B & M geometry versus homogeneous geometry.
The flux with a decreasing corneocyte-lipid partition coefficient with depth is higher than the flux with an equivalent constant partition and vice versa; the flux with an increasing corneocyte partition coefficient with depth is lower than the flux with an equivalent constant partition. The variation on corneocyte partition with depth does not change the lag time, at least for the ranges tested here.
3.5. Effect of skin appendages on permeability
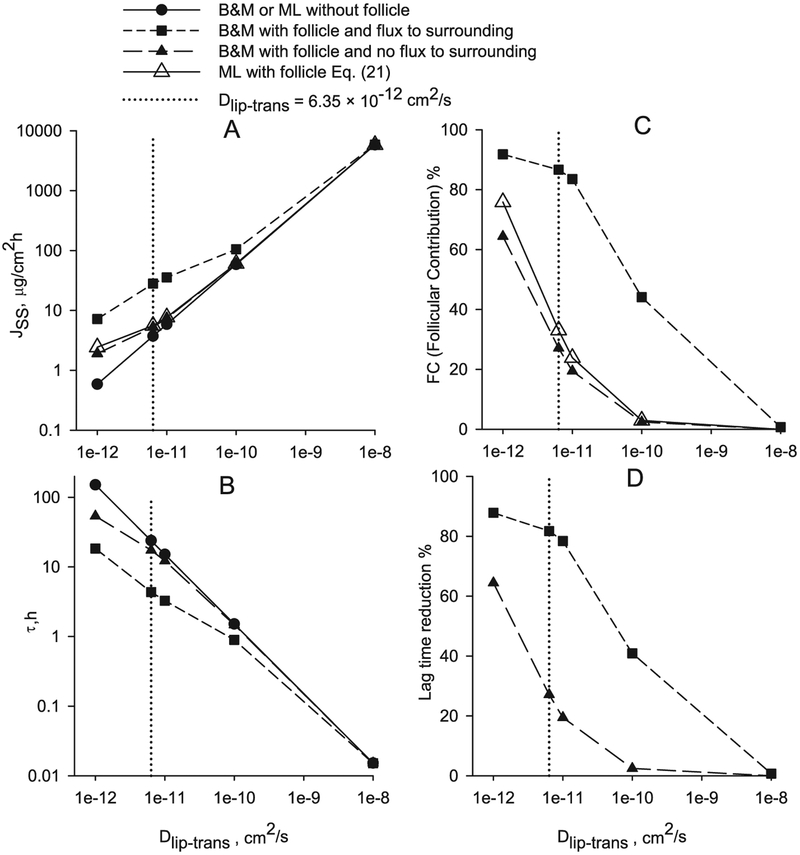
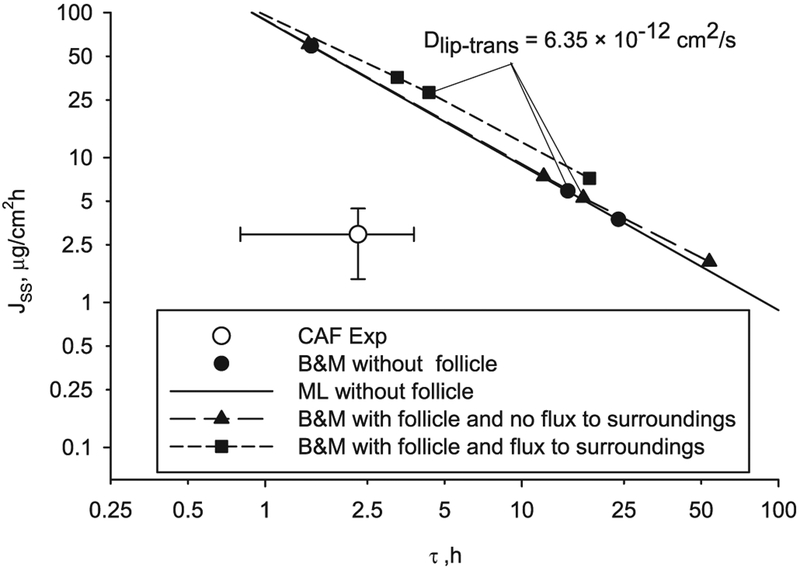
The illustrative chemical compound used in this part of the study is caffeine (CAF) with the main barrier of diffusion located in the lipids, based on the conclusions from previous results. The steady state flux and lag time of diffusion through a B & M geometry with a follicle of 0.1% of the total SC width, follicle diffusion coefficient of 10−7 cm2/s and Dlip-trans values ranging from 1 × 10⁻¹² to 1 × 10⁻⁸ cm2/s are shown in Fig. 13A and B. The steady state flux and lag time without follicle are shown in Fig. 13A and B (line and black circle). The steady state flux including follicular pathway computed using the approximation given by Eq. (21) is shown in Fig. 13A and C (line and white triangle). When internal flux between the follicle and surrounding SC is allowed and the follicle partition coefficient is equal to the lipid partition coefficient (Kf = Klip) the steady state flux is higher while the lag time is lower, as shown in Fig. 13A and B (short-dashed line and black square). The finite element solutions of a B & M geometry with follicle and no flux to the surrounding SC, except in the top and bottom lipid layers, are shown in Fig. 13 (long-dashed line and black triangle). This finite element solution is very close to the one obtained with Eq. (21) (line and white triangle) and the difference may be due to the effect that flux is allowed in the two extreme lipid layers. The percent follicular contribution and lag time reduction versus Dlip-trans are represented in Fig. 13C and D. When flux is allowed between the follicle and the surrounding SC, for a follicle diffusion coefficient of 10−7 cm2/s, follicle width of 0.1% of the total SC width and Dlip-trans of 6.35 × 10⁻¹² cm2/s (dotted gridline in Fig. 13), the follicular contribution is FC = 87% and the lag time reduction is 82%. With the approximation given in Eq. (21) or the finite element solution with no flux to surroundings the follicular contribution is about FC = 30% and the lag time reduction is about 26%, significantly smaller since there is no flux between follicle and surrounding SC. Experimentally a follicular flux contribution ranging from 20 to 60% has been measured [23,24]. Probably the flux between the follicle and the SC is small although there may be significant flux between the follicle and the dermis [31,80]. The introduction of follicular pathway produces a non-linear relationship in the double logarithmic plot of steady state flux versus lag time (Fig. 14) however the deviation is minimal. If the follicle area is taken as 0.01% of the total (ten times smaller than the present study) and a follicular diffusivity coefficient of 1 × 10⁻⁶ cm2/s, as proposed by Mitragotri [33], almost identical results were obtained.
Fig. 13.
Effect of follicular permeation on flux and lag time for caffeine as a function of the transbilayer lipid diffusivity.
Fig. 14.
Results of caffeine transcellular diffusion through a ML and B & M geometry without follicle, and through a B & M geometry with follicle and flux or not to SC surroundings.
The follicular pathway of penetration has significance when the diffusivity ratio transbilayer to corneocytes is low (Dlip_trans/Dcor < 1 × 10⁻³) and increases the flux while reducing the lag time. And this effect is greater when internal flux between the follicle and the surrounding SC is allowed. Follicular permeation produces a small departure from the linearity in the double-log plot of flux versus lag time for a range of diffusivities.
4. Study limitations
The main limitations in this study are related to the limited number of experimental values for the required input parameters. It is essential that more experimental determinations of partition coefficients of chemicals into corneocytes and lipids as well as transbilayer lipid diffusivity be done to improve the current correlations. Also, experimental measurements of diffusivity in the follicles are necessary.
The models presented here include only the SC since it is generally regarded to be the rate-limiting barrier [1], but inclusion of the epidermis and dermis in the geometry could affect the results particularly for lipophilic compounds. A microscopic multiphase diffusion model of the epidermis [81], and a model of the partitioning, diffusivity and clearance in the dermis [82] have recently being developed, and could be added to describe the permeation through the whole skin thickness. To study the effect of the follicular appendages in detail the geometry should include epidermis and dermis.
Three chemicals were used as illustrative compounds in the comparison of ML vs B & M geometries and caffeine was the illustrative chemical used in the study of asymmetry with depth and appendages. The addition of other chemicals as well as other ranges of input parameters will permit broader generalization of the obtained results. Also the addition of binding, local concentration dependency, and vehicle could affect the results [83]. In a following article the effect of chemical binding and local concentration dependency of affinity parameters on skin permeation will be analyzed.
5. Conclusions
Novel contributions of this work include the following: (1) the use of simple mathematical equations of diffusion through a ML geometry to identify the lipid as the main barrier of diffusion through the SC; (2) inclusion of asymmetry with depth in diffusivity and partition in a 2D–heterogeneous-anisotropic B & M geometry of the SC; (3) inclusion of a follicular pathway of penetration in a 2D-heterogeneous-anisotropic B & M geometry of the SC; (4) the computation of transient solutions instead of steady state solutions as most previous studies; (5) the use of a commercial modeling software package as opposed to custom written software as most previous works [84]; and (6) the validation of the finite element results by comparisons with arithmetic solutions of a ML geometry.
This study demonstrates that the main barrier of skin permeation resides in the lipid layer, with results from a simple ML geometry and also a 2D–heterogeneous-anisotropic B & M geometry of the SC. These findings confirm that diffusion through the SC is transcellular. The flux and lag time of diffusion in a ML geometry are almost identical to the finite element results of a B & M geometry when the value of the transbilayer lipid diffusivity of the B & M geometry is used as lipid diffusivity in the ML geometry. Although, at early times into the diffusion (less than half the lag time) the results using a ML geometry differ from the ones using a B & M geometry. When comparing model results of steady state flux and lag time to experimental values differences are found, especially for caffeine; it could be that correlations available up today, may need refinement with additional hydrophilic experimental data.
Variable lipid diffusivity with depth affects flux and lag time of permeation but variable corneocyte diffusivity with depth does not. With lipid diffusivity decreasing with depth the model results approach the CAF experimental values. Variable corneocyte-lipid partition coefficient with depth affects the flux but not the lag time when compared to the results with an equivalent constant partitioning. Both lipid diffusivity and partition variation with depth affect the steady-state concentration distribution through the SC thickness. The follicular pathway increases the total penetration while reducing the lag time. Asymmetry and follicular penetration do not contradict the central conclusion regarding the lipid layers being the main SC diffusion barrier.
Acknowledgement
This work was supported by the National Institute for Occupational Safety and Health.
Footnotes
Publisher's Disclaimer: Disclaimer
Publisher's Disclaimer: The findings and conclusions in this report are those of the authors and do not necessarily represent the views of the National Institute for Occupational Safety and Health.
References
- [1].Scheuplein RJ, Blank IH, Permeability of the skin, Physiol. Rev 51 (1971) 702–747. [DOI] [PubMed] [Google Scholar]
- [2].Kasting GB, Miller MA, Talreja PS, Evaluation of stratum corneum heterogeneity, in: Bronaugh RL, Maibach HI (Eds.), Percutaneoaus Absorption Drugs-Cosmetics-Mechanisms-Methods, CRC Press, Boca Raton, 2005, pp. 193–212. [Google Scholar]
- [3].Kasting GB, Nitsche JM, Mathematical models of skin permeability: microscopic transport models and their predictions, in: Querleux B (Ed.), Computational Biophysics of the Skin, Pan Stanford Publishing Pte.Ltd., Singapure, 2014, pp. 187–216. [Google Scholar]
- [4].Wang TF, Kasting GB, Nitsche JM, A multiphase microscopic diffusion model for stratum corneum permeability. I. Formulation, solution, and illustrative results for representative compounds, J. Pharm. Sci 95 (2006) 620–648. [DOI] [PubMed] [Google Scholar]
- [5].Kushner JT, Kim D, So PT, Blankschtein D, Langer RS, Dual-channel two-photon microscopy study of transdermal transport in skin treated with low-frequency ultrasound and a chemical enhancer, J. Invest. Dermatol 127 (2007) 2832–2846. [DOI] [PubMed] [Google Scholar]
- [6].Bouwstra JA, de Graaff A, Gooris GS, Nijsse J, Wiechers JW, van Aelst AC, Water distribution and related morphology in human stratum corneum at different hydration levels, J. Invest. Dermatol 120 (2003) 750–758. [DOI] [PubMed] [Google Scholar]
- [7].Kasting GB, Barai ND, Wang TF, Nitsche JM, Mobility of water in human stratum corneum, J. Pharm. Sci 92 (2003) 2326–2340. [DOI] [PubMed] [Google Scholar]
- [8].Kasting GB, Barai ND, Equilibrium water sorption in human stratum corneum, J. Pharm. Sci 92 (2003) 1624–1631. [DOI] [PubMed] [Google Scholar]
- [9].Warner RR, Stone KJ, Boissy YL, Hydration disrupts human stratum corneum ultrastructure, J. Invest. Dermatol 120 (2003) 275–284. [DOI] [PubMed] [Google Scholar]
- [10].Kasting GB, Miller MA, Talreja PS, Evaluation of stratum corneum heterogeneity, in: Bronaugh RL, Maibach HI (Eds.), Percutaneoaus Absorption Drugs-Cosmetics-Mechanisms-Methodology, Taylor and Francis, Boca Raton, 2005, pp. 193–212. [Google Scholar]
- [11].Boddé HE, van den Brink I, Koerten HK, de Haan FHN, Visualization of in vitro percutaneous penetration of mercuric chloride; transport through intercellular space versus cellular uptake through desmosomes, J. Control. Release 15 (1991) 227–236. [Google Scholar]
- [12].Elias PM, Lipids and the epidermal permeability barrier, Arch. Dermatol. Res 270 (1981) 95–117. [DOI] [PubMed] [Google Scholar]
- [13].Van Logtestijn MDA, Dominguez-Huttinger E, Stamatas GN, Tanaka RJ, Resistance to water diffusion in the stratum corneum is depth-dependent, PLoS One 10 (2015) (Article number e0117292). [DOI] [PMC free article] [PubMed] [Google Scholar]
- [14].Cadavona JJ, Zhu H, Hui X, Jung EC, Maibach HI, Depth-dependent stratum corneum permeability in human skin in vitro, J. Appl. Toxicol 36 (2016) 1207–1213. [DOI] [PubMed] [Google Scholar]
- [15].Caspers PJ, Lucassen GW, Bruining HA, Puppels GJ, Automated depth-scanning confocal Raman microspectrometer for rapid in vivo determination of water concentration profiles in human skin, J. Raman Spectrosc 31 (2000) 813–818. [Google Scholar]
- [16].Guy RH, Mak VHW, Kai T, Bommannan D, Potts RO, Percutaneous penetration enhancers: mode of action, in: Scott RC, Guy RH, Hadgraft J (Eds.), Prediction of Percutaneous Penetration, IBC Technical Services, London, 1990, pp. 213–223. [Google Scholar]
- [17].Watkinson AC, Bunge AL, Hadgraft J, Naik A, Computer simulation of penetrant concentration-depth profiles in the stratum corneum, Int. J. Pharm 87 (1992) 175–182. [Google Scholar]
- [18].Anissimov YG, Roberts MS, Diffusion modeling of percutaneous absorption kinetics: 3. Variable diffusion and partition coefficients, consequences for stratum corneum depth profiles and desorption kinetics, J. Pharm. Sci 93 (2004) 470–487. [DOI] [PubMed] [Google Scholar]
- [19].Mueller B, Anissimov YG, Roberts MS, Unexpected clobetasol propionate profile in human stratum corneum after topical application in vitro, Pharm. Res 20 (2003) 1835–1837. [DOI] [PubMed] [Google Scholar]
- [20].Lundstrom A, Serre G, Haftek M, Egelrud T, Evidence for a role of corneodesmosin, a protein which may serve to modify desmosomes during cornification, in stratum corneum cell cohesion and desquamation, Arch. Dermatol. Res 286 (1994) 369–375. [DOI] [PubMed] [Google Scholar]
- [21].Scheuplein RJ, Mechanism of percutaneous absorption. II. Transient diffusion and the relative importance of various routes of skin penetration, J. Invest. Dermatol 48 (1967) 79–88. [PubMed] [Google Scholar]
- [22].Knorr F, Lademann J, Patzelt A, Sterry W, Blume-Peytavi U, Vogt A, Follicular transport route–research progress and future perspectives, Eur. J. Pharm. Biopharm 71 (2009) 173–180. [DOI] [PubMed] [Google Scholar]
- [23].Frum Y, Eccleston GM, Meidan VM, Factors influencing hydrocortisone permeation into human hair follicles: use of the skin sandwich system, Int. J. Pharm 358 (2008) 144–150. [DOI] [PubMed] [Google Scholar]
- [24].Frum Y, Eccleston GM, Meidan VM, In-vitro permeation of drugs into porcine hair follicles: is it quantitatively equivalent to permeation into human hair follicles? J. Pharm. Pharmacol 60 (2008) 145–151. [DOI] [PubMed] [Google Scholar]
- [25].El Maghraby GMM, Williams AC, Barry BW, Skin hydration and possible shunt route penetration in controlled estradiol delivery from ultradeformable and standard liposomes, J. Pharm. Pharmacol 53 (2001) 1311–1322. [DOI] [PubMed] [Google Scholar]
- [26].Essa EA, Bonner MC, Barry BW, Human skin sandwich for assessing shunt route penetration during passive and iontophoretic drug and liposome delivery, J. Pharm. Pharmacol 54 (2002) 1481–1490. [DOI] [PubMed] [Google Scholar]
- [27].Otberg N, Patzelt A, Rasulev U, Hagemeister T, Linscheid M, Sinkgraven R, Sterry W, Lademann J, The role of hair follicles in the percutaneous absorption of caffeine, Br. J. Clin. Pharmacol 65 (2008) 488–492. [DOI] [PMC free article] [PubMed] [Google Scholar]
- [28].Trauer S, Patzelt A, Otberg N, Knorr F, Rozycki C, Balizs G, Buttemeyer R, Linscheid M, Liebsch M, Lademann J, Permeation of topically applied caffeine through human skin–a comparison of in vivo and in vitro data, Br. J. Clin. Pharmacol 68 (2009) 181–186. [DOI] [PMC free article] [PubMed] [Google Scholar]
- [29].Tampucci S, Burgalassi S, Chetoni P, Lenzi C, Pirone A, Mailland F, Caserini M, Monti D, Topical formulations containing finasteride. Part II: determination of finasteride penetration into hair follicles using the differential stripping technique, J. Pharm. Sci 103 (2014) 2323–2329. [DOI] [PubMed] [Google Scholar]
- [30].Scheuplein RJ, Blank IH, Brauner GJ, MacFarlane DJ, Percutaneous absorption of steroids, J. Invest. Dermatol 52 (1969) 63–70. [DOI] [PubMed] [Google Scholar]
- [31].Dancik YH, Mathematical Models of Diffusion Through and Near Skin Appendages: Hair Follicle and Eccrine Sweat Gland Pathways, Dissertation State University of New York, Buffalo, 2006, pp. 1–510. [Google Scholar]
- [32].Dancik YH, Kasting GB, Nitsche JM, A computational model of transient drug/chemical diffusion through human skin in the vicinity of a hair follicle, AIChE Annual Meeting, Cincinnati, OH, 2005, American Institute of Chemical Engineers, New York, NY, 2005, p. 14306. [Google Scholar]
- [33].Mitragotri S, Modeling skin permeability to hydrophilic and hydrophobic solutes based on four permeation pathways, J. Control. Release 86 (2003) 69–92. [DOI] [PubMed] [Google Scholar]
- [34].Wang T-F, Microscopic Models for the Structure and Permeability of the Stratum Corneum Barrier Layer of the Skin, Dissertation University at Buffalo, State University of New York, 2003. [Google Scholar]
- [35].Hansen S, Henning A, Naegel A, Heisig M, Wittum G, Neumann D, Kostka KH, Zbytovska J, Lehr CM, Schaefer UF, In-silico model of skin penetration based on experimentally determined input parameters. Part I: experimental determination of partition and diffusion coefficients, Eur. J. Pharm. Biopharm 68 (2008) 352–367. [DOI] [PubMed] [Google Scholar]
- [36].Ibrahim R, Kasting GB, Improved method for determining partition and diffusion coefficients in human dermis, J. Pharm. Sci 99 (2010) 4928–4939. [DOI] [PubMed] [Google Scholar]
- [37].Kruse J, Golden D, Wilkinson S, Williams F, Kezic S, Corish J, Analysis, interpretation, and extrapolation of dermal permeation data using diffusion-based mathematical models, J. Pharm. Sci 96 (2007) 682–703. [DOI] [PubMed] [Google Scholar]
- [38].Hansen S, Lehr CM, Schaefer UF, Improved input parameters for diffusion models of skin absorption, Adv. Drug Deliv. Rev 65 (2013) 251–264. [DOI] [PubMed] [Google Scholar]
- [39].Johnson ME, Berk DA, Blankschtein D, Golan DE, Jain RK, Langer RS, Lateral diffusion of small compounds in human stratum corneum and model lipid bilayer systems, Biophys. J 71 (1996) 2656–2668. [DOI] [PMC free article] [PubMed] [Google Scholar]
- [40].Nitsche JM, Wang TF, Kasting GB, A two-phase analysis of solute partitioning into the stratum corneum, J. Pharm. Sci 95 (2006) 649–666. [DOI] [PubMed] [Google Scholar]
- [41].Raykar PV, Fung MC, Anderson BD, The role of protein and lipid domains in the uptake of solutes by human stratum corneum, Pharm. Res 5 (1988) 140–150. [DOI] [PubMed] [Google Scholar]
- [42].Wang LM, Chen LJ, Lian GP, Han LJ, Determination of partition and binding properties of solutes to stratum corneum, Int. J. Pharm 398 (2010) 114–122. [DOI] [PubMed] [Google Scholar]
- [43].Yotsuyanagi T, Higuchi WI, A two phase series model for the transport of steroids across the fully hydrated stratum corneum, J. Pharm. Pharmacol 24 (1972) 934–941. [DOI] [PubMed] [Google Scholar]
- [44].Michaels AS, Chandrasekaran SK, Shaw JE, Drug permeation through human skin: theory and in vitro experimental measurement, AICHE J. 21 (1975) 985–996. [Google Scholar]
- [45].Tojo K, Random brick model for drug transport across stratum corneum, J. Pharm. Sci 76 (1987) 889–891. [DOI] [PubMed] [Google Scholar]
- [46].Heisig M, Lieckfeldt R, Wittum G, Mazurkevich G, Lee G, Non steady-state descriptions of drug permeation through stratum corneum. I. The biphasic brick-and-mortar model, Pharm. Res 13 (1996) 421–426. [DOI] [PubMed] [Google Scholar]
- [47].Naegel A, Hansen S, Neumann D, Lehr CM, Schaefer UF, Wittum G, Heisig M, In-silico model of skin penetration based on experimentally determined input parameters. Part II: mathematical modelling of in-vitro diffusion experiments. Identification of critical input parameters, Eur. J. Pharm. Biopharm 68 (2008) 368–379. [DOI] [PubMed] [Google Scholar]
- [48].Johnson ME, Blankschtein D, Langer R, Evaluation of solute permeation through the stratum corneum: lateral bilayer diffusion as the primary transport mechanism, J. Pharm. Sci 86 (1997) 1162–1172. [DOI] [PubMed] [Google Scholar]
- [49].Frasch HF, A random walk model of skin permeation, Risk Anal. 22 (2002) 265–275. [DOI] [PubMed] [Google Scholar]
- [50].Barbero AM, Frasch HF, Transcellular route of diffusion through stratum corneum: results from finite element models, J. Pharm. Sci 95 (2006) 2186–2194. [DOI] [PubMed] [Google Scholar]
- [51].Wang TF, Kasting GB, Nitsche JM, A multiphase microscopic diffusion model for stratum corneum permeability. II. Estimation of physicochemical parameters, and application to a large permeability database, J. Pharm. Sci 96 (2007) 3024–3051. [DOI] [PubMed] [Google Scholar]
- [52].Chen LJ, Lian GP, Han LJ, Use of “bricks and mortar” model to predict transdermal permeation: model development and initial validation, Ind. Eng. Chem. Res 47 (2008) 6465–6472. [Google Scholar]
- [53].Chen LJ, Lian GP, Han LJ, Modeling transdermal permeation. Part I. Predicting skin permeability of both hydrophobic and hydrophilic solutes, AICHE J. 56 (2010) 1136–1146. [Google Scholar]
- [54].Chen L, Han L, Lian G, Recent advances in predicting skin permeability of hydrophilic solutes, Adv. Drug Deliv. Rev 65 (2013) 295–305. [DOI] [PubMed] [Google Scholar]
- [55].Lian GP, Chen LJ, Pudney PDA, Melot M, Han LJ, Modeling transdermal permeation. Part 2. Predicting the dermatopharmacokinetics of percutaneous solute, AICHE J. 56 (2010) 2551–2560. [Google Scholar]
- [56].Johnson ME, Biophysical Aspects of Transdermal Drug Delivery and Chemical Enhancement (PhD Dissertation), Massachusetts Institute of Technology, 1996. [Google Scholar]
- [57].Nitsche JM, Wang TF, Kasting GB, A two-phase analysis of solute partitioning into the stratum corneum, J. Pharm. Sci 95 (3) (2006) 649–666. [DOI] [PubMed] [Google Scholar]
- [58].Wilke CR, Chang P, Correlation of diffusion coefficients in dilute solutions, AICHE J. 1 (1955) 264–270. [Google Scholar]
- [59].Lieb WR, Stein WD, Non-stokesian nature of transverse diffusion within human red cell membranes, J. Membr. Biol 92 (1986) 111–119. [DOI] [PubMed] [Google Scholar]
- [60].Cohen BE, Bangham AD, Diffusion of small non-electrolytes across liposome membranes, Nature 236 (1972) 173–174. [DOI] [PubMed] [Google Scholar]
- [61].Cussler EL, Fundamentals of mass transfer, Diffusion: Mass transfer in Fluid Systems, Cambridge University Press, 2009, p. 237. [Google Scholar]
- [62].Bouwstra JA, Gooris GS, van der Spek JA, Bras W, Structural investigations of human stratum corneum by small-angle X-ray scattering, J. Invest. Dermatol 97 (1991) 1005–1012. [DOI] [PubMed] [Google Scholar]
- [63].Berner B, Cooper ER, Application of diffusion-theory to the relationship between partition-coefficient and biological response, J. Pharm. Sci 73 (1984) 102–106. [DOI] [PubMed] [Google Scholar]
- [64].Berner B, Cooper ER, Asymptotic solution for nonsteady-state diffusion through oil-water multilaminates, J. Membr. Sci 14 (1983) 139–145. [Google Scholar]
- [65].Wu XM, Keister JC, Cooper ER, Theoretical effects of binding on transport lag times in the case of multilayered membranes, J. Membr. Sci 50 (1990) 57–69. [Google Scholar]
- [66].Barrie JA, Levine JD, Michaels AS, Wong P, Diffusion and solution of gases in composite rubber membranes, Trans. Faraday Soc 59 (1963) 869–878. [Google Scholar]
- [67].Ash R, Barrer RM, Petropoulos JH, Diffusion in heterogeneous media: properties of a laminated slab, Br. J. Appl. Phys 14 (1963) 854–862. [Google Scholar]
- [68].Barbero AM, Frasch HF, Modeling of diffusion with partitioning in stratum corneum using a finite element model, Ann. Biomed. Eng 33 (2005) 1281–1292. [DOI] [PubMed] [Google Scholar]
- [69].Missel PJ, Finite element modeling of diffusion and partitioning in biological systems: the infinite composite medium problem, Ann. Biomed. Eng 28 (2000) 1307–1317. [DOI] [PubMed] [Google Scholar]
- [70].COMSOL, Separation through dialysis, in: COMSOL (Ed.), COMSOL Multiphysics, 2007, pp. 158–159 Burlington, MA. [Google Scholar]
- [71].Kreienbuehl A, Naegel A, Ruprecht D, Speck R, Wittum G, Krause R, Numerical simulation of skin transport using Parareal, Comput. Vis. Sci 17 (2015) 99–108. [Google Scholar]
- [72].Crank J, Diffusion in a plane sheet, The Mathematics of Diffusion, Oxford University Press, Oxford, 1975, pp. 45–68. [Google Scholar]
- [73].Frisch HL, The time lag in diffusion, J. Phys. Chem. US 61 (1957) 93–95. [Google Scholar]
- [74].Barbero AM, Frasch HF, Effect of frozen human epidermis storage duration and cryoprotectant on barrier function using two model compounds, Skin Pharmacol. Physiol 29 (2016) 31–40. [DOI] [PMC free article] [PubMed] [Google Scholar]
- [75].Frasch HF, Barbero AM, In vitro human epidermal permeation of nicotine from electronic cigarette refill liquids and implications for dermal exposure assessment, J. Expo. Sci. Environ. Epidemiol (2016), 10.1038/jes.2016.68. [DOI] [PMC free article] [PubMed] [Google Scholar]
- [76].Potts RO, Guy RH, Predicting skin permeability, Pharm. Res 9 (1992) 663–669. [DOI] [PubMed] [Google Scholar]
- [77].Naegel A, Heisig M, Wittum G, A comparison of two- and three-dimensional models for the simulation of the permeability of human stratum corneum, Eur. J. Pharm. Biopharm 72 (2009) 332–338. [DOI] [PubMed] [Google Scholar]
- [78].Crank J, Diffusion in heterogeneous media, Mathematics of Diffusion, Oxford Science Publications, Oxford, 1975, p. 269. [Google Scholar]
- [79].Crank J, Some calculated results for variable diffusion coefficents, Mathematics of Diffusion, Oxford Science Publications, Oxford, 1975, pp. 160–202. [Google Scholar]
- [80].Basler K, Bergmann S, Heisig M, Naegel A, Zorn-Kruppa M, Brandner JM, The role of tight junctions in skin barrier function and dermal absorption, J. Control. Release 242 (2016) 105–118. [DOI] [PubMed] [Google Scholar]
- [81].Nitsche JM, Kasting GB, A microscopic multiphase diffusion model of viable epidermis permeability, Biophys. J 104 (2013) 2307–2320. [DOI] [PMC free article] [PubMed] [Google Scholar]
- [82].Kretsos K, Miller MA, Zamora-Estrada G, Kasting GB, Partitioning, diffusivity and clearance of skin permeants in mammalian dermis, Int. J. Pharm 346 (2008) 64–79. [DOI] [PubMed] [Google Scholar]
- [83].Chittenden JT, Riviere JE, Quantification of vehicle mixture effects on in vitro transdermal chemical flux using a random process diffusion model, J. Control. Release 217 (2015) 74–81. [DOI] [PubMed] [Google Scholar]
- [84].Frasch HF, Barbero AM, Application of numerical methods for diffusion-based modeling of skin permeation, Adv. Drug Deliv. Rev 65 (2013) 208–220. [DOI] [PubMed] [Google Scholar]


