 Naphthoquinones have been investigated as potential therapeutic molecules for neurodegenerative disorders, which is largely based on their anti-oxidative potential.
Abstract
Naphthoquinones have been investigated as potential therapeutic molecules for neurodegenerative disorders, which is largely based on their anti-oxidative potential. However, a theoretical framework for the pleiotropic protective effects of naphthoquinone derivatives is largely missing. We synthesized a library of novel short chain 2,3-disubstituted naphthoquinone derivatives and measured their redox characteristics to identify a potential connection with their biological activity. Using two cell lines with different reducing potential, the compounds were tested for their inherent toxicity, acute rescue of ATP levels and cytoprotective activity. For the first time, a structure–activity-relationship for naphthoquinones has been established. Our results clearly demonstrate that it is the group on the alkyl side chain and not solely the redox characteristics of the naphthoquinone unit or lipophilicity that determines the extent of cytoprotection by individual compounds. From this, we developed a number of amide containing naphthoquinones with superior activity in ATP rescue and cell viability models compared to the clinically used benzoquinone idebenone.
1. Introduction
Quinones are widely found in nature as co-factors, antioxidants, signalling molecules and vitamins due to their reversible redox-characteristics.1–4 Unfortunately, the use of naturally occurring quinones is limited by their pharmacochemical characteristics such as poor solubility, limited bioavailability and their broad effects on a multitude of physiological processes.2 Furthermore, variation of their chemical and physiochemical properties can lead to significant differences in pharmacological effects often without clear structure–activity relationships (SAR).1 Coenzyme Q10 (CoQ10) (1) is one of the best known physiological quinones. CoQ10 (1) acts as a potent, physiological antioxidant and is also essential for cellular energy production due to its ability to undergo reversible redox reactions with enzyme complexes of the mitochondrial respiratory chain.5,6 Mitochondrial membrane potential, which is essential for cellular energy production is maintained by shuttling electrons from complex I and II to complexes III and IV in the mitochondrial electron transport chain to support the production of adenosine triphosphate (ATP).7–9
CoQ10 (1), which is responsible for the electron transport between complexes I, II and III, features a benzoquinone moiety and a large hydrocarbon side chain comprising ten isoprenyl units. This highly lipophilic tail limits the effectiveness of CoQ10 (1) as a potential therapeutic (Fig. 1). For example, when administered orally, CoQ10 (1) displays extremely low solubility in aqueous environments and is only poorly absorbed.5,8,10 In light of its high lipophilicity, more hydrophilic benzoquinones, such as idebenone (2) (Fig. 1), are under investigation for indications that are associated with oxidative stress and mitochondrial dysfunction.1–3 Clinical studies using idebenone (2) reported some encouraging results in many neuromuscular and mitochondrial disorders including Friedreich's ataxia (FRDA),11–13 Duchenne muscular dystrophy (DMD),14–17 multiple sclerosis (MS)18 and Leber's hereditary optic neuropathy (LHON).1–3 Idebenone was approved by the European Medicines Agency (EMA) as treatment for LHON in 2015.19
Fig. 1. Structures of CoQ10 (1) and Idebenone (2).
Unfortunately, upon oral administration, short-chain quinones such as idebenone (2) are subject to rapid liver metabolism.20 Xenobiotics are typically detoxified in the liver by cytochrome P450 enzymes (CytP450) that metabolize compounds by a one electron reduction. However, in the case of quinones, this results in unstable semiquinones that give rise to the production of reactive oxygen species (ROS).2,5 This ROS production by semiquinones can damage cellular macromolecules and can ultimately lead to cell death and tissue dysfunction.21 Most cells express a specialized enzyme, NAD(P)H:quinone oxidoreductase 1 (NQO1). Unlike CytP450 enzymes, NQO1 catalyzes a two-electron dependent reduction, which produces the hydroquinone.5 It is important to note that only the reduced hydroquinone form of the molecule is active as an antioxidant and electron carrier.10,22 Consequently, it is hypothesized that the efficient two-electron reduction of quinones has to occur to avoid cellular toxicity as well as for the compounds to be of therapeutic value.21,23 However, inactivating NQO1 polymorphisms such as 609C > T are prevalent in the general population, resulting in decreased or even absent enzymatic activity.21,23 Therefore, despite the potential of benzoquinones as therapeutic agents, there is the very real possibility that these compounds could be ineffective or even toxic in some individuals.
Like benzoquinones, it has been demonstrated that naphthoquinones are protective in pre-clinical disease models by modulating mitochondrial function and reducing oxidative stress.24–26 Unlike benzoquinones, naphthoquinones, including vitamin K can be reduced to hydroquinones by two different enzymes in addition to NQO1. Specifically, vitamin K oxidoreductase 1 (VKORC1) and vitamin K oxidoreductase 1 like 1 (VKORC1L1).27–29 This suggests that in individuals carrying the inactivating NQO1 polymorphism, naphthoquinones can still be efficiently reduced by VKORC1 and VKORC1L1, which should lower the risk of generating unstable semiquinones as well as the associated elevated ROS production and toxicity.
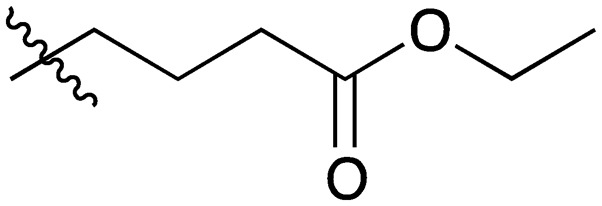
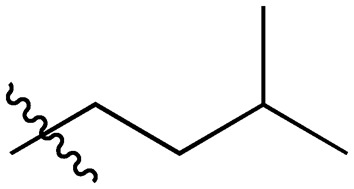
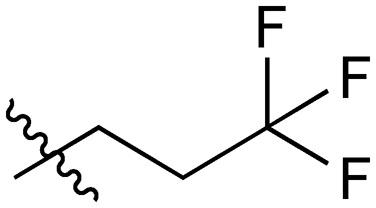
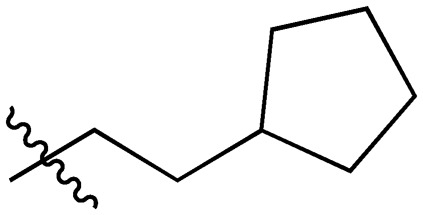
In order to investigate this hypothesis, we synthesized 77 novel short-chain 3-methyl-naphthoquinone derivatives that vary in the C2-position with differing length and functionality of the alkyl side chain. These compounds were subjected to two cellular models to evaluate their activity in ATP rescue and cell viability after exposure to the mitochondrial Complex I-inhibitor rotenone. It was demonstrated that the sidechain had a dramatic effect on the activity in both of these assays, particularly by incorporation of an amide bond into the sidechain (Fig. 2) and the results are discussed herein.
Fig. 2. Original class of peptide-coupled, redox-active naphthoquinones 3.
2. Results and discussion
2.1. Chemistry
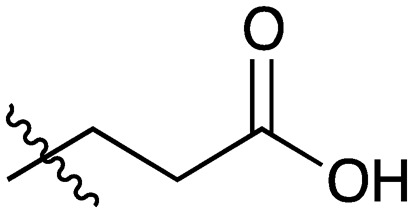
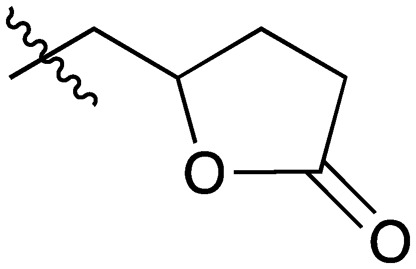
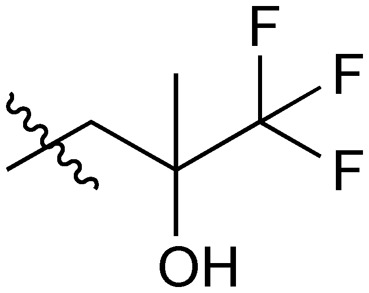
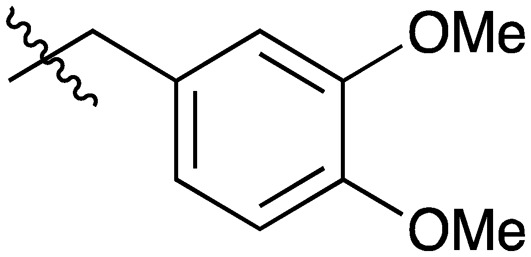
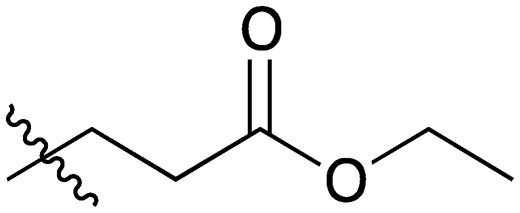
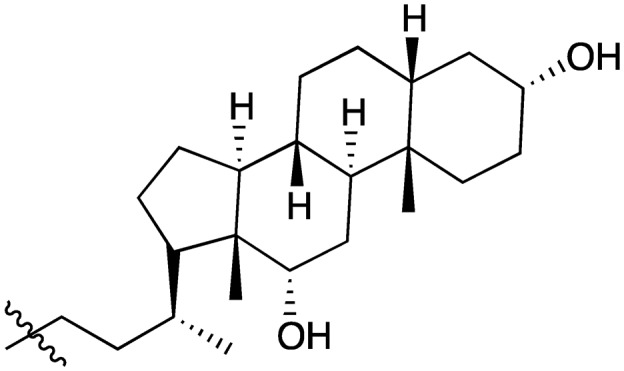
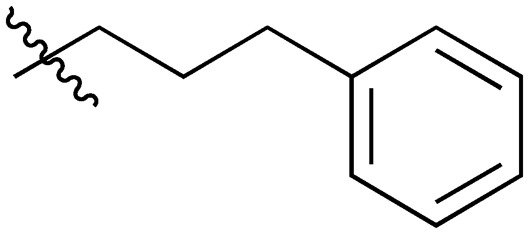
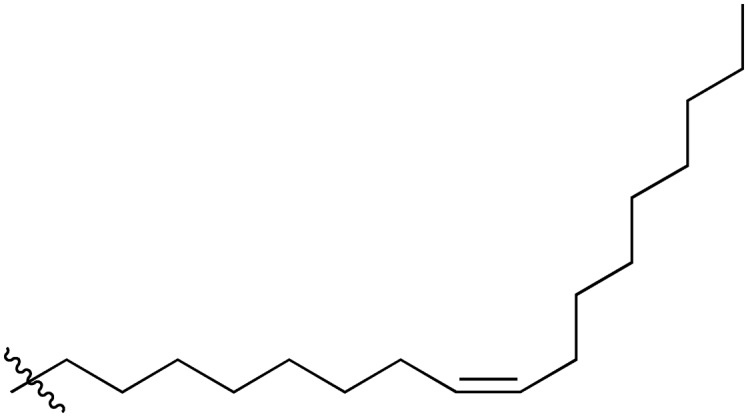
A series of short-chain-containing naphthoquinone analogues 5–7, 9–11 and 18–34 were synthesized from menadione (4) in a single step (Table 1). The installation of an alkyl side chain at the 3-position of the naphthoquinone core was facilitated via a silver-mediated radical decarboxylation.30 All analogues were purified by flash column chromatography and characterized. The structures of the substituted quinones were supported by 1H NMR spectroscopy with the absence of a singlet peak at 6.84 ppm indicating the loss of the proton attached to C3 of 2-methyl-1,4-naphthoquinone (4). Additional analogues 8, 12–17 were formed via standard functional group manipulations, including epoxidation and esterification reactions.
Table 1. Synthesized naphthoquinone analogues from menadione.

| |||
| Compound | R1 = | Compound | R1 = |
| 5 |

|
20 |
|
| 6 |
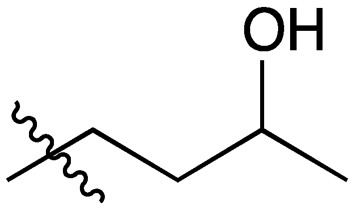
|
21 |
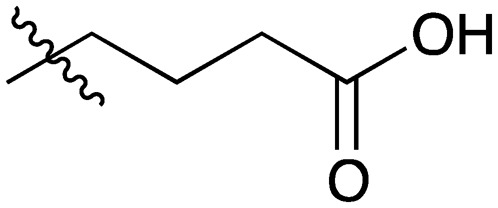
|
| 7 |
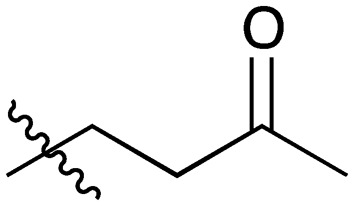
|
22 |
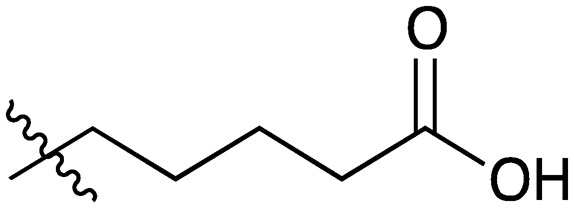
|
| 8 |

|
23 |

|
| 9 |
|
24 |

|
| 10 |
|
25 |

|
| 11 |
|
26 |

|
| 12 |
|
27 |

|
| 13 |

|
28 |

|
| 14 |

|
29 |

|
| 15 |
|
30 |
|
| 16 |

|
31 |
|
| 17 |

|
32 |
|
| 18 |
|
33 |
|
| 19 |
|
34 |

|
Another class of naphthoquinone analogues were synthesized primarily by coupling acids 20–23 with either ester-protected amino acids or primary amines. In this way, a library of amide-containing analogues 35–68 was prepared (Table 2). The trifluoroacetic acid-mediated deprotection of t-butyl esters 35–68 afforded acid derivatives 69–81 (Table 3).
Table 2. Analogues formed through the peptide coupling.

| |||||
| Compound | n = | Amino acid moeity | Compound | n = | Amino acid moeity |
| 35 | 2 | l-Phenylalanine methyl ester | 52 | 2 | d-Phenylalaninol |
| 36 | 2 | l-Phenylalanine t-butyl ester | 53 | 2 | d-Phenylglycinol |
| 37 | 2 | l-Proline t-butyl ester | 54 | 2 | l-Phenylglycinol |
| 38 | 2 | l-Norvaline t-butyl ester | 55 | 2 | Phenethylamine |
| 39 | 2 | Glycine t-butyl ester | 56 | 3 | l-Phenylalaninol |
| 40 | 2 | DMT-tic-Gly-Benz | 57 | 4 | l-Phenylalaninol |
| 41 | 2 | l-Leucine t-butyl ester | 58 | 2 | l-Threonine methyl ester |
| 42 | 2 | l-Tyrosine t-butyl ester | 59 | 2 | l-Serine methyl ester |
| 43 | 2 | l-Tyrosine t-butyl ester dimer | 60 | 3 | 3,4-Dimethoxyphenylethylamine |
| 44 | 2 | l-Prolinol | 61 | 3 | Tyramine |
| 45 | 2 | l-Phenylalaninol | 62 | 4 | Tyramine |
| 46 | 1 | l-Phenylalanine t-butyl ester | 63 | 4 | 3,4-Dimethoxyphenylethylamine |
| 47 | 3 | l-Phenylalanine t-butyl ester | 64 | 2 | Butylamine |
| 48 | 2 | Tryptamine | 65 | 2 | R-2-Hydroxy-4-amino-butyric acid |
| 49 | 2 | Tyramine | 66 | 2 | trans-4-Hydroxy-l-proline |
| 50 | 4 | l-Phenylalanine t-butyl ester | 67 | 2 | (S)-Phenylglycine methyl ester |
| 51 | 2 | 3,4-Dimethoxyphenylethylamine | 68 | 2 | (R)-Phenylglycine methyl ester |
Table 3. Synthesis of amido acid containing naphthoquinones.

| |||||
| Compound | n = | R′ | Compound | n = | R′ |
| 69 | 2 | l-Phenylalanine | 76 | 1 | l-Phenylalanine |
| 70 | 2 | l-Proline | 77 | 3 | l-Phenylalanine |
| 71 | 2 | l-Norvaline | 78 | 4 | l-Phenylalanine |
| 72 | 2 | l-Glycine | 79 | 2 | d-Phenylalanine |
| 73 | 2 | l-Leucine | 80 a | 2 | (S)-Phenylglycine |
| 74 | 2 | l-Tyrosine | 81 a | 2 | (R)-Phenylglycine |
| 75 | 2 | l-Phe-l-pro | |||
aAmino acid was formed by the Hydrolysis of the methyl ester, see ESI.
2.2. Toxicity
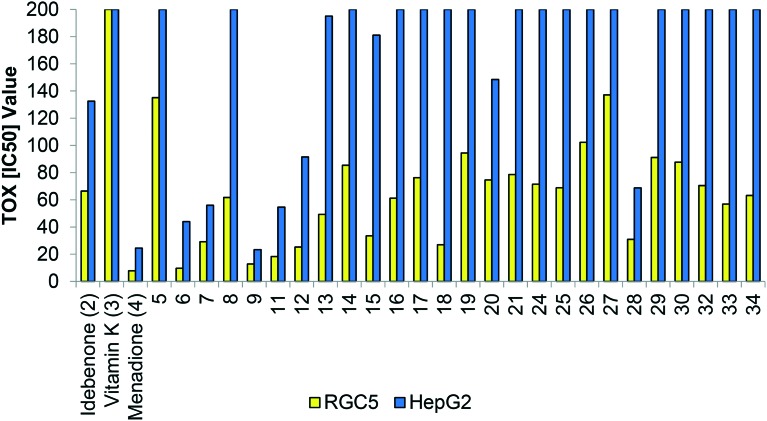
Incomplete quinone reduction to the semiquinone is associated with ROS production and toxicity.5 Therefore, we assessed the endogenous toxicity of the simple naphthoquinone derivatives 5–34 in two independent cell lines featuring either high (HepG2) or low (RGC5) reducing capacity. In the high reducing cell line, HepG2, the IC50 values for each compound were at least 200% of the respective values in the low reducing cell line, RGC5 (Fig. 3). This is indicative of lower toxicity and supports the hypothesis that cellular reducing capacity determines cellular toxicity of naphthoquinones. As an example, comparing idebenone (2) to the related naphthoquinone derivative 5, which only differ in the quinone moiety, resulted in a doubling of the IC50 value in both cell lines. (Fig. 3). This increase in the IC50 value illustrates that in otherwise identical compounds, the naphthoquinone moiety provides reduced cytotoxicity relative to the benzoquinone moiety. This effect is potentially explained by the aforementioned more efficient reduction (bioactivation) of the naphthoquinone by both vitamin K oxidoreductase (VKORC1) as well as NQO1 in comparison to the benzoquinone, which is exclusively reduced by NQO1.1 Although it is known that HepG2 cells express high levels of NQO1,1 expression of VKORC1 as the second reductase is unknown for both cell lines at present.
Fig. 3. Toxicity of individual naphthoquinones 5–34 measured in RGC5 and HepG2 cell lines. Concentrations are given as [μM]. IC50: Defined as drug concentration that reduces cellular survival by 50%. Note: Maximal concentration tested: 200 μM.
2.3. Cytoprotection against mitochondrial dysfunction
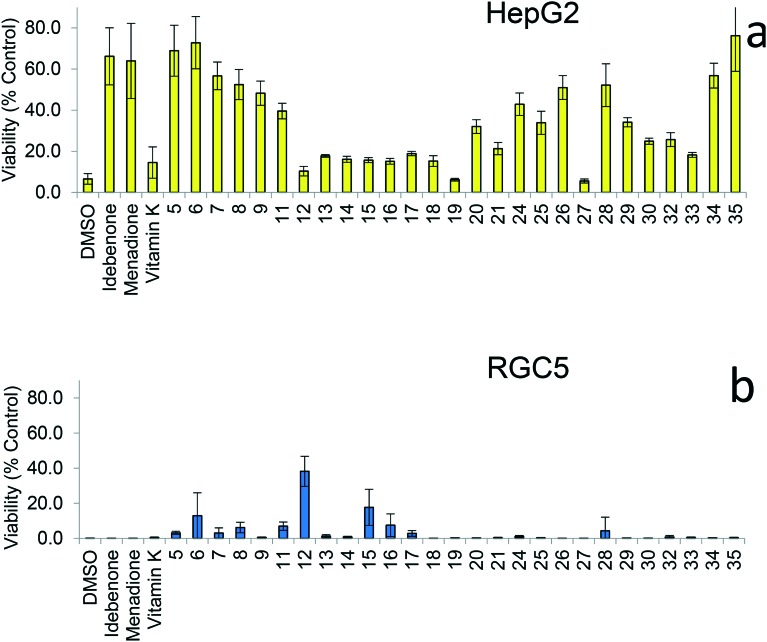
Naphthoquinones 5–9, 11–21, 24–30, 32–35 were evaluated for their ability to protect against rotenone-induced mitochondrial dysfunction in two different cell lines, RGC5 and HepG2. As rotenone inhibits mitochondrial complex I and therefore the production of ATP by oxidative phosphorylation it is a preliminary model for diseases associated with dysfunctional complex I such as LOHN.3 In both cell lines, several novel naphthoquinones provided increased cytoprotection compared to the reference compound idebenone (2) (Fig. 4a and b). However, consistent with previous studies featuring benzoquinones,2 no clear structure activity relationship (SAR) with various functionalities within the initial suite of analogues 5–9, 11–21, 24–30, 32–35 could be established. Nevertheless, the idebenone-like analogue 5 induced a high level of cytoprotection, which indicated that this was influenced by the introduction of oxygen into the alkyl side chain. Compound 27, which does not contain a terminal alcohol substituent exhibited little to no protective activity. However, reducing the alkyl chain length at the 2-position provided an increase in cytoprotective activity (i.e., molecules 24–26). Following this observation, derivatives containing shorter, oxygenated alkyl side-chains (i.e., ≤C10) were synthesised and a number of these analogues (6 and 7) provided high levels of cytoprotection (Fig. 4a). Cytoprotection was also observed to be cell line dependent, as demonstrated for RGC5 cells, which afforded the highest degree of cytoprotection by three-carbon ethyl ester 12 (Fig. 4b). In comparison, HepG2 cells showed little cytoprotection from this particular analogue, while idebenone-like structure 5 and hydroxybutyl analogue 6 achieved the highest protection (Fig. 4a). This is surprising in the light of previous data for benzoquinones that demonstrated no species or tissue dependence for biological activity.2
Fig. 4. Cytoprotection by quinones (5–9, 11–21, 24–30, 32–35) at 10 μM given as a relative percentage cell survival against rotenone induced complex I dysfunction in HepG2 (a) and RGC5 (b) cell lines.
2.4. Cyclic voltammetry
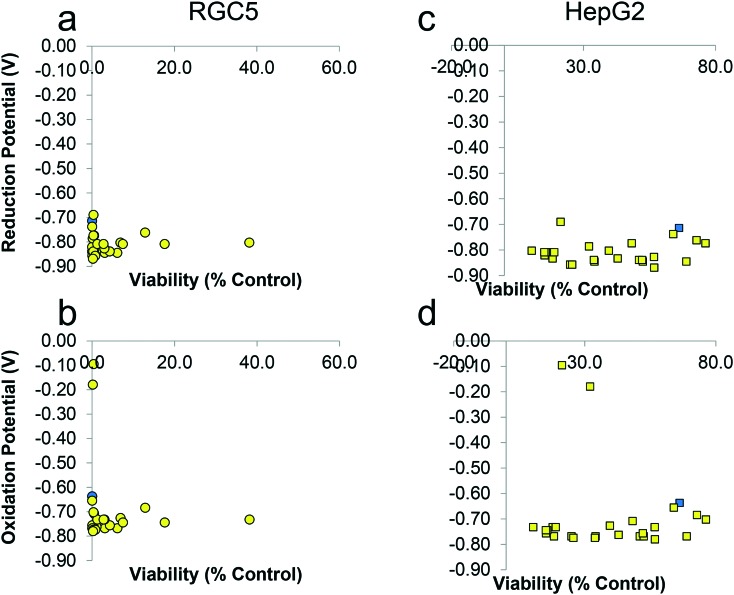
In agreement with previous studies,1 the results from the two cell lines with different reduction capacity could be an indication that the reduction of the quinone to the hydroquinone is essential for their antioxidant function. This is hypothesized due to their ability to donate electrons to the mitochondrial electron transport chain which is believed to be responsible for cytoprotection.4 Therefore, we correlated the cytoprotective effects of compounds with their redox characteristics. Intriguingly, despite significant differences in the cytoprotective potential of these compounds, no correlation between the redox potentials of each analogue to its cytoprotective capacity was observed in either cell lines (Fig. 5a–d). Any major difference of the redox profile for the compounds was attributed to the functional groups in the side chain and not the quinone. For example, carboxylic acids show non-reversible oxidation consistent with electrochemical oxidative decarboxylation.31
Fig. 5. Cytoprotection by naphthoquinones (10 μM) versus their redox characteristics as determined by cyclic voltammetry in two cell lines RGC5 (a and b) and HepG2 (c and d). each data point is the average of 3 independent experiments with 6 replicates within each experiment for viability and 1 experiment for cyclic voltammetry (blue dots are for idebenone as a reference). Error bars were omitted for clarity.
As no significant difference in redox characteristics was observed across naphthoquinone analogues 5–9, 11–21, 24–30, and 32–35, this strongly suggests that they do not influence the cytoprotective activity in the series of naphthoquinone compounds. This is reinforced by comparing the benzoquinone-containing idebenone (2) (Eox = –0.637 V vs. SCE; Ered = –0.714 V vs. SCE) and naphthoquinone-containing analogue 5 (Eox = –0.768 V vs. SCE; Ered = –0.845 V vs. SCE). When taken together, these data also indicate that the specific functionality of the alkyl side chain has a greater effect on cytoprotective activity than the specific redox-characteristics of the quinones. This conclusion is in agreement with earlier studies using a range of benzoquinones.2,10
2.5. Structure–activity relationships
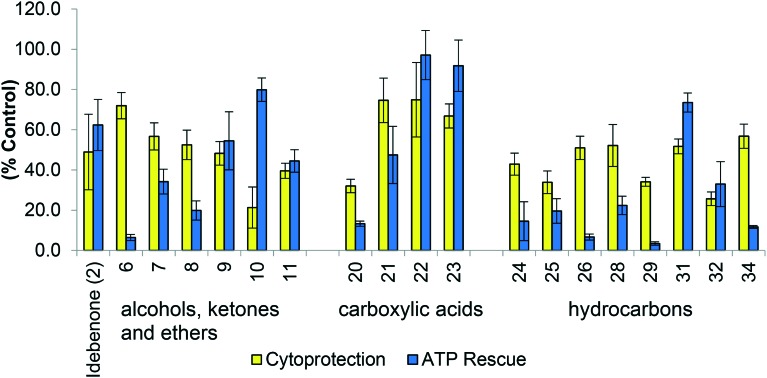
For this study, protection of viability and acute rescue of ATP levels were used to establish SAR as both were deemed to indicate normal cell function. Initially, using a limited number of compounds, no clear structure activity could be established. The compounds were grouped based on the side chain functionalities of increasing polarity (aliphatic hydrocarbons, slight polarity i.e. alcohols, ketones and ethers, carboxylic acid and aliphatic esters) to determine whether SAR based on the functional groups could be established. Within the initial suite of compounds (5–34), no clear SAR in relation to either cytoprotection or ATP rescue was established (Fig. 6). A general grouping was observed for aliphatic analogues, which were generally unable to rescue ATP levels in the presence of the mitochondrial inhibitor rotenone, whilst having a varied ability to protect cell viability. However, the analogues containing an acid functionality and the slightly polar analogues showed varied responses in both assays (Fig. 6). The polarity of the acid functionality appeared to show an increase in cytoprotective ability and the capacity to rescue ATP levels, however, both were still below 100% of normal function (∼60–90%) (Fig. 6).
Fig. 6. Biological evaluation of polar, aliphatic and acid derivatives in two assays (i) Cytoprotection against rotenone induced complex I dysfunction by quinones at 10 μM given as a relative percentage of cell survival compared to untreated HepG2 cells (ii) ATP rescue by quinones at 10 μM in the presence of rotenone-induced complex I dysfunction as percentage of untreated HepG2 cells. Data represents the mean of n = 3 independent experiments with 6 replicates each. Note: Analogues had to provide at least 30% of normal function in either assay to be included in the above figure. Aliphatic esters 12–17 are not present in this graph as they showed minimal activity in both assays.
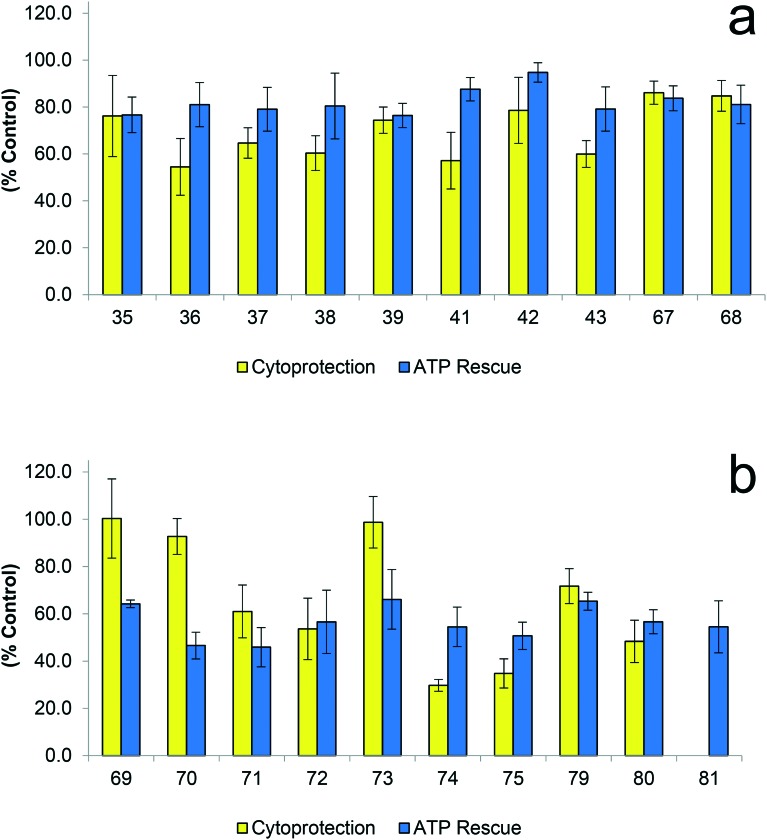
These results led to the optimization of the current suite of analogues to generate compounds with high levels of cytoprotection and the ability to efficiently rescue ATP levels. In order to increase polarity and potential solubility, an amino acid fragment was introduced onto the carboxylic acid of the alkyl side chain. Due to synthetic processes, both the amido acid and amido ester intermediate were evaluated for biological activity and resulted in a noticeable trend (Fig. 7).
Fig. 7. Biological evaluation of amido ester (a) and amido acid (b) derivatives in two assays (i) Cytoprotection against rotenone induced complex I dysfunction by quinones at 10 μM given as a relative percentage of cell survival compared to untreated HepG2 cells (ii) ATP rescue by quinones at 10 μM in the presence of rotenone-induced complex I dysfunction as percentage of untreated HepG2 cells. Data represents the mean of n = 3 independent experiments with 6 replicates each.
Analogues 69, 70 and 73, containing amido acid moiety, showed high levels of cytoprotection ∼90–100% (Fig. 7a) but no compounds performed well in the ATP rescue assay ∼5–70% (Fig. 7b). However, the less polar amido ester analogues exhibited the reverse effect, with analogues 41 and 42 showing high levels of activity in the ATP rescue (∼90%), while not showing high levels of cytoprotection (Fig. 7a). This result indicates that amido acids may be too polar to provide activity that increases both ability to restore ATP levels and provide cytoprotection. From this observation, the synthesis of amido alcohol derivatives or equivalent amide derivatives to provide analogues with an intermediate level of polarity was performed and their activity evaluated (Fig. 8).
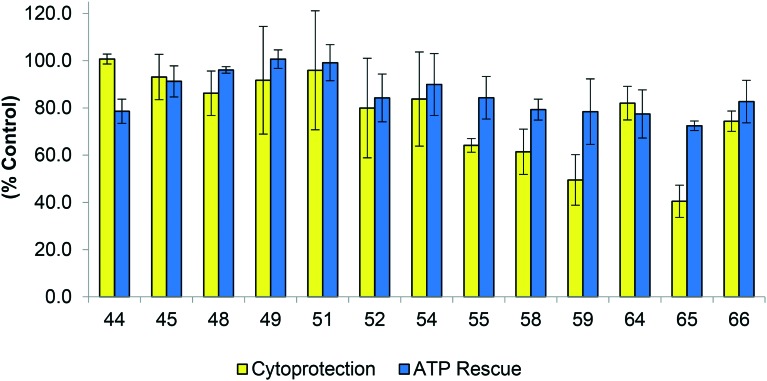
Fig. 8. Biological evaluation of amino alcohol derivatives in two assays (i) Cytoprotection against rotenone induced complex I dysfunction by quinones at 10 μM given as a relative percentage of cell survival compared to untreated HepG2 cells (ii) ATP rescue by quinones at 10 μM in the presence of rotenone-induced complex I dysfunction as percentage of untreated HepG2 cells. Data represents the mean of n = 3 independent experiments with 6 replicates each.
In general, these analogues exhibited both very high levels of cytoprotection (∼90–100%) and also efficiently rescued ATP levels (80–100%) (Fig. 8), which were all significantly more active than idebenone (2). Specifically, compounds 45 (l-phenylalaninol), 48 (tryptamine), 49 (tyramine) and 51 (3,4-dimethylphenylethylamine) provided exceptional results with these analogues exhibiting normal cell function (∼100%) in both assays (Fig. 8). The measure of ATP levels after acute, short term exposure to determine protective activity of a compound is not a reliable indicator for its potential therapeutic use if cells are not viable over a longer period of time. Therefore a combination of both ATP rescue and cell viability was used as a representative model to screen potential therapeutics to protect mitochondrial function. Five derivatives, l-phenylalanine t-butyl ester (36), l-phenylalaninol (45), tyramine (49), 3,4-dimethoxyphenethylamine (51) and l-phenylalanine (69) derivatives were identified as analogues utilised for further SAR studies (Fig. 9).
Fig. 9. Structures of the top five analogues 36, 45, 49, 51 and 69 which were selected to perform further structure activity relationship (SAR) studies.
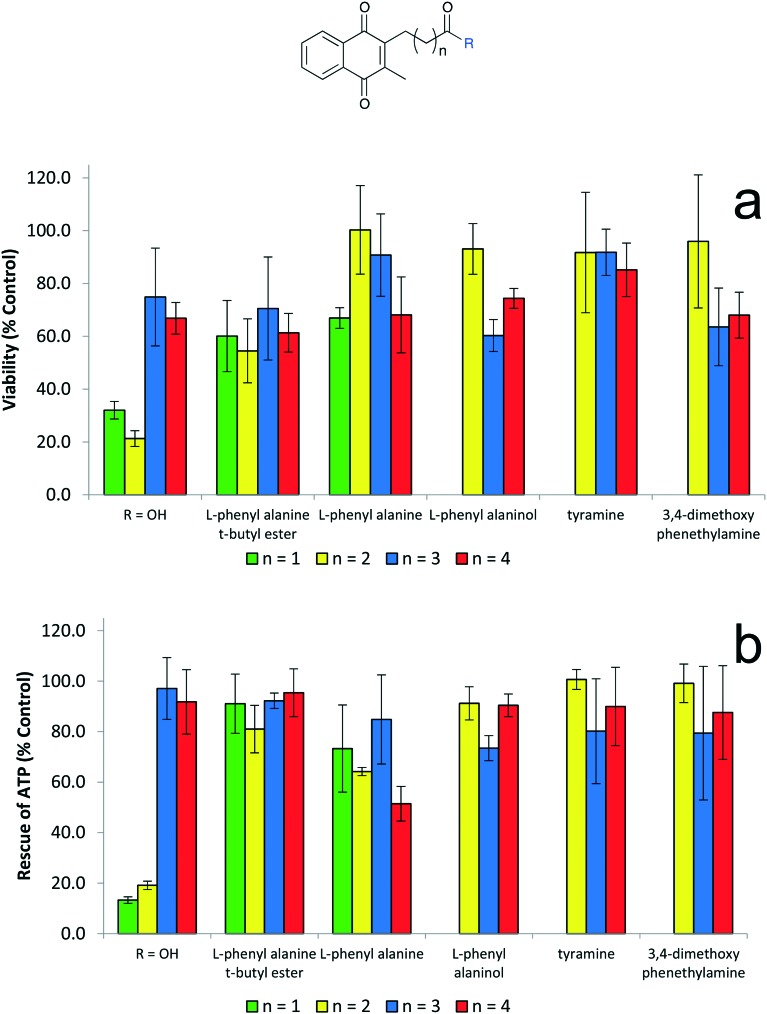
Using these amido moieties, further investigation into other structural requirements were investigated. From the toxicity data it was proposed that the naphthoquinone core was ideal, providing significant less toxicity than the benzoquinone core. However, between the core and the amido moieties was a four-carbon linker. The impact the length of the linker had on the ability of the analogue to provide protection was unknown. For this reason analogues containing a three-, five- and six-carbon linkers were synthesised. Therefore, carboxylic acid analogues 20, 22 and 23 were coupled to these five amido fragments and subjected to biological evaulation (Fig. 10).
Fig. 10. A comparison of linker length of top five analogues in assays (a) cytoprotection against rotenone induced complex I dysfunction by quinones at 10 μM given as a relative percentage of cell survival compared to untreated HepG2 cells (b) ATP rescue by quinones at 10 μM in the presence of rotenone-induced complex I dysfunction as percentage of untreated HepG2 cells. Data represents the mean of n = 3 independent experiments with 6 replicates each.
There was no significant difference between the 3-, 4- and 6-carbon linkers with respect to the 4-carbon linker (Fig. 10). In general, with exception of the free carboxylic acid derivatives, the 4-carbon linker did provide the highest level of activity (Fig. 10). Surprisingly, the free carboxylic acids showed significant differences in activity. The 5- and 6-carbon carboxylic acid derivatives 22 and 23 featured much improved activity in both ATP rescue and cytoprotection when compared to the three- and four- carbon carboxylic acid derivatives 20 and 21. In fact, addition of the amine derivative to the side chain barely had any effect on activity in these cases. However, these straight-chain carboxylic acid derivatives would be susceptible to the oxidative degradation observed for idebenone (2)20 and are still not quite as active as the amido derivatives. This result combined with the fact that all initial analogues were sythesised from the four-carbon linker, suggested that there was no benefit to changing the linker length to explore any further structure activity relationships (SARs). Therefore incorprating an amide or peptide bond into the sidechain has the effect of increasing both the activity of in ATP rescure and cell viability assays which is optimal for terating mitochrondrial disorders that inactivate complex I. However, the role of this structural feature remains unclear and further investigation is required.
3. Conclusion
Our results indicate that the increased protective activity and reduced toxicity of some naphthoquinones are likely the result of enhanced bioactivation of naphthoquinones by both VKOR enzymes and NQO1, which is a highly cell-type dependent process. For the first time, we report a SAR of naphthoquinones for cell viability and ATP rescue for mitochondrial dysfunction. Our results indicate that the functionality of the alkyl side chain determines the cytoprotective potential of individual compounds to a much larger extent than previously recognized. From the analogues investigated, a variety of important factors were identified. Through modification of the linker and the amide functionality, 30 analogues provided higher levels of cytoprotection than that of the lead compound idebenone (2) which is approved for treatment of LOHN in Europe. Development of SAR has given a clear indication that although the quinone core is essential to be able to shuttle electrons through the electron transport chain, it does not influence the analogue's ability to provide cytoprotection or restore ATP levels. This was also supported by Erb et al. when investigating idebenone derivatives.2
Similarly, a 4-, 5- and 6-carbon linkers had little effect on activity. The most significant outcome has been the effect that groups in the side-chain have on the ability for an analogue to provide both cytoprotection and restore ATP levels. A balanced level of polarity in the side chain resulted in significantly increased cytoprotection when compared to idebenone. Although previous literature indicates the importance of an analogue's ability to restore ATP levels as the key factor, little emphasis was placed on cytoprotection as it was assumed that increased ATP would result in cytoprotection. However, this study suggests that this is not the case. While ATP rescue is a rapid one-hour assay, it is not a realistic measure if the cells do not survive over time with cytoprotection being a five-day assay. This study has demonstrated the importance of the side-chain to tune/modify activity independently of the quinone core, with numerous examples demonstrating increased ATP but no increase in cytoprotection. Therefore, our results can direct the rational development of novel short-chain quinone compounds for the treatment of disorders associated with mitochondrial dysfunction.
4. Experimental
4.1. General
A representative sample of compounds are reported in the experimental section. The synthesis and spectral data for all other compounds is available in the supplementary information.
NMR experiments were performed either on a Bruker Avance III NMR spectrometer operating at 400 MHz (1H) or 100 MHz (13C) or on a Bruker Avance III NMR spectrometer operating at 600 MHz (1H) or 150 MHz (13C). The deuterated solvent used was CDCl3 unless otherwise specified. Chemical shifts were recorded in ppm. Spectra were calibrated by assignment of the residual solvent peak to δH 7.26 and δC 77.16 for CDCl3. Coupling constants (J) were recorded in Hz. Infrared spectrometry was performed on a Shimadzu FTIR 8400 s spectrometer, with samples analyzed either as thin films on NaCl plates or using an ATR attachment. ESIMS analyses were conducted on a Thermo-Scientific LTQ-Orbitrap mass spectrometer. EIMS analyses were performed using a Kratos Analytical Concept ISQ hybrid magnetic sector quadrupole tandem or Shimadzu GCMS-QP2010 mass spectrometers.
TLC was performed using Merck silica gel 60-F254 plates. Developed TLC plates were visualized by UV absorbance (254 nm) or through application of heat to a plate stained with cerium molybdate {Ce(NH4)2(NO3)6, (NH4)6Mo7O24·4H2O, H2SO4, H2O}. Flash column chromatography was performed with flash grade silica gel (60 μm) and the indicated eluent in accordance with standard techniques. Unless otherwise specified, reactions were conducted with magnetic stirring under N2. Unless otherwise specified all reagents employed in these studies were used as received from Sigma-Aldrich, AK Scientific, combi-blocks, and oakwood and were used without purification.
4.2. Chemistry
General Procedure A: Silver-mediated radical decarboxylation general method
Carboxylic acid (2 equiv.) was added to a magnetically stirred solution of menadione (1 equiv.) in CH3CN/H2O (3 : 1) and the ensuing mixture was heated to 75 °C. AgNO3 (0.1 equiv.) was then added, followed by the slow addition of (NH4)2S2O8 (2.5 equiv.) in H2O (5 mL) over 10 min. The resulting mixture was stirred for a further 1 h. The mixture was cooled to room temperature, extracted with CH2Cl2 and the organic extract washed with H2O. The organic layer was dried (MgSO4), filtered and the solvent removed under reduced pressure to give the crude product, which was purified by flash column chromatography (silica gel).
General procedure B: quinone amide coupling general method
Quinone acid (1 equiv.) was added to anhydrous CH2Cl2 (5–10 ml) under an atmosphere of N2 and cooled to 0 °C. Amine derivative (1 equiv.), DMAP (0.1 equiv.), triethylamine (Et3N, 2.5 equiv.) and either EDCI, BOP or PyBOP (1.4 equiv.) were added successively and the reaction mixture warmed slowly to room temperature before leaving overnight. The reaction was quenched with H2O (20 mL) and the organic layer was washed with KHSO4 (saturated aqueous solution), NaHCO3 (saturated aqueous solution) and H2O. The organic layer was dried (MgSO4), filtered and the solvent removed under reduced pressure to give the crude product, which was purified by flash column chromatography (silica gel) to give the desired amide.
General procedure C: t-butyl ester deprotection method
The t-butyl esters were added to 10% TFA in CH2Cl2 (5.0 mL) and the reaction mixture was stirred at room temperature overnight. After this time, the solvent removed under reduced pressure. The crude product was purified by flash column chromatography (silica gel) to give the carboxylic acid derivative.
2-(10-Hydroxydecyl)-3 methyl-1,4-naphthoquinone (5)
Naphthoquinone 5 was prepared according to general procedure A from menadione (201 mg, 1.17 mmol) and 11-hydroxyundecanoic acid (467 mg, 2.30 mmol) and the product purified by flash chromatography (40% ethyl acetate/hexanes) to give 5 as a pale yellow solid in 19% yield (168 mg, 0.511 mmol). mp 74–75 °C.
δ H (400 MHz; CDCl3): 1.24–1.57 (m, 16H), 2.17 (s, 3H), 2.61 (t, J = 7.0 Hz, 2H), 3.62 (t, J = 6.6 Hz, 2H), 7.65–7.69 (m, 2H), 8.04–8.07 (m, 2H); δC (100 MHz, CDCl3): 12.8, 25.8, 27.2, 28.9, 29.5, 29.6, 29.7, 30.1, 32.9, 63.2, 126.3, 126.4, 132.3, 132.4, 133.4, 133.5, 143.3, 147.7, 184.9, 185.5 (one carbon overlapping); νmax/cm–1: 3525, 2917, 2848, 1658, 1618, 1593, 1459, 1738, 1327, 1297, 717 cm–1; HRMS: for C21H28O3, predicted 328.20384, found 328.20383, m/z 328 (M+, 62%), 310 (5), 211 (10), 187 (100), 174 (12) 158 (18).
4-(3-Methyl-naphthoquione-2-yl)butanoic acid (21)
Naphthoquinone 21 was prepared according to general procedure A from menadione (4) (5.998 g, 34.83 mmol) and glutaric acid (4.611 g, 34.89 mmol) and the product purified by flash chromatography (100% dichloromethane followed by 100% ethyl acetate) to give 21 as a bright yellow crystalline solid in 62% yield (5.579 g, 21.67 mmol). whose spectral data were consistent with that reported previously; (ref. 32) δH (400 MHz; CDCl3): 1.82 (quin, J = 7.4 Hz, 2H), 2.20 (s, 3H), 2.46 (t, J = 7.4 Hz, 2H), 2.69 (t, J = 7.4 Hz, 2H), 7.66–7.69 (m, 2H), 8.04–8.06 (m, 2H); δC (100 MHz, CDCl3): 12.8, 23.5, 26.4, 33.8, 126.4, 126.5, 132.2, 132.28, 133.61, 133.62, 144.1, 146.2, 179.3, 184.7, 185.3; νmax/cm–1: 3064, 2938, 1706 (C O), 1658 (C O), 1616, 1595, 1412, 1379, 1295, 1260, 717, 660 cm–1
(S)-tert-Butyl-2-(4-(3-methyl-1,4-naphthoquinone-2-yl)butanamido)-3-phenylpropanoate (36)
Naphthoquinone 36 was prepared according to general procedure B from 4-(3-methyl-1,4-naphthalen-2-yl)-butanoic acid (21) (504.2 mg, 1.9522 mmol) and l-phenylalanine t-butyl ester. HCl (489.4 mg, 1.9023 mmol) and the product purified by flash chromatography (40% ethyl acetate/hexanes) to give 36 as yellow oil in 36% yield (317 mg, 0.687 mmol).
δ H (400 MHz; CDCl3): 1.40 (s, 9H), 1.78 (quin, J = 7.6 Hz, 2H), 2.17 (s, 3H), 2.27 (t, J = 7.6 Hz, 2H), 2.60–2.62 (m, 2H), 3.04–3.13 (m, 2H), 4.74–4.79 (m, 1H), 6.09 (d, J = 7.8 Hz, 1H), 7.14–7.27 (m, 5H), 7.66–7.69 (m, 2H), 8.04–8.07 (m, 2H); δC (100 MHz, CDCl3): 12.8, 24.3, 26.3, 28.0, 36.1, 38.2, 53.5, 82.4, 126.3, 126.4, 127.0, 128.4 (2 × C), 129.5 (2 × C), 132.21, 132.26, 133.4, 133.5, 136.3, 144.0, 146.4, 170.9, 171.8, 184.8, 185.3; [α]D:20 +36.24° (c 0.91, CHCl3); νmax/cm–1: 3420 (N–H), 2978, 1732 (C O), 1658 (C O), 1595, 1525, 1367, 1329, 1294, 1257, 1226, 1155, 700 cm–1; HRMS [M + Na]: for C28H31N1O5Na, predicted 484.2100, found 484.2110
(S)-2-(4-(3-Methyl-1,4-naphthoquinone-2-yl)butanamido)-3-phenylpropanoic acid (7a)
Naphthoquinone 69 was prepared from the deprotection of 36 (317.3 mg, 0.6875 mmol), using general procedure C. The product was purified by flash chromatography (5% methanol/ethyl acetate) to give 69 as brown viscous oil in 79% yield (220 mg, 0.542 mmol).
δ H (400 MHz; CDCl3): 1.72–1.79 (m, 2H), 2.14 (s, 3H), 2.29 (t, J = 7.2 Hz, 2H), 2.58 (t, J = 7.8 Hz, 2H), 3.12 (dd, J = 14.0, 7.0 Hz, 1H), 3.26 (dd, J = 14.0, 5.4 Hz, 1H), 4.90 (m, 1H), 6.54 (d, J = 7.7 Hz, 1H), 7.17–7.28 (m, 5H), 7.66–7.69 (m, 2H), 8.02–8.05 (m, 2H), 8.92 (bs, 1H); δC (100 MHz, CDCl3): 12.8, 24.2, 26.2, 35.8, 37.3, 53.4, 126.4, 127.2, 128.7 (2 × C), 129.4 (2 × C), 132.0, 132.2, 133.5, 133.6, 135.9, 144.3, 146.2, 173.5, 174.7, 185.1, 185.2; [α]D:20 +35.83° (c 0.24, CHCl3); νmax/cm–1: 3491 (N–H), 2931, 1716 (C O), 1660 (C O), 1616, 1595, 1521, 1456, 1332, 1296, 1267, 1217, 702 cm–1; HRMS [M + Na]: for C24H23N1O5Na, predicted 428.1474, found 428.1484.
(S)-N-(1-Hydroxy-3-phenylpropan-2-yl)-4-(3-methyl-1,4-naphthyoquinone-2-yl)butanamide (45)
Naphthoquinone 45 was prepared according to general procedure B from 4-(3-methyl-1,4-naphthalen-2-yl)-butanoic acid (21) (133.5 mg, 5169 mmol) and l-phenyl analinol (76.4 mg, 0.5053 mmol) and the product purified by flash chromatography (100% ethyl acetate) to give 45 as yellow/orange oil in 49% yield (97.7 mg, 0.2496 mmol).
δ H (400 MHz; CDCl3): 1.70–1.78 (m, 2H), 2.15 (s, 3H), 2.25 (t, J = 7.2 Hz, 2H), 2.55 (t, J = 8.0 Hz, 2H), 2.83–2.94 (m, 2H), 3.03 (bs, 1H), 3.59 (dd, J = 11.2, 5.4 Hz, 1H), 3.71 (dd, J = 11.2, 3.8 Hz, 1H), 4.21–4.29 (m, 1H), 6.31 (d, J = 8.0 Hz, 1H), 7.15–7.27 (m, 5H), 7.64–7.69 (m, 2H), 8.00–8.05 (m, 2H); δC (100 MHz, CDCl3): 12.7, 24.3, 26.2, 36.2, 37.0, 52.9, 64.1, 126.35, 126.36, 126.6, 128.6 (2 × C), 129.2 (2 × C), 132.0, 132.1, 133.5, 133.6, 137.9, 144.2, 146.2, 173.1, 185.12, 185.13; [α]D:20 –21.33° (c 1.57, CHCl3); νmax/cm–1: 3369 (N–H), 3296 (–OH), 2933, 1658 (C O), 1595, 1539, 1456, 1377, 1330, 1296, 1043, 717, 702 cm–1; HRMS [M + Na]: for C24H25N1O4Na, predicted 414.1676, found 414.1667.
N-(4-Hydroxyphenylethyl)-4-(3-methyl-1,4-naphthoquinone-2-yl) butanamide (49)
Naphthoquinone 49 was prepared according to general procedure B from 4-(3-methyl-1,4-naphthalen-2-yl)-butanoic acid (21) (235.6 mg, 0.9122 mmol) and tyramine (119.0 mg, 0.8675 mmol) and the product purified by flash chromatography (80% ethyl acetate/hexanes) to give 49 as yellow solid in 33% yield (108.9 mg, 0.2885 mmol). mp 116–118 °C.
δ H (400 MHz; CDCl3): 1.76 (quin, J = 7.5 Hz, 2H), 2.12 (s, 3H), 2.24 (t, J = 7.2 Hz, 2H), 2.56–2.60 (m, 2H), 2.71 (t, J = 7.0 Hz, 2H), 3.44–3.49 (m, 2H), 6.22 (t, J = 5.5 Hz, 1H), 6.75 (d, J = 8.4 Hz, 2H), 6.96 (d, J = 8.4 Hz, 2H), 7.62–7.65 (m, 2H), 7.97–8.00 (m, 2H); 13C NMR δC (100 MHz, CDCl3): 12.7, 24.4, 16.3, 34.7, 36.1, 41.1, 115.7, 126.3, 129.8 (2 x C), 129.9, 132.0, 132.1, 133.53, 133.59, 144.2, 146.2, 155.3, 173.1, 185.0, 185.2; νmax/cm–1: 3365 (N–H), 3306 (–OH), 2935, 1654 (C O), 1616, 1595, 1541, 1516, 1375, 1330, 1296, 715 cm–1; HRMS [M + Na]: for C23H23N1O4Na, predicted 400.1519, found 400.1510.
N-(3,4-Dimethoxyphenylethyl)-4-(3-methyl-1,4-naphthoquinone-2-yl)butanamide (6r)
Naphthoquinone 51 was prepared according to general procedure B from 4-(3-methyl-1,4-naphthalen-2-yl)-butanoic acid (21) (187.5 mg, 0.7260 mmol) and 3,4-dimethoxyphenylethylamine (146.6 mg, 0.8088 mmol) and the product purified by flash chromatography (90% ethyl acetate/hexanes) to give 51 as pale orange crystalline solid in 38% yield (117.0 mg, 0.2776 mmol). mp 105–108 °C.
δ H (400 MHz; CDCl3): 1.77 (quin, J = 7.2 Hz, 2H), 2.16 (S, 3H), 2.22 (t, J = 7.2 Hz, 2H), 2.58–2.62 (m, 2H), 2.74 (t, J = 7.2 Hz, 2H), 3.46–3.51 (m, 2H), 3.79 (s, 3H), 3.81 (s, 3H), 5.94 (t, J = 5.6 Hz, 1H), 6.68–6.76 (m, 3H), 7.63–7.66 (m, 2H), 7.98–8.02 (m, 2H); δC (100 MHz, CDCl3): 12.7, 24.3, 26.3, 35.2, 36.1, 40.7, 55.8, 55.9, 111.4, 111.9, 120.7, 126.25, 126.29, 131.4, 132.0, 132.1, 133.4, 133.5, 144.0, 146.2, 147.7, 149.0, 172.3, 184.8, 185.1; νmax/cm–1: 3377 N–H), 3296, 2935, 1656 (C O), 1595, 1516, 1462, 1329, 1294, 1261, 1236, 1157, 1141, 1028, 717 cm–1; HRMS [M + Na]: for C25H27N1O5Na, predicted 444.1781, found 444.1773.
4.3. Cell culture
Human hepatic carcinoma cells (HepG2, ECACC) and rodent retinal precursor cells (RGC5, ATCC) were used for this study. Cells were cultivated under standard conditions (95% humidity, 5% CO2, 37 °C) in DMEM media containing 5% FCS (for RGC5) or 10% FCS (for HepG2) to achieve comparable growth rates. Both cell lines were selected based on their high (HepG2) and low reducing capacity (RGC5), which is associated with high and low expression of NQO1 (data not shown).1,3
4.4. Compound toxicity
To assess the toxicity inherent to these compounds, IC50 values (defined as the concentration necessary to reduce cell viability by 50%) were generated using a commercially available viability assay according to the manufacturers' recommendations (WST-1, Roche Diagnostics).
4.5. Cytoprotection in the presence of mitochondrial dysfunction
Cytoprotection against mitochondrial dysfunction was measured as previously described.3 Briefly, 5000 HepG2 cells per well were preincubated with quinones (10 μM) in a 96 well plate for 2 days prior to being challenged by the mitochondrial complex I inhibitor rotenone (1 μM) for 6 hours in Hanks balanced salt solution (HBSS). After post incubation with only quinones in HBSS for additional 24 h, cell viability was quantified by analysing ATP content per well using a luciferase-based reaction as described previously.3 Cytoprotection is displayed as a percentage of the untreated (no rotenone) control. Data represent the average of 3 independent experiments with n = 6 wells within each experiment. Error bars = SD.
4.6. Acute rescue of ATP levels
Acute rescue of ATP levels in the presence of the mitochondrial inhibitor rotenone was measured as previously described.2 Briefly, 15 000 HepG2 cells per well were seeded in a 96 well plate and allowed to attach overnight. After 24 h, cells were incubated with quinones (10 μM) along with the mitochondrial complex I inhibitor rotenone (10 μM) for 1 hour in glucose-free growth media before immediately measuring ATP levels using a luciferase-based reaction as described previously.2 Acute rescue of ATP levels is displayed as a percentage of the untreated (no rotenone) control. Data represent the average of 3 independent experiments with n = 6 wells within each experiment. Error bars = SD.
4.7. Cyclic voltammetry
Cyclic voltammetry (CV) studies were carried out using a Metrohm 797 VA fitted with a glassy carbon working electrode, a platinum auxiliary electrode and a saturated calomel reference electrode (SCE). Measurements were performed at room temperature in 20 mL of a 0.1 M NBu4ClO4 solution in CH3CN containing the naphthoquinones at a concentration of 1 mM. The electrochemical cell was deoxygenated by purging with N2 for 2 minutes before scanning between –0.850 and 0.500 V (vs. SCE) at a scan rate of 100 mV s–1. The electrodes and measurement cell were rinsed with CH3CN between each experiment.
Author contributions
Conceived and designed the experiments: JAS, NG, KLW, MN. Performed the experiments: KLW, MN, MNK, MC. Analysed the data: KLW, MN. Contributed reagents/materials/analysis tools: JAS, NG, TWL, AB. Wrote the paper: KLW, MN, NG, AB, JAS.
Conflicts of interest
Associate Professor Nuri Gueven acts as scientific consultant to Santhera Pharmaceuticals (Pratteln, Switzerland) that develops idebenone for diverse neuromuscular and mitochondrial indications.
Supplementary Material
Acknowledgments
We gratefully acknowledge the Royal Hobart Hospital Research Foundation (RHHRF) and the University of Tasmania School of Natural Sciences – Chemistry for financial support and the University of Tasmania Central Science Laboratory for providing access to NMR spectroscopy services. K. L. W. thanks the University of Tasmania for a Tasmanian Graduate Research Scholarship. We thank Santhera Pharmaceuticals (Pratteln, Switzerland) for providing us with idebenone.
Footnotes
†Electronic supplementary information (ESI) available. See DOI: 10.1039/c8md00582f
References
- Haefeli R. H., Erb M., Gemperli A. C., Robay D., Courdier Fruh I., Anklin C., Dallmann R., Gueven N. PLoS One. 2011;6:e17963. doi: 10.1371/journal.pone.0017963. [DOI] [PMC free article] [PubMed] [Google Scholar]
- Erb M., Hoffmann-Enger B., Deppe H., Soeberdt M., Haefeli R. H., Rummey C., Feurer A., Gueven N. PLoS One. 2012;7:e36153. doi: 10.1371/journal.pone.0036153. [DOI] [PMC free article] [PubMed] [Google Scholar]
- Heitz F. D., Erb M., Anklin C., Robay D., Pernet V., Gueven N. PLoS One. 2012;7:e45182. doi: 10.1371/journal.pone.0045182. [DOI] [PMC free article] [PubMed] [Google Scholar]
- Liu B., Gu L., Zhang J. Recl. Trav. Chim. Pays-Bas. 1991;110:99–103. [Google Scholar]
- Gueven N., Woolley K., Smith J. Redox Biol. 2015;4:289–295. doi: 10.1016/j.redox.2015.01.009. [DOI] [PMC free article] [PubMed] [Google Scholar]
- Noh Y. H., Kim K.-Y., Shim M. S., Choi S.-H., Choi S., Ellisman M. H., Weinreb R. N., Perkins G. A., Ju W.-K. Cell Death Dis. 2013;4:e820. doi: 10.1038/cddis.2013.341. [DOI] [PMC free article] [PubMed] [Google Scholar]
- Beal M. F., Shults C. W. BioFactors. 2003;18:153–161. doi: 10.1002/biof.5520180218. [DOI] [PubMed] [Google Scholar]
- McCarthy S., Somayajulu M., Sikorska M., Borowy-Borowski H., Pandey S. Toxicol. Appl. Pharmacol. 2004;201:21–31. doi: 10.1016/j.taap.2004.04.019. [DOI] [PubMed] [Google Scholar]
- Gueven N., Nadikudi M., Daniel A., Chhetri J. Mitochondrion. 2016;36:7–14. doi: 10.1016/j.mito.2016.07.013. [DOI] [PubMed] [Google Scholar]
- Fash D. M., Khdour O. M., Sahdeo S. J., Goldschmidt R., Jaruvangsanti J., Dey S., Arce P. M., Collin V. C., Cortopassi G. A., Hecht S. M. Bioorg. Med. Chem. 2013;21:2346–2354. doi: 10.1016/j.bmc.2013.01.075. [DOI] [PubMed] [Google Scholar]
- Palecek T., Fikrle M., Nemecek E., Bauerova L., Kuchynka P., Louch W. E., Spika I., Rysava R. Curr. Pharm. Des. 2015;21:479–483. doi: 10.2174/138161282104141204143657. [DOI] [PubMed] [Google Scholar]
- Strawser C. J., Schadt K. A., Lynch D. R. Expert Rev. Neurother. 2014;14:949–957. doi: 10.1586/14737175.2014.939173. [DOI] [PubMed] [Google Scholar]
- Lynch D. R., Perlman S. L., Meier T. Arch. Neurol. 2010;67:941–947. doi: 10.1001/archneurol.2010.168. [DOI] [PubMed] [Google Scholar]
- Buyse G. M., Goemans N., van den Hauwe M., Thijs D., de Groot I. J. M., Schara U., Ceulemans B., Meier T., Mertens L. Neuromuscular Disord. 2011;21:396–405. doi: 10.1016/j.nmd.2011.02.016. [DOI] [PubMed] [Google Scholar]
- Buyse G. M., Voit T., Schara U., Straathof C. S. M., D'Angelo M. G., Bernert G. N., Cuisset J.-M., Finkel R. S., Goemans N., Rummey C., Leinonen M., Mayer O. H., Spagnolo P., Meier T., McDonald C. M. Pediatr. Pulmonol. 2016;52:508–515. doi: 10.1002/ppul.23547. [DOI] [PMC free article] [PubMed] [Google Scholar]
- McDonald C. M., Meier T., Voit T., Schara U., Straathof C. S. M., D'Angelo M. G., Bernert G., Cuisset J.-M., Finkel R. S., Goemans N., Rummey C., Leinonen M., Spagnolo P., Buyse G. M. Neuromuscular Disord. 2016;26:473–480. doi: 10.1016/j.nmd.2016.05.008. [DOI] [PubMed] [Google Scholar]
- Buyse G. M., Voit T., Schara U., Straathof C. S. M., D'Angelo M. G., Bernert G., Cuisset J.-M., Finkel R. S., Goemans N., McDonald C. M., Rummey C., Meier T. Lancet. 2015;385:1748–1757. doi: 10.1016/S0140-6736(15)60025-3. [DOI] [PubMed] [Google Scholar]
- Fiebiger S. M., Bros H., Grobosch T., Janssen A., Chanvillard C., Paul F., Dörr J., Millward J. M., Infante-Duarte C. J. Neuroimmunol. 2013;262:66–71. doi: 10.1016/j.jneuroim.2013.07.002. [DOI] [PubMed] [Google Scholar]
- Vafai S. B., Mevers E., Higgins K. W., Fomina Y., Zhang J., Mandinova A., Newman D., Shaw S. Y., Clardy J., Mootha V. K. PLoS One. 2016;11:e0162686. doi: 10.1371/journal.pone.0162686. [DOI] [PMC free article] [PubMed] [Google Scholar]
- Becker C., Bray-French K., Drewe J. Expert Opin. Drug Metab. Toxicol. 2010;6:1437–1444. doi: 10.1517/17425255.2010.530656. [DOI] [PubMed] [Google Scholar]
- Chen H., Lum A., Seifreid A., Wilkens L. R., Le Marchand L. Cancer Res. 1999;59:3045–3048. [PubMed] [Google Scholar]
- Gueven N., Faldu D. Expert Opin. Orphan Drugs. 2013;1:331–339. [Google Scholar]
- Sarbia M., Bitzer M., Siegel D., Ross D., Schulz W. A., Zotz R. B., Kiel S., Geddert H., Kandemir Y., Walter A., Willers R., Gabbert H. E. Int. J. Cancer. 2003;107:381–386. doi: 10.1002/ijc.11430. [DOI] [PubMed] [Google Scholar]
- Rahn J. J., Bestman J. E., Josey B. J., Inks E. S., Stackley K. D., Rogers C. E., Chou C. J., Chan S. S. L. Neuroscience. 2014;259:142–154. doi: 10.1016/j.neuroscience.2013.11.040. [DOI] [PMC free article] [PubMed] [Google Scholar]
- Josey B. J., Inks E. S., Wen X., Chou C. J. J. Med. Chem. 2013;56:1007–1022. doi: 10.1021/jm301485d. [DOI] [PMC free article] [PubMed] [Google Scholar]
- Vos M., Esposito G., Edirisinghe J. N., Vilain S., Haddad D. M., Slabbaert J. R., Van Meensel S., Schaap O., De Strooper B., Meganathan R., Morais V. A., Verstreken P. Science. 2012;336:1306–1310. doi: 10.1126/science.1218632. [DOI] [PubMed] [Google Scholar]
- Oldenburg J., Marinova M., Müller Reible C. and Watzka M., Vitamins and Hormones, ed. G. Litwack, Elsevier, 2008, ch. 3, vol. 78, pp. 35–62. [DOI] [PubMed] [Google Scholar]
- Garcia A. A. and Reitsma P. H., Vitamins and Hormones, ed. G. Litwack, Elsevier, 2008, ch. 2, vol. 78, pp. 23–33. [DOI] [PubMed] [Google Scholar]
- Caspers M., Czagalla K. J., Liphartd K., Müller J., Westhofen M. W., Oldenburg J. Thromb. Res. 2015;135:977–983. doi: 10.1016/j.thromres.2015.01.025. [DOI] [PubMed] [Google Scholar]
- Commandeur C., Chalumeau C. L., Dessolin J., Laguerre M. Eur. J. Org. Chem. 2007:3045–3052. [Google Scholar]
- Galicia M., González F. J. J. Electrochem. Soc. 2002;149:D46–D50. [Google Scholar]
- Boudalis A. K., Policand X., Sournia-Saquet A., Donnadieu B., Tuchagues J.-P. Inorg. Chim. Acta. 2008;361:1681–1688. [Google Scholar]
Associated Data
This section collects any data citations, data availability statements, or supplementary materials included in this article.


