

Abstract
Resonance Raman studies show that the heme-bound CO in trHbO, a truncated-II hemoglobin from Mycobacterium tuberculosis, is exposed to an environment with a positive electrostatic potential. The mutation of Trp(G8), an absolutely conserved residue in group II and III truncated hemoglobins, to Phe introduces two new Fe–CO conformers, both of which exhibit reduced electrostatic potentials. Computer simulations reveal that the structural perturbation is a result of the increased flexibility of the Tyr(CD1) and Leu(E11) side chains due to the reduction of the size of the G8 residue. Laser flash photolysis studies show that the G8 mutation induces 1) the presence of two new geminate recombination phases, one with a rate faster than the time resolution of our instrument and the other with a rate 13-fold slower than that of the wild type protein, and 2) the reduction of the total geminate recombination yield from 86 to 62% and the increase in the bimolecular recombination rate by a factor of 530. Computer simulations uncover that the photodissociated ligand migrates between three distal temporary docking sites before it subsequently rebinds to the heme iron or ultimately escapes into the solvent via a hydrophobic tunnel. The calculated energy profiles associated with the ligand migration processes are in good agreement with the experimental observations. The results highlight the importance of the Trp(G8) in regulating ligand migration in trHbO, underscoring its pivotal role in the structural and functional properties of the group II and III truncated hemoglobins.
Hemoglobins (Hbs)3 have been discovered in organisms from virtually all kingdoms (1, 2). The individual subunit of all Hbs consists of a polypeptide chain with 6 – 8 α-helical segments that fold around a heme group, which are conventionally labeled from A to H according to the linear sequence order. The proximal heme ligand is always a histidine residue at the F8 position. The distal ligand binding pocket is typically constructed from the B and E helices, the CD loop connecting them, as well as part of the G helix. The identities of several residues in the ligand binding pocket, especially the B10, E7, E11, CD1, and G8 residues, are important for the regulation of ligand binding and discrimination. As compared with mammalian globins, the distal residues of microbial Hbs are typically more polar, suggesting that the structures of these Hbs are tailored to perform functions other than dioxygen transport, as reviewed in the literature (1–3).
Truncated Hbs (trHbs) are small globins, consisting of ~110 –140 amino acid residues, which are widely distributed in bacteria, eukaryotes, and higher plants. They form a unique cluster within the Hb superfamily (2, 4). The major structural features of trHbs that distinguish them from the classical vertebrate globins are the unprecedented 2-over-2 α-helical sandwich fold (replacing the commonly seen 3-over-3 α-helical sandwich motif), the absence of the A-helix, and the presence of an extended loop substituting for most of the F-helix (2). On the basis of amino acid sequence analysis, three phylogenetic groups (trHb-I, trHb-II, and trHb-III) have been identified within the trHb family.
trHbO is a trHb-II globin from Mycobacterium tuberculosis. trHbO is expressed throughout the bacterial growth phase (5). The physiological function of trHbO remains unclear. trHbO contains 128 amino acid residues, with a molecular mass of 14.9 kDa (5). Under solution conditions, trHbO exists as an equilibrium mixture of monomer and dimer (6), which is sensitive to the ionic strength of the solvent. The B10, E7, E11, CD1, and G8 positions in trHbO are occupied by Tyr23, Ala44, Leu48, Tyr36 and Trp88 respectively, as shown in Fig. 1 (the Ala(E7) is not shown for clarity). One intriguing feature of trHbO is that a covalent bond between the phenyl oxygen of the Tyr(B10) and the C€2 of the Tyr(CD1) was observed in six subunits of the dodecamer but not in the other six subunits, although in the latter, the aromatic side chain groups of the Tyr(B10) and the Tyr(CD1) are in close contact and in a similar orthogonal orientation (7). The importance of this covalent bond remains unknown.
FIGURE 1. The active site structure of the cyanide-bound ferric trHbO.

The critical residues in distal heme ligand binding site of trHbO as well as its proximal heme ligand are labeled as indicated. The Protein Data Bank code is 1NGK.
Resonance Raman spectroscopy combined with mutagenesis studies show that the Tyr(CD1), but not the Tyr(B10), is important in stabilizing the heme-bound CO in the CO complex of trHbO (5). Additional findings demonstrate that, in addition to the Tyr(CD1), the Trp(G8) residue, which is highly conserved in the trHb-II and trHb-III family of proteins, also plays a critical role in ligand binding and stabilization (8–10). In this work, we aimed to investigate the role of the Trp(G8) residue in regulating ligand migration in trHbO, by using resonance Raman spectroscopy, nanosecond laser flash photolysis, and novel computer simulation methodologies.
Computer simulations have been widely used to investigate ligand migration in proteins since late 1970s (11–13). Most of these studies involve molecular dynamics techniques based on simultaneous integration of Newton’s equations of motion. Due to computer limitations, these simulations often require a certain degree of steering via a random (14) or a directed bias force (15, 16) in order to reach a microsecond time scale. In the current study, we employed a recently developed methodology, involving a stochastic ligand and protein perturbation algorithm coupled to protein structure prediction techniques, to model ligand migration in trHbO (17). Although this method cannot capture all of the atomic details that are accessible with conventional molecular dynamic methods, it provides an efficient alternative for the studies of ligand migration in proteins without adding any bias force. In addition, a mixed quantum mechanics and molecular mechanics (QM/MM) method was used to model the ligand dissociation. In that case, the Schrödinger equation is solved for the QM region, covering the atoms involved in the process of interest, whereas the MM region is described by a set of “solid” spheres, with point charges and classical force fields. The combined experimental and theoretical approaches allow the rationalization of the role of the Trp(G8) in regulating ligand migration in trHbO.
EXPERIMENTAL PROCEDURES
Materials
The natural abundant gases, argon and CO were obtained from Tech Air (White Plains, NY). The isotopically labeled gas 13C16O was supplied by Icon (Mount Marion, NY). All other chemicals were purchased from Sigma.
The wild type and G8WF mutant of the recombinant trHbO were cloned, expressed, and purified to near homogeneity, as described elsewhere (5, 18). The protein was buffered with 50 mM Tris-HCl at pH 7.4 in the presence of 50 µM EDTA. The deoxy derivative was prepared by first flushing the protein solution with argon gas for 1 h in a gas-tight cuvette, sealed with a rubber septum, followed by reduction with a 5-fold molar excess of sodium dithionite. The CO-bound derivative was prepared by either injecting CO-saturated solution with a gas-tight syringe into the deoxy protein solution or flushing the deoxy protein sample with CO gas for 1 h. The corresponding 13C18O- substituted samples were prepared by injecting the 13C18O-saturated solution with a gas-tight syringe into the dithionite-reduced protein.
Optical Absorption Spectroscopy
Optical absorption spectra were recorded by using a Shimadzu UV2100U spectrophotometer. Protein concentrations of 1–15 µM were used. All spectra were recorded at room temperature (~25 °C).
Resonance Raman Spectroscopy
The resonance Raman measurements were carried out with previously described instrumentation (9). Briefly, the laser line was focused on a quartz cuvette, constantly rotating at ~6000 rpm to avoid photodamage of the sample. The scattered light was collected at right angles to the incident beam and focused on the entrance slit (100 µm) of a polychromator (Spex, Metuchen, NJ), where it was dispersed by a 1200-groove/mm grating and subsequently detected by a liquid nitrogen-cooled charge-coupled device (Princeton Instruments, Trenton, NJ). The 413.1 nm output from a krypton ion laser (Spectra Physics, Mountain View, CA) was used as the excitation source unless otherwise indicated. A halographic notch filter (Kaiser Optical Systems Inc., Ann Arbor, MI) was used to eliminate the Rayleigh scattering. The Raman spectra were calibrated with indene for the 200–1700 cm−1 spectral region or acetone/potassium ferrocyanide for the 1700–2300 cm−1 spectral region. Optical absorption spectra were acquired before and after the Raman measurements to ensure the integrity of the samples. The Raman data were processed by GRAMS software (Galactic Industries Corp.).
For the low temperature Raman measurement, the spectrum of the frozen sample kept in a Linkam THMS 600 temperature control stage was obtained with a Raman microscope system (LabRam from JY Horiba, Edison, NJ).
Nanosecond Laser Flash Photolysis
Laser flash photolysis studies were carried out with the LKS.60 spectrometer system from Applied Photophysics Ltd. (Leatherhead, UK), as described elsewhere (19). In that system, the second harmonic line at 532 nm from an Nd:YAG laser (Brillian B from Big Sky Laser, Bozeman, Montana), with a pulse duration of 5 ns and a maximum energy of 110 mJ/pulse, was used as the pump beam. The absorbance of the CO complexes at 532 nm was kept at ~0.05– 0.1. The output from a 150-watt xenon arc lamp, right angle to the photolysis beam, was used as the probe beam. The probe beam passed through a monochromator prior to reaching the quartz cuvette (4 × 10 mm with a 10-mm optical path) containing the sample; the light transmitted through the sample entered a second monochromator, which was synchronized with the first monochromator and was detected by a photomultiplier tube (IP28 from Hamamatsu Corp.). The signal from the photomultiplier tube was transferred to a digital oscilloscope (Infinium from Agilent Technologies) and then to a personal computer for subsequent analysis. Typically, six or seven kinetic traces were averaged to improve the signal/noise ratio.
To measure the bimolecular rebinding kinetics of CO following photodissociation, the kinetics were measured as a function of CO concentration, which is kept significantly higher than the concentration of the protein (4.0 –10.0 µM) to ensure pseudo-first order conditions.
CO Dissociation Kinetic Measurements
For the CO dissociation kinetic measurements, the reaction was initiated by injecting a small volume (50 – 60 µl) of concentrated dithionate-free CO-bound protein into a sealed quartz cuvette containing 900 µl of NO-saturated buffer at pH 7.4 (50 mM Tris with 50 µM EDTA). The CO dissociation kinetics were monitored as a function of time at 405 nm, since the spontaneous replacement of the heme-bound CO with NO is rate-limited by the dissociation of the CO.
Ligand and Protein Dynamic Exploration; Protein Energy Landscape Exploration (PELE)
The PELE algorithm combines a steered stochastic approach with protein structure prediction methods, capable of projecting the migration dynamics of ligands in proteins. The PELE heuristic algorithm is based on consecutive iterations of three main steps.
Ligand and/or Protein Perturbation—
The procedure begins with the generation of a local perturbation in the ligand and/or in the protein. Ligand perturbation involves a translation and rotation of the center of mass of the ligand. Protein perturbation involves α-carbon displacement following an anisotropic network model approach (see below).
Side Chain Sampling—
The algorithm proceeds by placing all side chains local to the ligand using the algorithms designed by Prof. Jacobson (University of California, San Francisco).
Energy Minimization—
The last step in every move involves the minimization of a region including, at least, all residues local to the atoms involved in steps 1 and 2.
These three steps compose a move that is accepted (defining a new minima) or rejected based on a Metropolis criterion for a given temperature. By increasing or decreasing the temperature, the energy gaps can be tuned in each stochastic transition. The collection of accepted steps forms a stochastic trajectory. Typically, a simulation involves several processors running multiple steps and sharing information toward addressing a common task, such as minimizing global energy or driving ligand far from a fixed point.
The method and its initial tests have been published elsewhere (17). The data confirm the capability of this method for millisecond landscape exploration. In this study, we have introduced a novelty in the algorithm. We have included the option of an additional perturbation on the backbone, in order to produce a larger protein conformational sampling. The α-carbons are displaced based on one of the lowest eigenvectors obtained in an anisotropic network model approach, a simple model for normal mode analysis (20). The system is then minimized with a harmonic constraint on each displaced α-carbon. The magnitude of the displacement, the nature of the eigenvector, and the strength of the constraint are user-adjustable variables. The algorithm also computes each side chain energy before and after the anisotropic network model perturbation; it includes the more excited side chains, the ones experiencing a larger increase in energies as a consequence of the anisotropic network model move, in the side chain prediction step. The combination of ligand and backbone perturbations, coupled to a side chain prediction and unconstrained minimization, results in a more effective exploration of the protein energy landscape, capable of reproducing large conformational changes associated with ligand migration.
Ligand Dissociation; QM/MM
The mixed QM/MM method joins together a quantum and a classical representation of different sectors of a complex condensed phase system (21). The reactive region of the active site is treated with a robust ab initio QM methodology, and the remainder of the protein is modeled at the MM level, providing the appropriate structural constraints and electrostatic and van der Waals interactions within the core reactive region. The QM/MM method contains all of the elements necessary to properly describe the potential energy surfaces relevant to a biochemical process of interest. All of the QM/MM calculations were performed with the QSite program, using the DFT B3LYP level of theory and 6–311G* basis set (and a lacv3p pseudopotential for the iron center). The quantum region included the heme group, the axial histidine, and the CO ligand.
Model Setup
Starting with the crystal structure, Protein Data Bank Code 1NGK (chain L), protons were added, and all Asp, Glu, Lys, and Arg residues were modeled in their ionic state. Based on local pKa, His-108 was doubly protonated; all other His residues were singly protonated at the δ-position. The system was solvated and equilibrated with a 14-Å layer of water molecules, on the basis of the procedure described elsewhere (22). After equilibration, the system was ready for the QM/MM study. Along the QM/MM reaction coordinate, the oxygen atoms corresponding to the last layer of salvation water molecules were kept fixed. The ligand dynamics exploration was performed with the GBSA implicit solvation model (explicitly keeping all water molecules with two or more hydrogen bonds with protein atoms). The G8WF mutant was obtained by performing the Trp to Phe side chain replacement followed by four iterations of side chain prediction and minimization for all residues within 10 Å of the mutated residue. The side chain prediction, the minimization, and the protein setup were performed with the PLOP program (23).
RESULTS AND DISCUSSION
The Resonance Raman Spectra of the CO Complex—
Previous resonance Raman studies of trHbO show that the deoxy form of trHbO has a typical five-coordinate high spin configuration (5). In addition, the νFe-His mode was identified at 226 cm−1, indicating a staggered geometry of the proximal histidine with respect to the pyrrole nitrogen atoms of the porphyrin ring (24). Binding of CO to the deoxy derivative generates a stable six-coordinate low spin heme, with CO bound to the distal heme ligand binding site. To understand the role of Trp(G8) in ligand stabilization in trHbO, we have obtained the resonance Raman spectra of the CO-bound G8WF mutant with respect to the wild type protein. As shown in Fig. 2A, in the wild type protein, the bands at 526 and 1918 cm−1 are assigned to the νFe–CO and νC–O modes, respectively, as reported previously (5). The mutation of the Trp(G8) to Phe causes the νFe–CO mode to split into two bands at 496 and 514 cm−1 (8), which are associated with two νC–O modes at 1965 and 1938 cm−1 respectively. All of the CO-related modes shift to lower frequencies with the substitution of 12C16O with 13C18O (data not shown), confirming the assignments of these modes.
FIGURE 2. Resonance Raman spectra of the CO derivatives of the wild type (wt) and G8WF mutant of trHbO and the associated νC–O-ν Fe–CO inverse correlation plot.

The resonance Raman spectra in the νFe–CO spectral region is shown in A. The associated spectra in the νC–O spectral region is shown in the inset in A. The spectra in B show the temperature dependence of the two νFe–CO modes of the G8WF mutant. The data shown in C are taken from A, in comparison with those from literature associated with heme proteins and model complexes with histidine as the proximal heme ligand (1, 9, 25–28, 38).
In general, the structure of the Fe–C–O moiety in CO-bound heme proteins can be described as equilibrium between two extreme resonance structures.
| REACTION 1 |
When the distal environment is positively charged, structure I is disfavored over structure II. Consequently, the νFe–CO frequency increases, and the νC–O frequency decreases (9, 25–28). On this basis, the νFe–CO and νC–O frequencies are typically inversely correlated, as illustrated in Fig. 2C.
In the inverse correlation plot, the data point associated with the wild type protein with νFe–CO/νC–O at 526 and 1918 cm−1 lies in the upper left corner, reflecting a positive electrostatic potential of the CO binding site. The mutation of the Trp(G8) to Phe causes the data point to shift along the correlation line to the lower right corner. One of the conformers of the G8WF mutant (denoted as the closed conformer, G8C), with νFe–CO/νC–O at 514 at 1938 cm−1 falls in the middle of the correlation line, whereas the other conformer (denoted as the open conformer, G8O), with νFe–CO/νC–O at 496 at 1965 cm−1, shifts to the lower right corner. The fact that these data points stay on the same inverse correlation line indicates that the structural changes in the distal pocket do not affect the electronic properties of the proximal heme ligand.
The data shown in Fig. 2C highlight the important role of the Trp(G8) in ligand stabilization in trHbO. Like the Trp(G8), the Tyr(CD1), but not Tyr(B10), has been demonstrated to play a critical role in stabilizing the heme-bound CO (5). The mutation of the Tyr(CD1) to Phe causes the νFe–CO/νC–O to shift to 515/1934 cm−1 (5), similar to those of the closed conformation of the G8WF mutant. Taken together, the data suggest that the heme-bound CO in the wild type trHbO is stabilized by the Tyr(CD1) and Trp(G8) in a synergetic fashion via hydrogen-bonding interactions. It is conceivable that the CO ligand in the CD1YF mutant is stabilized by a hydrogen bond from the Trp(G8); conversely, that in the closed conformation of the G8WF mutant is stabilized by the Tyr(CD1). The presence of the additional open conformer in the G8WF mutant, in which the hydrogen bond from Tyr(CD1) is presumably missing, suggests that the replacement of the Trp(G8) with Phe increases the flexibility of the protein matrix, thereby allowing the Tyr(CD1) to change its conformation.
The coexistence of more than one conformer in the CO complexes of other hemoglobins has been reported in the past (10, 19, 29–33), but their molecular origin remains unclear. To further investigate the two conformers of the G8WF mutant of trHbO, we sought to examine their temperature dependence. As shown in Fig. 2B, the intensity of the 514 cm−1 mode significantly diminishes at low temperature (83 K), as compared with that obtained at room temperature (298 K), indicating that the open conformer is lower energy than the closed conformer. It is important to note that the intensity change is not a result of preferential photodissociation of the 514 cm−1 mode at low temperature, since the ν4 mode, which is sensitive to the coordination state of the heme, remains the same during the spectral acquisition (data not shown). On the other hand, the slight shift in the frequency of the remaining closed conformer from 514 to 519 cm−1 is plausibly a result of minor structural change in the Fe–C–O moiety.
Association Kinetics of CO—
Fig. 3A shows the kinetic trace obtained at 440 nm following the photodissociation of CO-bound wild type trHbO in 50 mM Tris buffer at pH 7.4. The transient spectrum obtained at 20 ns coincides with the difference spectrum between the deoxy and CO complex of trHbO obtained under equilibrium conditions (Fig. 4A), indicating that the spectral change is a result of CO-rebinding, and no other intermediate is involved in the kinetic process.
FIGURE 3. The CO recombination kinetic traces of the wild type (wt) (A) and G8WF mutant (B) of trHbO.

The reactions were monitored at 440 nm following the photodissociation of CO from the CO-bound derivatives with 532 nm output from an Nd:YAG laser. The quantum yields for each kinetic phase are as indicated. The solid gray lines are the exponential curves best fitted with the kinetic traces.
FIGURE 4. The CO association kinetics of the wild type (wt) and G8WF mutant of trHbO.

A, shows the 20-ns transient absorption spectrum (circles) and the calculated difference spectrum between those of the deoxy and COderivative of trHbO. In B, the observed association rate constant is plotted as a function of CO concentration, and the indicated bimolecular association rate constants are determined from the slopes of the linear fits of the data. The inset is an enlarged view of the data of the wild type protein.
In general, when CO is photolyzed from the heme iron in a hemeprotein, the ligand can either rapidly rebind to the heme (i.e. the so-called “geminate recombination”) or migrate away from the distal pocket into the protein matrix, which subsequently returns to the distal pocket or escapes into the bulk solution. The CO escapes into the free solution and can ultimately rebind to the heme iron in a CO concentration-dependent manner (i.e. the so-called “bimolecular recombination”) (34). The quantum yield for each recombination process depends on the dynamic properties of the protein matrix.
The CO-rebinding kinetic trace of trHbO shown in Fig. 3A can be fitted with two sequential single exponential functions, with rates of 2.5 × 10⁸ and 10 s−1. Since the fast rebinding kinetics is CO concentration-independent, it is assigned to the geminate recombination phase. The slow kinetics, on the other hand, is sensitive to the concentration of CO applied, as shown in Fig. 4B; it is attributed to the bimolecular rebinding phase. The bimolecular rebinding rate constant is determined to be 1.0 × 10⁴ M−1 s−1, based on the slope of the linear fit of the data, which is consistent with the published value (6).
The extrapolated OD at time 0 derived from the single exponential curve fit of the geminate recombination data matches the expected OD of the deoxy protein, indicating the absence of any missing kinetic phase. The quantum yields for the geminate recombination and bimolecular rebinding phases are determined to be 86 and 14%, respectively, on the basis of the amplitude ratio of the two phases (Fig. 3A). The extremely high geminate rebinding yield of trHbO represents the highest value among those of the natural Hbs studied to date. It indicates that most of the photodissociated CO molecules are trapped in the heme pocket or the protein matrix following the photodissociation, presumably due to a relatively high energy barrier for the ligand to escape into the solvent. On the other hand, the relatively slow CO bimolecular recombination rate indicates a high energy barrier for the CO to enter into the protein matrix from the solvent.
Fig. 3B shows the CO recombination kinetics of the G8WF mutant following photodissociation. Like the wild type protein, the two sequential kinetic phases are assigned to the geminate and bimolecular CO recombination processes, which can be fitted with single exponential functions with rate constants of 1.9 × 10⁷ s−1 (25%) and 5.3 × 10³ s−1 (38%), respectively. The bimolecular recombination rate constant is determined to be 5.3 × 10⁶ M−1 s−1 on the basis of CO concentration-dependent studies shown in Fig. 4B, similar to the published data (8). Intriguingly, the sum of the amplitudes of the two kinetic phases accounts for only 63% of the OD expected for the deoxy derivative, indicating the presence of a ~37% missing geminate recombination phase that is too fast to be resolved with our instrument.
As summarized in Table 1, the data show that the mutation of the Trp(G8) to Phe causes a 13-fold decrease in the geminate recombination rate and at the same time introduces a new faster geminate recombination phase, suggesting perturbation in the distal ligand docking site(s) in close proximity to the heme iron. The mutation also causes the CO bimolecular rebinding quantum yield to increase from 14 to 38% and the bimolecular rebinding rate to increase by a factor of ~530-fold, indicating the lower energy barrier for the ligand to enter from or exit into the solvent.
TABLE 1.
The νFe–CO stretching frequencies and the CO ligand binding kinetic constants of the wild type and G8WF mutant of trHbO with respect to sperm whale myoglobin (swMb)
Dissociation Kinetics of CO—
To further understand how the mutation in the Trp(G8) affects the ligand migration in trHbO, we examined the CO dissociation kinetics of the wild type and the G8WF mutant. As shown in Fig. 5A, the CO dissociation reaction of the wild type protein follows a single exponential kinetics with an extremely slow rate constant (koff) of 4.7 10−5 s−1. The astonishingly low koff value of the wild type manifests the unique structural properties of the distal heme pocket of trHbO. The mutation of the Trp(G8) to Phe causes a ~12-fold increase in the koff value (Table 1), underscoring the critical role of the Trp(G8) in regulating ligand migration in trHbO.
FIGURE 5. The CO dissociation kinetics of the wild type and G8WF mutant of trHbO.

The reaction was monitored by following the spontaneous dissociation of CO and its replacement with NO, as described under “Experimental Procedures.” In A, the normalized absorbance at 405 nm was plotted as a function of time following the initiation of the reaction. The kinetic traces were fitted with single exponential functions with rate constants as indicated. In B, the initial absorption spectrum of the CO derivative of the wild type protein (gray) is compared with the final spectra of the wild type and G8WF mutant (black) obtained at the last time points shown in A. For clarity, the spectra are offset from each other; the visible regions of the spectra are expanded by a factor of 4. The spectrum of the CO derivative of the G8 mutant is similar to that of the wild type protein; it is hence not shown. It is important to note that, in the G8 mutant, the final spectrum is identical to that of the equilibrium NO-bound ferrous derivative, whereas in the wild type protein, the final spectrum is a mixture of the NO-bound and CO-bound spectra, since the reaction reached only ~77% completion at the last time point monitored (32,000 s).
It is noteworthy that much faster koff values for the wild type and G8WF mutant of trHbO have been reported by Ouellet et al. (6, 8). In that work, the deoxy species generated from the CO dissociation reaction was trapped by O2, instead of NO as we reported here. To understand the origin of the discrepancy, we repeated the measurements with O2 as the trapping molecule. It was found that at the end of the replacement reactions, the proteins were mostly oxidized to the ferric state. In contrast, when NO was used as the trapping agent, all of the protein molecules remain in the ferrous state as shown in Fig. 5B, indicating that no side reaction took place during the kinetic measurements. The reliability of our data has been further confirmed by several repeats of the measurements.
Conformational Sampling of the Equilibrium Structure of the CO Complex—
To investigate the structural origin of the two conformers of the G8WF mutant of trHbO, we used PELE to map the stochastic conformational changes in the G8WF mutant as compared with the wild type protein. For this particular application, the perturbation step involved only the peptide backbone, with random displacements of up to 1 Å, and the CO ligand was kept in its bound Fe–CO conformation. The conformational sampling, where 10 processors were independently searching for local minima, was assisted by side chain prediction within 6 Å from the heme group, followed by a full energy minimization of the protein structure.
Fig. 6, A and B, shows the distances between the oxygen atom of the heme-bound CO and the side chains of Tyr(CD1) and Leu(E11), respectively, in the G8WF mutant as a function of the 850 iterations of the conformational sampling (for clarity, only the data from a single processor are shown). The data demonstrate that the Tyr(CD1) and Leu(E11) residues fluctuate between two states in a synchronized fashion. In contrast, in the wild type protein, the two distances remain almost constant during the conformational sampling (data not shown). The presence of the two states in the mutant is consistent with the two conformers (G8O and G8C) uncovered by the resonance Raman studies as shown in Fig. 2.
FIGURE 6. The distances between the heme-bound CO and the Tyr(CD1) (A) and the Leu(E11) (B) as a function of the iterations of the conformational sampling, the two snapshots highlighting the fluctuation of the Leu(E11) side chain during the simulation (C) and the energy of each snapshot as a function of the Tyr(CD1)–CO distance (D), in the G8WF mutant.

The CO–Leu(E11) distance is defined by the distance between a side chain terminal hydrogen of the Leu(E11) and the oxygen atom of the CO ligand. The CO–Tyr(CD1) distance is defined by the distance between the hydroxyl hydrogen of the Tyr(CD1) and the oxygen atom of the CO ligand.
The conformers with averaged Tyr(CD1)-CO distances of ~2.34 and 2.40 Å are assigned to the closed conformer (G8C) and open conformer (G8O), respectively, since the resonance Raman data indicate that the heme-bound CO in the former is exposed to an environment with a higher electrostatic potential as compared with the latter. Fig. 6D shows the energy of each snapshot as a function of the Tyr(CD1)-CO distance obtained from all 10 processors (each color represents the data from a single processor). The two energy minima in the plot correlate well with the two conformers found in Fig. 6, A and B, as indicated. The data show that G8O is lower energy than G8C, which is in good agreement with the conclusion drawn from the temperature-dependent data shown in Fig. 2B.
Fig. 6C shows the two snapshots of the G8WF mutant run, highlighting the fluctuation of the Leu(E11) side chain during the simulation, in contrast to the wild type protein, in which all residues experience only minute fluctuations around their original positions (data not shown). The data clearly demonstrate that the active site of the G8WF mutant exhibits a higher degree of dynamic flexibility as compared with the wild type protein. Conceivably, it is a result of the reduced size of the G8 side chain, considering the fact that the side chain group of the Leu(E11) residue is in close contact with that of the Trp(G8) in the wild type protein, as may be seen in Fig. 1 (the shortest distance between these two residues is ~3.1 Å).
Energy Profile for the CO Deligation Process—
As a first step to examine how the Trp(G8) affects CO migration in trHbO, a QM/MM method was employed to examine the energy profile associated with the CO deligation process of the G8WF mutant with respect to the wild type protein. The deligation process was induced by enlarging the Fe–CO bond distance along the Fe–CO axis without other constraints. The ground state of the CO complex of trHbO is six-coordinate low spin with an Fe–CO distance of ~1.8 Å. Since the CO deligation process induces low to high spin transition, the energy profile of the high spin state was calculated as a function of the Fe–CO distance, from 1.8 to 3.2 Å, for both the mutant and the wild type (for more details on the methodology, see Refs. 35 and 36).
As shown in Fig. 7, the potential energy surface of the high spin state at short Fe–CO distances is purely repulsive for both species, which effectively drives the CO deligation reaction. The energy profile of the G8 WF mutant exhibits a smooth dissociation as a function of the Fe–CO distance, allowing the CO to effectively explore the active site without the need of larger protein reorganization. In contrast, that of the wild type protein gradually rises at long Fe–CO distance. The data suggest that, in the wild type protein, the Trp(G8) side chain group obstructs the motion of the CO in the active site following its deligation from the heme iron. It is important to note that the energy profiles can only be viewed as a qualitative, not quantitative, description of the obstruction in CO migration by the Trp(G8) side chain.
FIGURE 7. The QM/MM energy surface of the deoxy high spin derivatives of trHbO following CO dissociation from the heme iron.
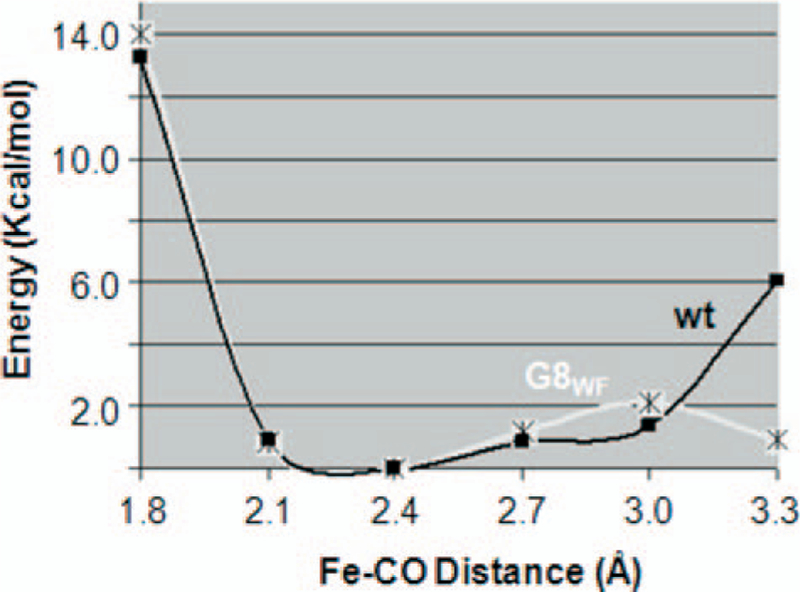
The data associated with the wild type (wt) and G8WF mutant are indicated as black spheres and asterisks, respectively.
In QM/MM methods, the electrons in the quantum region are very sensitive to large amplitude motions in the classical region. In order to obtain a smooth energy profile, the classical region is only allowed to minimize adiabatically along with the quantum reaction coordinate, the enlargement of the Fe–CO distance. As a result, the protein conformation is mostly trapped in the vicinity of the initial energy well, although a larger protein reorganization might be necessary to accommodate the ligand deligation process. Nonetheless, the impediment in ligand deligation due to the presence of the Trp(G8) side chain in the wild type protein is corroborated, when more robust classical sampling techniques are used (see below). Overall, the data are in good agreement with the ~12-fold increase in the CO dissociation rate for the G8WF mutant with respect to the wild type protein (Table 1).
Temporary Ligand Docking Sites—
To investigate the migration of the CO ligand following its dissociation from the heme iron in trHbO, we used the PELE algorithm to map the ligand dynamics. For this simulation, again 10 processors were used for several runs at different temperatures. After each iteration, all processors share information about the ligand position, defined by the distance between the center of mass of the ligand and the average center of mass for all processors; when one processor finds the escape of the ligand from a cavity, the other processors follow the trend and start another random search for a new cavity. As illustrated in Fig. 8, A and B, in the wild type protein, the dissociated ligand immediately migrates to an active site cavity above the heme iron center, denoted as docking site B1, following protein relaxation. Subsequently, the CO finds a quick transition to an additional active site cavity, denoted as docking site B2, which is located at ~5.2 Å away from the heme iron center ( ~3.5 Å away from the 6-propionate CGA atom, as seen in Fig. 8C), parallel to the porphyrin plane and slightly displaced toward the heme propionates.
FIGURE 8. The side view (A) and top view (B) of the representative snapshots of the active site of the wild type (wt) trHbO following CO dissociation and the energy landscape associated with CO migration in the wild type (C) and G8WF mutant (D) of trHbO.

In A and B, the three CO docking sites, B1, B2, and B3, are indicated as gray, yellow, and orange spheres, respectively. The Trp(G8) and Leu-48, presented in stick representation, are color-coded accordingly, based on the location of the dissociated CO. In C and D, the x axis represents the distance of center of mass of the CO ligand to the CGA carbon atom of the heme 6-propionate group.
At low metropolis temperatures, ~200–300 K, the CO ligand stays mainly in the B2 cavity with short transient transitions to the B1 cavity. It is only when the temperature is increased to 400–500 K that the CO ligand can access higher energy configurations and finds its escape from the docking sites B1/B2, to a protein interior cavity remote from the heme iron, labeled as the B3 docking site. As will be discussed bellow, once the ligand reaches the B3 docking site, it can easily escape into free solution. It is important to note that there is no direct escape pathway from the B2 docking site to free solution, even when the metropolis temperature is increased to 1000 K. Instead, the ligand trapped in the B2 site has to return to the B1 site and subsequently to the B3 site before it can bypass the Trp(G8) side chain and escape into free solution. It is also noteworthy that the heating procedure employed here is similar to the commonly used molecular dynamics annealing method, but the temperatures used for these two approaches are not directly comparable (37). The temperature defined in molecular dynamics has a direct effect on velocities and total energy, whereas the temperature parameter used in this work only controls the “allowed” energy gap between two consecutive Metropolis Monte Carlo points (i.e. the probability of transition between two consecutive minima). In other words, the PELE algorithm drives the system to explore local minima, and the temperature helps to overcome higher energy barriers. Due to the bias Monte Carlo procedure applied, the Metropolis temperature is qualitatively, not quantitatively, related to the experimental temperature.
The simulation results show that, in addition to the Trp(G8), several other distal amino acids, including Leu(E11), Tyr(CD1), and Ala(E7), exhibit a high degree of conformational flexibility in responding to ligand migration between the B1, B2, and B3 docking sites. The side chain conformational changes associated with Leu(E11) and Trp(G8), the two major players, are highlighted in the color-coded stick representations in Fig. 8, A and B. As may be seen, the B1 → B2 transition (from the gray to the yellow site) is associated with the displacement of the Trp(G8) side chain and the concurrent movement of the Leu(E11) side chain, in agreement with the QM/MM deligation data. Likewise, the B1 → B3 transition (from the gray to the orange site) is associated with simultaneous movement of the Trp(G8) and Leu(E11) side chain groups, with the latter occupying the now vacant B1 docking site. The synchronized motion of the Trp(G8) and Leu(E11) side chains observed here is in good agreement with the observation that the mutation in the Trp(G8) to Phe drastically increases the conformational flexibility of the Leu(E11) side chain (Fig. 6).
Fig. 8C shows the energy landscape of the wild type protein associated with the stochastic migration of the CO ligand. Here the energy value represents internal energy instead of free energy. The different colors and symbols represent the various data sets obtained from different processors, with each data point constituting an accepted minimum in the metropolis algorithm. The data show that the B2 docking site is ~5 kcal/ mol more stable than the B1 docking site, whereas the B1 and B3 docking sites are nearly isoenergetic. The energy barrier associated with the B1 → B3 transition, as well as the B3 → B1 transition, is ~13 kcal/mol, which is significantly higher than those associated with the B1 → B2 and B2 → B1 transitions ( ~1.5 and 6 kcal/mol, respectively). On the basis of the structure shown in Fig. 8, A and B, the high energy barrier separating the B1 docking site from the B3 docking site is plausibly a result of the steric hindrance imposed by the Trp(G8) and Leu(E11) side chains.
In the G8WF mutant (Fig. 8D), similar docking sites are observed as compared with the wild type protein. However, the relative energies of the docking sites, as well as the barriers separating them, are significantly affected by the point mutation, consistent with the experimental data listed in Table 1. As shown in Fig. 8D, the B1, B2, and B3 docking sites are nearly isoenergetic. As compared with the wild type protein, the energy barrier for the B1 → B3 transition is reduced from 13 to 6 kcal/mol, whereas that associated with the B1 → B2 transition is increased to ~12 kcal/mol, twice the energy associated with the B1 → B3 transition. Consequently, at low temperatures, the ligand in the B1 docking site does not proceed to the B2 docking site; instead, it migrates to the interior B3 docking site. It is notable that the lowest escape barrier for the B1 docking is significantly higher in the mutant as compared with that in the wild type protein; as such, the CO residence time in the B1 docking site is considerably longer in the mutant.
Taken together, the data suggest that, in the wild type protein, the photodissociated CO is initially trapped in the B1 docking site. The trapped CO can either directly rebind to the heme iron or quickly migrate to the B2 docking site (since the energy barrier associated with the B1 → B2 transition is low), from which it may subsequently return to the B1 docking site and rebind to the heme iron, accounting for the geminate recombination phase. It is difficult to quantify the amount of ligand escaping into the B2 site without knowing the barrier associated with CO rebinding in the B1 site, which is not easy to compute due to the complication associated with the forbidden spin transition from a quintet to singlet state. Nonetheless, the barrier for the B1 → B2 transition is presumably much lower than that for the B1 → bound state transition, since only a single geminate recombination phase was observed (Fig. 3A). The CO in the B1 docking site may further migrate to the B3 docking site and instantaneously escape into free solution, since the energy barrier for the B3 → solution transition is much lower than that for the B3 → B1 transition. The escaped CO from the latter process can later rebind to the heme iron, accounting for the bimolecular recombination kinetic phase. It is noteworthy that the ligand trapped in the B2 docking site has to first return to the B1 docking site before it can finally escape into free solution via the B3 docking site. The much lower energy barrier associated with the B1 → B2 transition as compared with that associated with the B1 → B3 transition is in good agreement with the unusually high geminate recombination yield of the wild type protein (Table 1).
On the other hand, as compared with the wild type protein, the B1 docking site in the G8WF mutant is relatively more stable, and the energy barrier associated with the B1 → B2 transition is higher. Consequently, the B2 docking site in the mutant is hardly populated and the majority of the CO remains in the B1 docking site. The rebinding of the CO from the B1 docking site accounts for the missing 37% geminate recombination phase (Table 1). Since the energy barrier for the geminate rebinding solely originates from the spin-inversion of the heme iron, the reaction is significantly faster than that in the wild type protein. Furthermore, the relatively lower barrier for the B1 → B3 transition allows a significant fraction of the CO molecules to escape into the B3 docking site, and once the CO migrates to the B3 docking site, the ligand can either return to the B1 docking site (due to the relatively low energy barrier associated with the B3 → B1 transition) and rebind to the heme iron via the second geminate recombination process, or it can escape into free solution and subsequently rebind to the heme iron via the bimolecular rebinding kinetic phase. The lower energy barrier associated with the B1 → B3 transition in the mutant as compared with the wild type protein accounts for the higher bimolecular rebinding yield in the former as compared with the latter.
In summary, in the wild type protein, the migration of CO from the B1 to the B3 docking site is impeded by the Trp(G8) and Leu(E11) side chains (Fig. 8, A and B), which forces the majority of the photodissociated CO ligand to migrate to the B2 docking site. In contrast, in the G8WF mutant, the reduction in the size of the G8 side chain leads to the stabilization of the B1 docking site, with respect to the B2 docking site, as well as the lower barrier for the migration of CO from the B1 to the B3 docking site. The slightly lower activation energy barrier (∆ Ea ~ 1kcal/mol) for the B2 → B1 transition in the wild type protein with respect to the B3 → B1 transition in the G8WF mutant is consistent with the ~1 kcal/mol lower activation energy barrier predicted by the ~13-fold faster rate of the geminate recombination rate constant of the wild type protein (2.5 × 10⁸ s−1) with respect to the second geminate recombination phase of the G8WF mutant, (1.9 × 10⁷ s−1). On the other hand, the bimolecular rate constants for the wild type protein and the G8WF mutant are 1.0 × 10⁴ and 5.3 × 10⁶ M−1 s−1, respectively, suggesting a ∆Ea of ~3.7 kcal/mol, in agreement with the energy barriers associated with the B3 → B1 transitions shown in Fig. 8, C and D.
Ligand Escape Tunnel—
The simulation data of the wild type protein show that, following dissociation, the CO ligand evolves from the B1 to B3 docking sites and subsequently escapes into free solution via a hydrophobic tunnel within the protein matrix. An analogous hydrophobic tunnel is observed in the G8WF mutant, indicating that the ligand escape tunnel is not coupled to the structural change near the heme site. Fig. 9, A and B, shows two alternative views of the hydrophobic tunnel as well as the helix and loop motions associated with the global conformational rearrangement coupled to the CO migration along the tunnel. Likewise, the energy landscape associated with the ligand escape process is insensitive to the mutation in the G8 residue. As shown in Fig. 9C, following its entrance into the hydrophobic tunnel, the CO ligand passes three temporary isoenergetic binding sites (labeled as i, ii, and iii) before it ultimately escapes into free solution via a downhill energy surface. The escape process is efficient, since the energy barriers separating the three temporary binding sites are negligible. The sudden drop in the energy by ~5 kcal/mol at a distance of ~24 Å is partially a result of the usage of a generalized Born continuum solvation model, which is unable to accurately describe the CO ligand in free solution. It is important to note that since the ligand migration is coupled to protein conformational change, it was crucial to implement the anisotropic network model perturbation in the PELE algorithm. In previous versions of the PELE program, the protein backbone conformation could not be perturbed as a function of ligand migration; consequently, significant energy barriers were observed for the ligand to escape to the solvent, although a similar hydrophobic tunnel was identified.
FIGURE 9. The side view (A) and top view (B) of the ligand exit tunnel for the G8WF mutant and its associated energy landscape (C).

In A and B, the tunnel is shown with the space fill representation of the CO ligand (carbon in cyan and oxygen in red). The heme group is shown in a stick representation. In C, the x axis represents the distance of center of mass of the CO ligand to the CGA carbon atom of the heme propionate group.
The hydrophobic tunnel identified in this work is consistent with the locations of the internal cavities identified in the crystallographic structure of trHbO (7). Similar long tunnel for oxygen escape has recently been identified by Boechi et al. (16) by using state-of-the-art molecular dynamics techniques. The authors identified an energy barrier of ~12 and ~5 kcal/mol for the ligand escape in the wild type protein and in the G8WF mutant, respectively, consistent with the barriers associated with B1 → B3 transitions revealed in our studies. In addition to the long tunnel, Boechi et al. (16) also identified an additional short tunnel that provides a direct path from the distal heme pocket to the solvent, which was not observed in our studies. After comparing the initial protein models used by the Boechi group and us, we found that their initial structure was derived from the chain A of the dodecamer (Protein Data Bank code 1NGK) with the presence of the Tyr(B10)-Tyr(CD1) covalent linkage, which only exists in the first six of the 12 chains in the crystal (although the covalent bond was removed for most of their energy calculations). This model was used because of the authors’ interest in evaluating the importance of the Tyr-Tyr cross-link. The A chain, however, has a large opening in the CD loop area, which could facilitate the escape of the ligand into solution from the B2 site. This open CD loop conformation is not present in the structures without the Tyr-Tyr covalent link, such as the L-chain that we used for this work. Our preliminary results with PELE using this open CD loop conformation do reproduce the short tunnel observed by Boechi et al. (16). The escape from this short tunnel has a low energy barrier for both the wild type and G8WF mutant, ~2–3 kcal/mol, which would suggest a fast escape of the ligand into solution regardless of the identity of the G8 residue, inconsistent with our experimental kinetic data. These data indicate that the short tunnel is only adopted when the Tyr-Tyr cross-link is present, raising interesting questions about the functionality of this unusual Tyr-Tyr covalent linkage.
In summary, the group II trHb from M. tuberculosis, trHbO, displays an unusually fast geminate recombination rate and slow ligand on- and off-rates (Table 1), suggesting an enclosed distal heme pocket. The mutation of the Trp(G8), which is highly conserved in the group II and III trHbs, to Phe causes 13-fold decrease in geminate recombination rate, a 530- and 12-fold increase in the on- and off-rates, respectively, as well as the appearance of a new ultrafast geminate phase that is too fast to be resolved with our instrumentation. To rationalize these experimental observations, we have employed novel computer simulation methods to decipher the ligand migration mechanism of trHbO at atomic resolution. We found that the Trp(G8) is important in anchoring the Tyr(CD1) and Leu(E11) side chain groups, thereby allowing the stabilization of the heme-bound ligand via hydrogen bonds donated from the Trp(G8) and the Tyr(CD1). Following its dissociation, the ligand can migrate between three temporary docking sites, which are modulated by the conformational rearrangements of the side chain groups of several critical distal amino acids, including the Trp(G8), Leu(E11), Tyr(CD1), and Ala(E7). The initial migration of the ligand within the distal pocket leads to its rebinding to the heme iron or its escape into free solution via a hydrophobic tunnel that coincides with the internal cavities found in the crystallographic structure of trHbO. The data demonstrate that the mutation of the Trp(G8) to Phe drastically alters the energy landscape of trHbO, underscoring its importance in regulating ligand migration in the protein.
Acknowledgments—
We thank Prof. D. A. Estrin, L. Boechi, and Prof. F. J. Luque for helpful discussions on their recent work (16) and for sharing simulation coordinates. Computational resources were provided by the Barcelona Supercomputing Center.
* This work was supported by a grant from the Spanish Ministry of Education and Science (to V. G.) through Project CTQ2007–62122/BQU. The costs of publication of this article were defrayed in part by the payment of page charges. This article must therefore be hereby marked “advertisement” in accordance with 18 U.S.C. Section 1734 solely to indicate this fact.
3. The abbreviations used are:
- Hb
hemoglobin
- trHb
truncated hemoglobin
- QM/MM
quantum mechanics and molecular mechanics.
REFERENCES
- 1.Egawa T, and Yeh SR (2005) J. Inorg. Biochem 99, 72–96 [DOI] [PubMed] [Google Scholar]
- 2.Wittenberg JB, Bolognesi M, Wittenberg BA, and Guertin M (2002) J. Biol. Chem 277, 871–874 [DOI] [PubMed] [Google Scholar]
- 3.Milani M, Pesce A, Nardini M, Ouellet H, Ouellet Y, Dewilde S, Bocedi A, Ascenzi P, Guertin M, Moens L, Friedman JM, Wittenberg JB, and Bolognesi M (2005) J. Inorg. Biochem 99, 97–109 [DOI] [PubMed] [Google Scholar]
- 4.Wu G, Wainwright LM, and Poole RK (2003) Adv. Microb. Physiol 47, 255–310 [DOI] [PubMed] [Google Scholar]
- 5.Mukai M, Savard PY, Ouellet H, Guertin M, and Yeh SR (2002) Biochemistry 41, 3897–3905 [DOI] [PubMed] [Google Scholar]
- 6.Ouellet H, Juszczak L, Dantsker D, Samuni U, Ouellet YH, Savard PY, Wittenberg JB, Wittenberg BA, Friedman JM, and Guertin M (2003) Biochemistry 42, 5764–5774 [DOI] [PubMed] [Google Scholar]
- 7.Milani M, Savard PY, Ouellet H, Ascenzi P, Guertin M, and Bolognesi M (2003) Proc. Natl. Acad. Sci. U. S. A 100, 5766–5771 [DOI] [PMC free article] [PubMed] [Google Scholar]
- 8.Ouellet H, Milani M, LaBarre M, Bolognesi M, Couture M, and Guertin M (2007) Biochemistry 46, 11440–11450 [DOI] [PubMed] [Google Scholar]
- 9.Lu C, Egawa T, Mukai M, Poole RK, and Yeh SR (2008) Methods Enzymol 437, 255–286 [DOI] [PubMed] [Google Scholar]
- 10.Feis A, Lapini A, Catacchio B, Brogioni S, Foggi P, Chiancone E, Boffi A, and Smulevich G (2008) Biochemistry 47, 902–910 [DOI] [PubMed] [Google Scholar]
- 11.Elber R, and Karplus M (1990) J. Am. Chem. Soc 112, 9161–9175 [Google Scholar]
- 12.Tilton RF, Singh UC, Kuntz ID, and Kollman PA (1988) J. Mol. Biol 199, 195. [DOI] [PubMed] [Google Scholar]
- 13.Warshel A (1977) Proc. Natl. Acad. Sci. U. S. A 74, 1789–1793 [DOI] [PMC free article] [PubMed] [Google Scholar]
- 14.Ludemann SK, Lounnas V, and Wade RC (2000) J. Mol. Biol 303, 797–811 [DOI] [PubMed] [Google Scholar]
- 15.Marti MA, Bidon-Chanal A, Crespo A, Yeh SR, Guallar V, Luque FJ, and Estrin DA (2008) J. Am. Chem. Soc 130, 1688–1693 [DOI] [PubMed] [Google Scholar]
- 16.Boechi L, Marti MA, Bolognesi M, Luque FJ, and Estrin DA (2008) Proteins Struct. Funct. Bioinformat 73, 372–379 [DOI] [PubMed] [Google Scholar]
- 17.Borrelli KW, Vitalis A, Alcantara R, and Guallar V (2005) J. Chem. Theory Comput 1, 1304–1311 [DOI] [PubMed] [Google Scholar]
- 18.Couture M, Yeh SR, Wittenberg BA, Wittenberg JB, Ouellet Y, Rousseau DL, and Guertin M (1999) Proc. Natl. Acad. Sci. U. S. A 96, 11223–11228 [DOI] [PMC free article] [PubMed] [Google Scholar]
- 19.Lu C, Egawa T, Wainwright LM, Poole RK, and Yeh SR (2007) J. Biol. Chem 282, 13627–13636 [DOI] [PubMed] [Google Scholar]
- 20.Bahar I, Atilgan AR, and Erman B (1997) Folding Des 2, 173–181 [DOI] [PubMed] [Google Scholar]
- 21.Friesner RA, and Guallar V (2005) Annu. Rev. Phys. Chem 56, 389–427 [DOI] [PubMed] [Google Scholar]
- 22.Guallar V, and Borrelli KW (2005) Proc. Natl. Acad. Sci. U. S. A 102, 3954–3959 [DOI] [PMC free article] [PubMed] [Google Scholar]
- 23.Jacobson MP, Friesner RA, Xiang ZX, and Honig B (2002) J. Mol. Biol 320, 597–608 [DOI] [PubMed] [Google Scholar]
- 24.Samuni U, Ouellet Y, Guertin M, Friedman JM, and Yeh SR (2004) J. Am. Chem. Soc 126, 2682–2683 [DOI] [PubMed] [Google Scholar]
- 25.Yu N-T, and Kerr EA (1988) in Biological Applications of Raman Spectroscopy: Resonance Raman Spectra of Hemes and Metalloproteins (Spiro TG, ed) pp. 39–95, John Wiley & Sons, Inc., New York [Google Scholar]
- 26.Vogel KM, Kozlowski PM, Zgierski MZ, and Spiro TG (2000) Inorg. Chim. Acta 297, 11–17 [Google Scholar]
- 27.Feis A, Rodriguez-Lopez JN, Thorneley RNF, and Smulevich G (1998) Biochemistry 37, 13575–13581 [DOI] [PubMed] [Google Scholar]
- 28.Li T, Quillin ML, Phillips GN Jr., and Olson JS (1994) Biochemistry 33, 1433–1446 [DOI] [PubMed] [Google Scholar]
- 29.Lu C, Mukai M, Lin Y, Wu G, Poole RK, and Yeh SR (2007) J. Biol. Chem 282, 25917–25928 [DOI] [PubMed] [Google Scholar]
- 30.Mukai M, Mills CE, Poole RK, and Yeh SR (2001) J. Biol. Chem 276, 7272–7277 [DOI] [PubMed] [Google Scholar]
- 31.Couture M, Burmester T, Hankeln T, and Rousseau DL (2001) J. Biol. Chem 276, 36377–36382 [DOI] [PubMed] [Google Scholar]
- 32.Das TK, Lee HC, Duff SM, Hill RD, Peisach J, Rousseau DL, Wittenberg BA, and Wittenberg JB (1999) J. Biol. Chem 274, 4207–4212 [DOI] [PubMed] [Google Scholar]
- 33.Das TK, Friedman JM, Kloek AP, Goldberg DE, and Rousseau DL (2000) Biochemistry 39, 837–842 [DOI] [PubMed] [Google Scholar]
- 34.Carver TE, Rohlfs RJ, Olson JS, Gibson QH, Blackmore RS, Springer BA, and Sligar SG (1990) J. Biol. Chem 265, 20007–20020 [PubMed] [Google Scholar]
- 35.Guallar V, Jarzecki AA, Friesner RA, and Spiro TG (2006) J. Am. Chem. Soc 128, 5427–5435 [DOI] [PubMed] [Google Scholar]
- 36.Alcantara RE, Xu C, Spiro TG, and Guallar V (2007) Proc. Natl. Acad. Sci. U. S. A 104, 18451. [DOI] [PMC free article] [PubMed] [Google Scholar]
- 37.Wei GH, Mousseau N, and Derreumaux P (2002) J. Chem. Phys 117, 11379–11387 [Google Scholar]
- 38.Spiro TG, and Wasbotten IH (2005) J. Inorg. Biochem 99, 34–44 [DOI] [PubMed] [Google Scholar]
- 39.Henry ER, Sommer JH, Hofrichter J, and Eaton WA (1983) J. Mol. Biol 166, 443–451 [DOI] [PubMed] [Google Scholar]
- 40.Springer BA, Sligar SG, Olson JS, and Phillips GN Jr. (1994) Chem. Rev 94, 699–714 [Google Scholar]