Abstract
Diabetes is a complex metabolic syndrome that is characterized by prolonged high blood glucose levels and frequently associated with life-threatening complications1,2. Epidemiological studies have suggested that diabetes is also linked to an increased risk of cancer3–5. High glucose levels may be a prevailing factor that contributes to the link between diabetes and cancer, but little is known about the molecular basis of this link and how the high glucose state may drive genetic and/or epigenetic alterations that result in a cancer phenotype. Here we show that hyperglycaemic conditions have an adverse effect on the DNA 5-hydroxymethylome. We identify the tumour suppressor TET2 as a substrate of the AMP-activated kinase (AMPK), which phosphorylates TET2 at serine 99, thereby stabilizing the tumour suppressor. Increased glucose levels impede AMPK-mediated phosphorylation at serine 99, which results in the destabilization of TET2 followed by dysregulation of both 5-hydroxymethylcytosine (5hmC) and the tumour suppressive function of TET2 in vitro and in vivo. Treatment with the antidiabetic drug metformin protects AMPK-mediated phosphorylation of serine 99, thereby increasing TET2 stability and 5hmC levels. These findings define a novel ‘phospho-switch’ that regulates TET2 stability and a regulatory pathway that links glucose and AMPK to TET2 and 5hmC, which connects diabetes to cancer. Our data also unravel an epigenetic pathway by which metformin mediates tumour suppression. Thus, this study presents a new model for how a pernicious environment can directly reprogram the epigenome towards an oncogenic state, offering a potential strategy for cancer prevention and treatment.
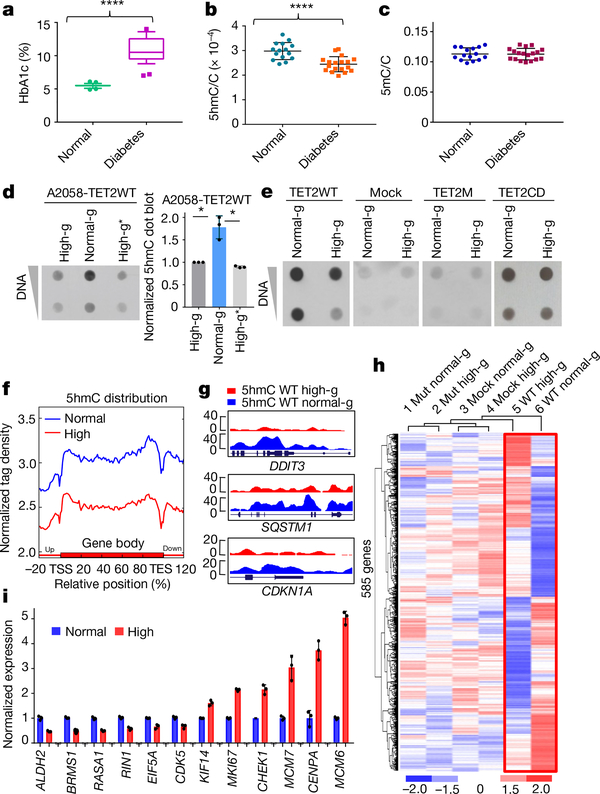
DNA methylation (5mC) and hydroxymethylation (5hmC) are epigenetic modifications that are frequently perturbed in cancer6–8. The conversion of 5mC to 5hmC occurs through an oxidative reaction catalysed by the ten-eleven translocation (TET) protein family of dioxygenases (TET1, TET2 and TET3)9–11. The reaction requires α-ketoglutarate, a metabolite that is influenced by the availability of glucose and glutamine12,13. This led us to predict that a hyperglycaemic state would increase the levels of 5hmC in blood cells from patients with diabetes. To test this possibility, we examined global 5hmC in gDNA extracted from peripheral blood mononuclear cells (PBMC) collected from a cohort of healthy donors (haemoglobin A1c (HbA1c) 5.5 ± 0.26%) and patients with diabetes (HbA1c 10.7 ± 1.9%, Fig. 1a). Unexpectedly, samples from patients showed a significant (P = 0.0017) decrease in 5hmC levels compared to the healthy donors (Fig. 1b, Extended Data Fig. 1a), whereas 5mC levels remained the same (Fig. 1c). The presence of diabetes in the patient group was the strongest predictor of low 5hmC levels, with HbA1c levels showing a significant (P < 0.05) inverse correlation with 5hmC (Extended Data Table 1a).
Fig. 1 |. Hyperglycaemia deregulates global DNA 5hmC levels, and this regulation requires a functional, full-length TET2.
a, Comparison of HbA1c between 28 healthy donors and 29 patients with diabetes. ****P = 2.88 × 10⁻¹⁵. Box plot: centre lines, median; limits, upper and lower quartiles; top and bottom whiskers, 10% and 90% percentiles; points, outliers. b, High-performance liquid chromatography with tandem mass spectrometry (HPLC–MS/MS) analysis of ratio of 5hmC to total C in randomly selected gDNA from 15 healthy donors and 18 patients. ****P = 7.44 × 10⁻⁵. c, HPLC–MS/MS analysis of ratio of 5mC to total C from the same samples as in b. d, Left, dot blot of 5hmC in DNA extracted from A2058-TET2WT cell line cultured in high glucose (high-g) or normal glucose (normal-g), or switched from normal to high glucose (high-g*). Right, quantification of dot blots. *P = 0.034 (high-g), P = 0.026 (high-g*). e, Dot blot comparison of 5hmC levels in A2058-TET2WT, mock (an A2058 cell line stably expressing empty vector), A2058-TET2M, and A2058-TET2CD cell lines cultured in high and normal glucose. f, Normalized hMeDIP–seq 5hmC tag density distribution across gene bodies in A2058-TET2WT cells cultured in high glucose (red) or normal glucose (blue). Each gene body was normalized relative to position percentage within the gene. g, hMeDIP–seq results of representative genes in which 5hmC is increased across the gene body in normal glucose. y-axis represents 5hmC density. h, Unguided clustering of genes that are differentially expressed when TET2 is present (in red frame) and not differentially expressed when TET2 is absent. Mut, A2058-TET2M. i, RT–qPCR validation of a subset of cancer-associated genes identified in h. Data represent three technical repeats in i and three biologically independent repeats in d, e. Two-sided Student’s t-test, data shown as mean ± s.d., *P < 0.05, ****P < 0.0001.
To investigate this inverse correlation, we cultured several cell lines under normal glucose (1 g l−1) and high glucose (4.5 g l−1) conditions. A subset of these cell lines (PBMC, HUVEC and TF-1) exhibited significantly (P = 0.022 (PBMC), 0.046 (HUVEC), 0.047 (TF-1)) lower levels of 5hmC when subjected to high as opposed to normal glucose. The other cell lines (A375, A2058 and SK-MEL-5) did not show apparent changes in 5hmC levels between the two glucose conditions, as they have low baseline levels of 5hmC (Extended Data Fig. 1b).
Loss of 5hmC is an epigenetic hallmark of cancer, in which diminished levels of TET2 expression have an important role14,15. We hypothesized that the alterations in 5hmC in response to glucose were mediated through TET2, as TET1 and TET3 were barely detectable in these cells. Indeed, glucose-responsive cells (PBMC, HUVEC and TF-1) showed decreased TET2 in high glucose, whereas TET2 remained low and unaltered in the glucose-nonresponsive cells (A2058, A375 and SK-MEL-5) (Extended Data Fig. 1c). To unravel the specific role of TET2 in this modulation, we used an A2058-TET2WT stable cell line, in which the expression of TET1 and TET3 is low and the expression of TET2 and 5hmC levels have been restored15 (Extended Data Fig. 1d, e). High glucose reduced the level of TET2 protein in TET2WT cells, whereas the TET2 mRNA level remained unchanged (Extended Data Fig. 1f, g). Notably, the protein half-life of TET2 was substantially lower under high glucose than under normal glucose (Extended Data Fig. 1h). Unlike native A2058 cells (Extended Data Fig. 1b), A2058-TET2WT cells showed a significant (P = 0.034) increase in 5hmC levels after 7 days of culture in normal glucose. This increase, however, could be reversed (within 24 h) by switching the culturing medium to high glucose (Fig. 1d, Extended Data Fig. 1i, j; see Supplementary Information for details). Such modulation was not observed in stable A2058 cell lines expressing mock control (mock), catalytically inactive full-length TET2 (TET2M), or catalytically active C-terminal TET2 (TET2CD) (Fig. 1e, Extended Data Fig. 1k). These data suggest that functional, full-length TET2 is required to mediate the reversible changes in 5hmC in response to extracellular glucose availability.
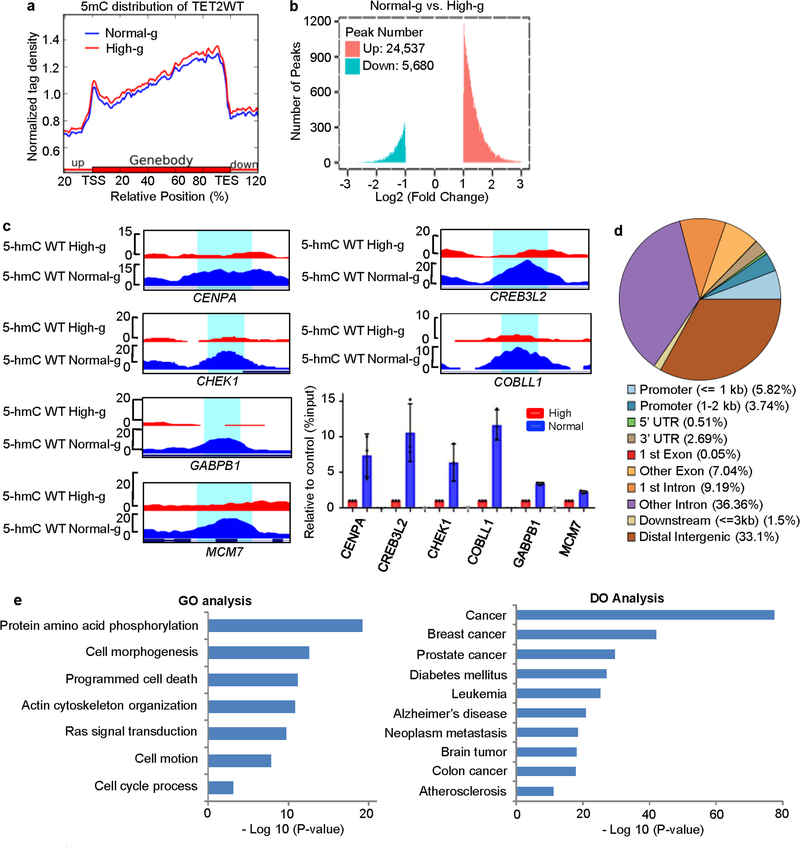
To identify gene-specific 5hmC changes in response to glucose, we analysed genome-wide alterations in 5hmC in A2058-TET2WT cells using hydroxymethylated DNA immunoprecipitation coupled with deep sequencing (hMeDIP–seq) and methylated DNA immunoprecipitation coupled with deep sequencing (MeDIP–seq). These analyses showed that 5hmC was higher under normal glucose than high glucose, whereas there was no significant difference in 5mC (Fig. 1f, Extended Data Fig. 2a). We identified 30,217 differentially 5-hydroxymethylated regions (DhMRs), with more than 80% (about 24,537) of the regions being increased under normal glucose (Extended Data Fig. 2b, c). The majority of this DhMR enrichment (65.4%) was associated with gene regions, with 9.56% localizing to promoters and 55.84% to gene bodies (Fig. 1g, Extended Data Fig. 2d). Notably, gene ontology and disease ontology analyses of these DhMR enriched genes showed strong associations with cancer and cancer-related pathways (Extended Data Fig. 2e).
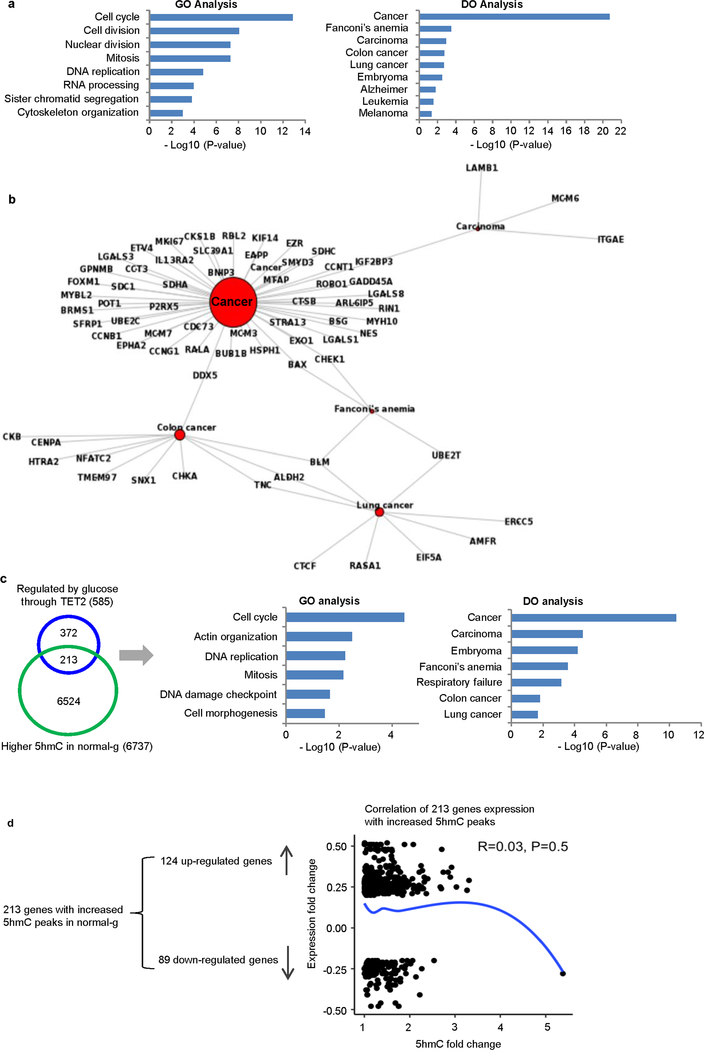
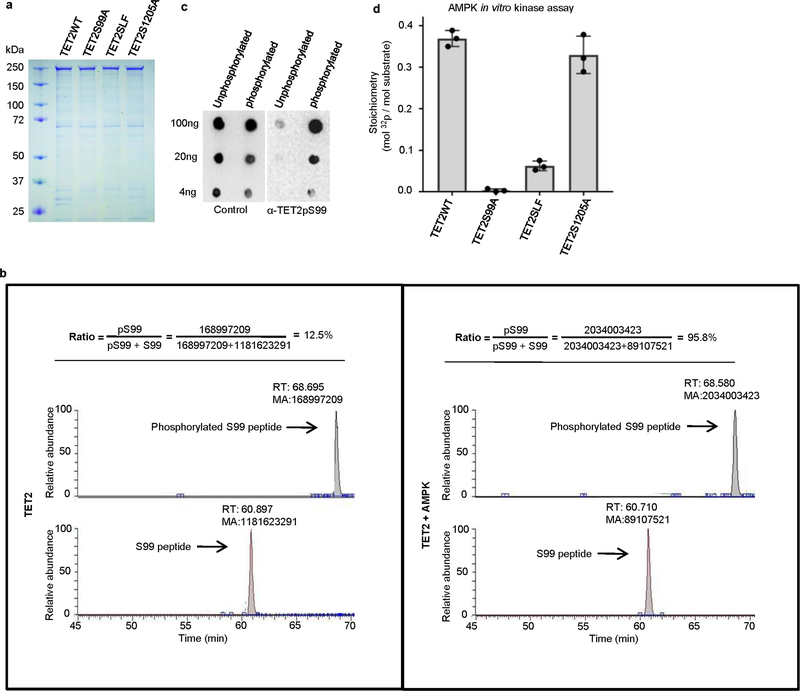
We next used microarrays to compare transcriptomes of mock, A2058-TET2M and A2058-TET2WT cells cultured in normal or high glucose (Fig. 1h). This analysis identified 585 genes that were differentially expressed in normal glucose versus high glucose when TET2 was present (A2058-TET2WT), but not in mock or A2058-TET2M cells (Fig. 1h, Extended Data Table 1b). These glucose-modulated and TET2-dependent genes are involved in cell cycle regulation and are associated with various cancers (Extended Data Fig. 3a, b). Among these genes, we found several tumour suppressor and tumour promoting genes that were downregulated and upregulated, respectively, under the high glucose condition, and validated a subset of these using quantitative PCR with reverse transcription (RT–qPCR) (Fig. 1i). Furthermore, we found that 213 of the 585 genes (36.4%) contained increased DhMRs in normal glucose. Gene ontology and disease ontology analysis revealed that these 213 genes were also highly associated with cell cycle regulation and various types of cancers (Extended Data Fig. 3c). Of note, these genes consist of both upregulated and downregulated genes (Extended Data Fig. 3d), suggesting that 5hmC has a complex role in gene regulation, as previously reported16,17. AMPK is a key nutrient or energy sensor that is highly sensitive to glucose availability18. TET2 contains two putative AMPK motifs centred on serines 99 (S99) and 1205 (S1205) (Fig. 2a). Furthermore, the activated form of AMPK (pAMPK172) was co-immunoprecipitated with TET2 (Fig. 2b). To show that TET2 is a substrate of AMPK, we carried out an in vitro AMPK kinase assay (Fig. 2c, Extended Data Fig. 4a). By liquid chromatography with tandam mass spectrometry (LC–MS/MS) analysis, we detected robust phosphorylation of TET2, specifically at S99, by the active form of AMPK (Fig. 2d, Extended Data Fig. 4b). There was little change to the other putative phosphorylation sites, including S1205. We next generated an antibody that specifically recognizes the phosphorylated form of TET2 S99 (Extended Data Fig. 4c). Immunoblotting confirmed the specificity of the antibody, as it gave a strong signal when used against AMPK-treated TET2WT, but not with untreated TET2WT or TET2 with a serine-to-alanine mutation at position 99 (TET2S99A) (Fig. 2e). Using a 32P radiolabelling kinase assay, we observed a marked decrease in γ-ATP incorporation in the TET2S99A mutant as well as in the S102_L103 >F (SLF) mutant (http://cancer.sanger.ac.uk/cosmic). By contrast, TET2WT and the S1205A mutant demonstrated comparably high levels of radioactivity (Fig. 2f, Extended Data Fig. 4d). These findings reveal that TET2 is a substrate of AMPK and that S99 is the major phosphorylation site catalysed by AMPK.
Fig. 2 |. TET2 is a substrate of AMPK, which specifically phosphorylates TET2 at S99.
a, Conserved AMPK recognition motif of several key AMPK target enzymes, including TET2. b, Co-immunoprecipitation showing that Flag–TET2 interacts with the activated form of AMPK (AMPKpT172). c, Flowchart of the in vitro kinase assay with different detection approaches. d, LC–MS/MS profiling of the in vitro AMPK kinase assay showed that TET2S99 is specifically phosphorylated in the presence of active AMPK. e, Immunoblot validation of TET2pS99 phosphorylation using a TET2pS99-specific antibody. f, Determination of TET2 phosphorylation at S99 via 32P-autoradiograph (SLF is a naturally occurring mutant that probably disrupts the AMPK binding site). Data represent three biologically independent repeats in b, e, f.
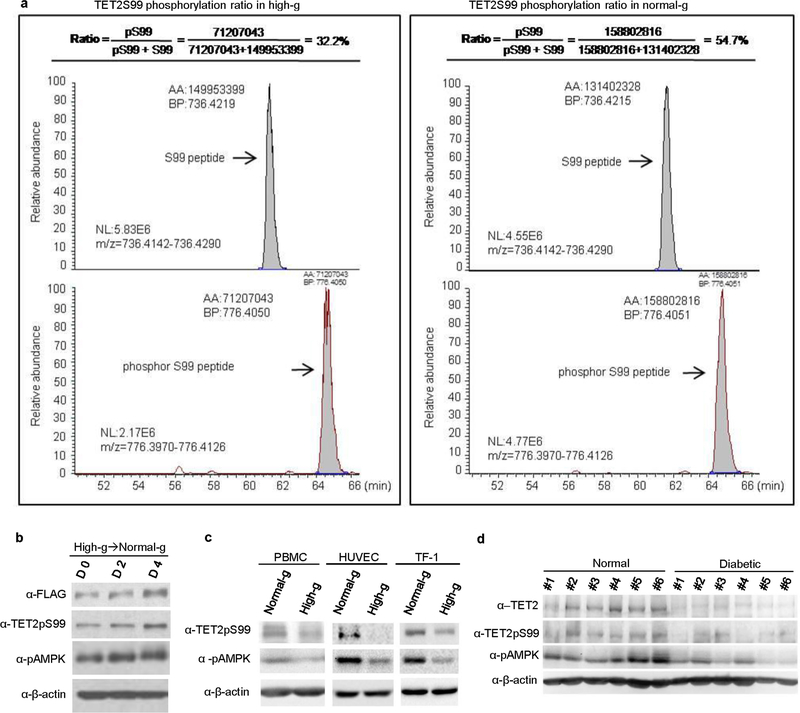
AMPK is known to be activated upon energy stress induced by glucose depletion19,20. We hypothesized that glucose-mediated TET2 protein stability was modulated through phosphorylation of TET2S99 by AMPK. To test this hypothesis, we first compared TET2S99 phosphorylation levels in A2058-TET2WT cells cultured in normal glucose versus high glucose. Both western blot (P = 0.027) and HPLC–MS analysis (P = 0.030) revealed that the phosphorylation status of TET2S99 (TET2pS99) was significantly higher in normal as compared to high glucose (Fig. 3a, b, Extended Data Fig. 5a). Consistent with the kinetics of 5hmC shown in Extended Data Fig. 1i, j, we observed steady increases in pAMPK, TET2pS99 and TET2 during days 0, 2 and 4 after switching from high to normal glucose (Extended Data Fig. 5b). These increases were confirmed in other cell lines as well as in PBMCs (Extended Data Fig. 5c). Notably, pAMPK, TET2pS99 and total TET2 were significantly (P = 1.01 × 10⁻⁶ (TET2), 0.0035 (TET2pS99), 5.26 × 10⁻⁴ (pAMPK)) higher in PBMCs from healthy donors than in those from patients with diabetes (Fig. 3c, Extended Data Fig. 5d). This is consistent with our observation that 5hmC is increased in the healthy group (Fig. 1a, b). Collectively, these data demonstrate that TET2 is phosphorylated at S99 by AMPK, which is suppressed under hyperglycaemic conditions.
Fig. 3 |. Glucose regulates TET2 stability via the TET2pS99 phosphorylation switch, which is controlled by AMPK.
a, Left, immunoblot signal of phosphoserine 99 (TET2pS99) on Flag–TET2WT immunoprecipitated from cells cultured in high or normal glucose. Right, quantification of TET2pS99 signals normalized by total TET2, *P = 0.027. b, LC–MS/MS validation of pS99 levels in the cells under high and normal glucose, *P = 0.030. c, Normalized TET2, TET2pS99 and pAMPK levels in PBMCs from healthy donors and patients with diabetes; n = 6, ****P = 1.01 × 10⁻⁶ (TET2), **P = 0.0035 (TET2pS99), ***P = 5.26 × 10⁻⁴ (pAMPK). d, Flag–TET2WT half-life and pAMPK levels under normal glucose or normal glucose switched to high glucose. e, Left, dot blot showing 5hmC levels in A2058-TET2WT cells after treatment with 100 μM A769662 (an AMPK activator). Right, normalized quantification of dot blot signals; *P = 0.029. f, CHX treatment to measure the half-life of Flag–TET2WT in cells treated with (+) or without (−) metformin (Met; 5 mM). g, Effects of knocking down AMPKα2 on the protein stabilities of Flag–TET2WT and TET2S99A. Scr, scrambled shRNA. h, Half-lives of Flag–TET2S99D and TET2S99A. i, HPLC–MS/MS results showing the effects of knocking down AMPKα2 on 5hmC levels in TET2WT (**P = 0.006 (sh1), 0.003 (sh2)) cells and cells overexpressing TET2S99A or TET2S99D. Data represent three biologically independent repeats in a, b, d–i. Two-sided Student’s t-test, data shown as mean ± s.d., * P < 0.05, **P < 0.01, ***P < 0.001, ****P < 0.0001. For gel source data, see Supplementary Fig. 1.
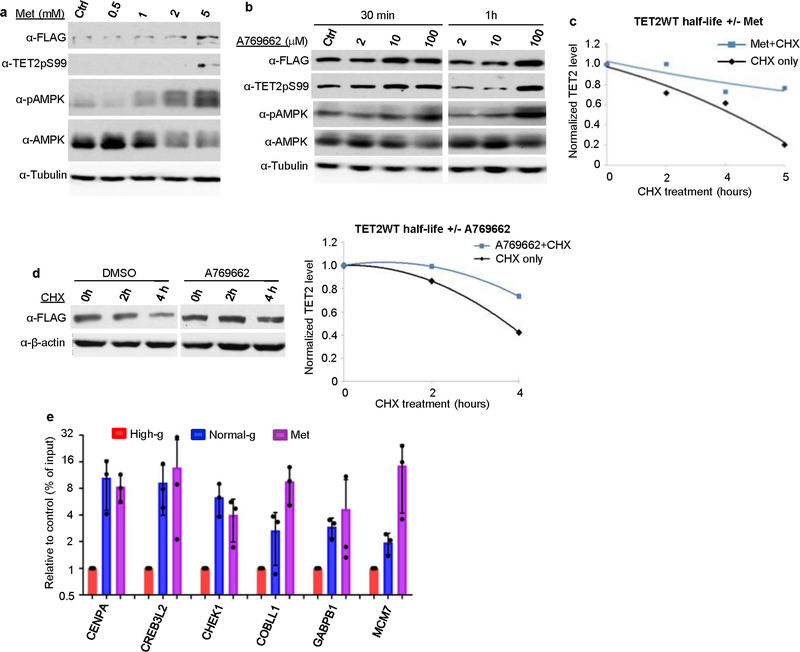
To investigate the pivotal role of AMPK-mediated phosphorylation in TET2 stability and 5hmC levels, we measured the half-life of TET2 and corresponding AMPK activity in cells that were initially cultured in normal glucose and were then switched to high glucose or kept in normal glucose. As indicated by pAMPK (pThr172), AMPK retained phosphorylation activity in cells that were continually cultured in normal glucose, whereas it was deactivated in cells switched to high glucose. Concomitantly, we observed that the half-life of TET2 protein was substantially reduced in cells that were switched to high glucose (Fig. 3d). Next, we treated cells with AMPK activators (metformin or A769662)21,22. As predicted, the activators elevated the levels of pAMPK, TET2pS99, total TET2 (Extended Data Fig. 6a, b) and 5hmC (Fig. 3e). When cells cultured in high glucose were treated with metformin or A769662, the half-life of TET2 increased notably (Fig. 3f, Extended Data Fig. 6c, d). Furthermore, metformin treatment also increased 5hmC in a subset of DhMRs previously identified to be increased under normal glucose (Extended Data Fig. 6e). To demonstrate that AMPK directly regulates TET2 protein stability, we used short hairpin RNAs (shRNAs) to specifically knockdown AMPKα2, an AMPKα isoform enriched in the nucleus23, in A2058 cells expressing TET2WT or TET2S99A, the non-phosphorylatable mutant. AMPKα2 shRNAs effectively depleted AMPKα2 and resulted in a marked decrease in TET2WT protein but not in the S99A mutant (Fig. 3g). These data suggest that AMPK and TET2S99 phosphorylation are important for protecting TET2 stability.
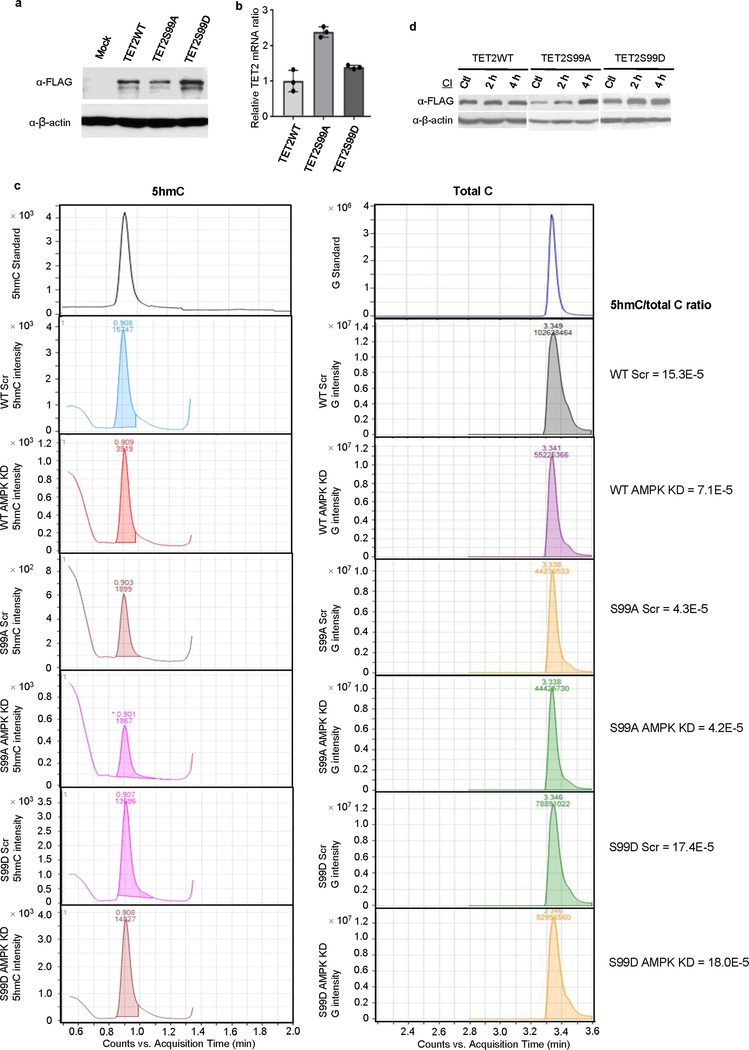
To identify the role of S99 phosphorylation, we generated another A2058 stable cell line expressing a phospho-mimic mutant, TET2S99D (Extended Data Fig. 7a, b).When treated with cycloheximide (CHX), the TET2S99A mutant exhibited less stability than the TET2S99D mutant (Fig. 3h). Consistent with greater protein stability, the TET2S99D cells had higher 5hmC than TET2S99A cells in high glucose (Fig. 3i). After knocking down AMPK, we observed a marked drop in 5hmC levels in wild-type cells, with no such effect in the TET2S99A or S99D cells (Fig. 3i, Extended Data Fig. 7c).
Previous studies have shown that the stability of TET2 protein is regulated by calpain family proteases24, and phosphorylation can protect proteins from calpain cleavage25. Thus, we hypothesized that phosphorylation of S99 protects TET2 from calpain-mediated degradation. Indeed, treatment with a calpain inhibitor strongly stabilized TET2S99A and increased the protein level 3.7-fold, whereas only marginal effects were seen with TET2WT and TET2S99D (Extended Data Fig. 7d). Together, these results indicate that TET2pS99 is a ‘phospho- switch’ that is regulated by AMPK and is critical for the regulation of the stability of TET2 and levels of 5hmC.
To investigate how this AMPK–TET2 axis translates sustained high glucose exposure into a cancer-prone phenotype, we investigated the effects of TET2 and glucose levels on cell proliferation. A2058-TET2WT cells showed significantly (P = 5.68 × 10⁻⁵) higher cell proliferation rates in high glucose than in normal glucose, whereas mock cells showed little effect (Extended Data Fig. 8a). Notably, this TET2-dependent and glucose-influenced growth phenotype was validated in an independent model, TF-1 cells26 (Extended Data Fig. 8b–d). These data suggest that TET2 has an important role in glucose-modulated tumour cell growth.
There is growing evidence that metformin, a widely used anti-diabetic drug, is also a potential anti-cancer agent27,28. We investigated whether the effect of metformin on cell proliferation also involves the AMPK–TET2–5hmC axis. We treated A2058-TET2WT, A2058-TET2S99A and mock cells with metformin and detected a significant (P = 0.026) increase in 5hmC levels in TET2WT cells, but not in TET2S99A or mock cells (Extended Data Fig. 8e). Using MTS (3-(4,5-dimethylthiazol-2-yl)-5-(3-carboxymethoxyphenyl)-2-(4-sulfophenyl)-2H-tetrazolium) proliferation assays, we examined the growth of cells treated with metformin and observed that metformin significantly (P = 7.18 × 10⁻⁵) reduced the proliferation of TET2WT cells, but had no effect on TET2S99A or mock cells (Extended Data Fig. 8f).
Next, we analysed the anchorage-independent growth of TET2WT, TET2S99A and mock cells. Restoring TET2 expression reduced anchorage-independent growth of A2058 cells. However, this suppression was compromised in A2058 cells expressing TET2S99A (Extended Data Fig. 8g, h, 0 mM). This phenomenon could be recapitulated in an independent cell line, MDA-MB-231 (Extended Data Fig. 8i–l). Notably, metformin further reduced colony growth in a dose-dependent manner, adding another layer of suppression to A2058-TET2WT cells. By contrast, the TET2S99A mutant and mock cells did not show significant growth inhibition upon metformin treatment (Extended Data Fig. 8g, h, 2–4 mM). Collectively, these results demonstrate in vitro that metformin requires the AMPK–TET2–5hmC axis to execute its anti-tumour effects.
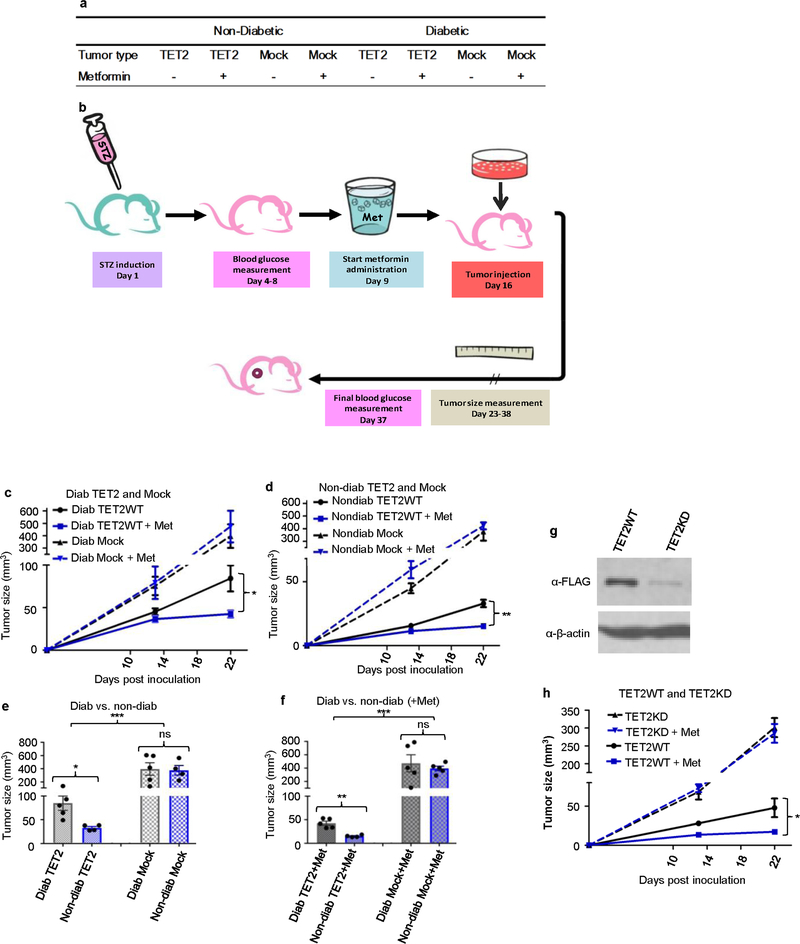
To validate our hypothesis in vivo, we first generated BALB/c nude mice xenografted with TET2WT or mock A2058 tumours under both diabetic and non-diabetic conditions, as outlined in Extended Data Fig. 9a, b. In support of the role of TET2 as a tumour suppressor, TET2WT tumours were significantly smaller than those of the mock control in both diabetic (Fig. 4a, c; P = 8.3 × 10⁻⁴) and non-diabetic mice (Fig. 4b, d; P = 5.2 × 10⁻⁶). Notably, TET2WT tumours in diabetic mice were significantly larger than those in non-diabetic mice (Extended Data Fig. 9e, f; P = 0.026 without metformin treatment, P = 0.0023 with metformin treatment). By contrast, there was little difference between mock tumours grown in diabetic or non-diabetic mice. These results are consistent with a mechanism in which a sustained diabetic or hyperglycaemic environment impairs TET2–5hmC-mediated tumour suppression.
Fig. 4 |. Hyperglycaemia promotes xenografted tumour growth, which is suppressed by TET2 and further prevented by metformin.
a, b, Representative images of tumour-bearing diabetic (a) and nondiabetic (b) nude mice xenografted with A2058-TET2WT (left) or mock tumour cells (right) treated with (+) or without (−) metformin. c, d, Quantitative comparison of tumour size and efficacy of metformin’s tumour suppressive function on A2058-TET2WT and mock tumours in diabetic (c) and non-diabetic (d) nude mice. c, n = 5, ***P = 8.3 × 10⁻⁴ (TET2 versus mock), *P = 0.048 (TET2 versus TET2 + Met). d, n = 4–5, ****P = 5.2 × 10⁻⁶ (TET2 versus mock), 0.0046 (TET2 versus TET2 + Met). Two-sided Student’s t-test, data shown as mean ± s.e.m. *P < 0.05, **P < 0.01, ***P < 0.001, ****P < 0.0001; NS, not significant.
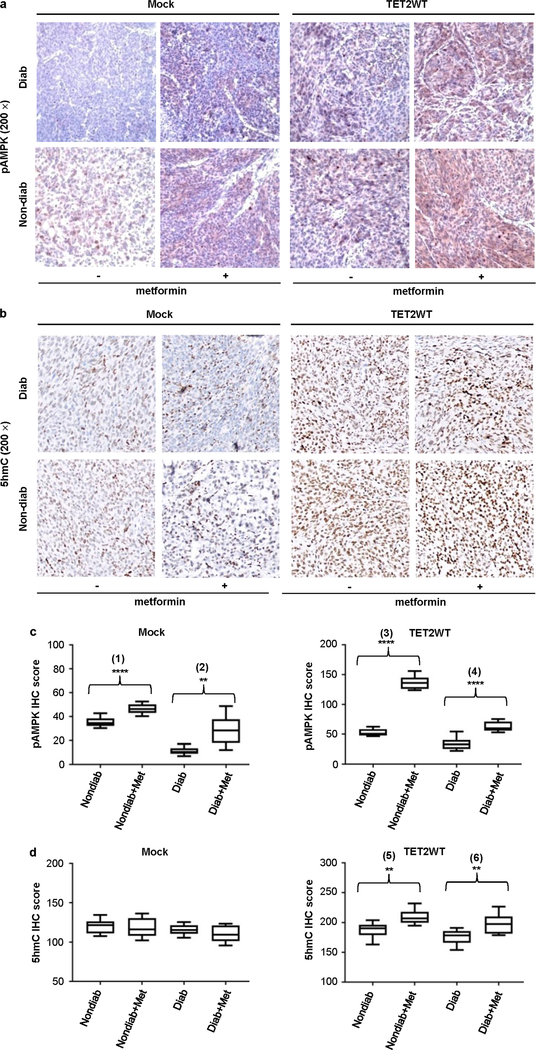
Next, we investigated whether we could observe the anti-tumour effects of metformin, also operating through the AMPK–TET2–5hmC axis, in vivo. We found that metformin imposed an additional layer of suppression on TET2WT tumours in both diabetic and non-diabetic mice (Extended Data Fig. 9c, d). By contrast, mock tumours showed little, if any, difference in size under the same treatments. Notably, when we depleted TET2 expression in A2058-TET2WT cells, the tumours behaved similarly to mock tumours and were no longer suppressed by metformin (Extended Data Fig. 9g, h). We should note that metformin did not change blood glucose levels, consistent with a previous report29 (Extended Data Table 1c). Nevertheless, immunohistochemical (IHC) staining for pAMPK showed that metformin treatment effectively increased pAMPK in both TET2WT and mock tumours (Extended Data Fig. 10a, c). The levels of 5hmC, however, were increased only in TET2WT tumours treated with metformin (Extended Data Fig. 10b, d). These data demonstrate in vivo that the anti-tumour effect of metformin requires a functional TET2 protein and acts downstream of the influence of glucose upon the AMPK–TET2–5hmC axis.
In summary, we have shown that sustained hyperglycaemia destabilizes the tumour suppressor TET2 and deregulates levels of 5hmC. We describe an environment-to-epigenome signalling pathway, the glucose–AMPK–TET2–5hmC axis, which links the level of extracellular glucose to the dynamic regulation of 5hmC—and, ultimately, diabetes to cancer. We have identified AMPK-mediated TET2 phosphorylation at S99 as a molecular switch that controls a pivotal step in the glucose–AMPK–TET2–5hmC axis. Disabling this switch causes calpain-mediated degradation of TET2, resulting in a dysregulated hydroxymethylome and transcriptome. Notably, the anti-tumour effect of metformin requires a functional AMPK–TET2–5hmC axis. We propose that the glucose–AMPK–TET2–5hmC axis, which may work separately or in conjunction with other cellular pathways such as those involving mTOR30, is a signalling pathway by which cancer-promoting environmental cues are directly linked to the reprogramming of a cancer-favourable epigenome. This epigenetic regulation may have a direct effect on the efficacy of metformin in preventing cancer, thus providing novel avenues for future clinical investigation.
Extended Data
Extended Data Fig. 1 |. Biochemical and molecular analysis of 5hmC and TET2 in response to glucose in primary blood cells and cultured cell lines.
a, Dot blot comparison of global 5hmC levels between PBMC gDNA from 28 healthy donors and 29 patients with diabetes, **P = 0.0017. b, Genomic DNA extracted from several cell types cultured under high or normal glucose were dot blotted for 5hmC, *P = 0.022 (PBMC), 0.046 (HUVEC), 0.047 (TF-1). c, Western blot revealed that endogenous TET2 protein levels in PBMCs, HUVECs and TF-1 cells were higher when cultured in normal glucose than in high glucose. TET1 and TET3 protein levels were minimally detectable in these cell lines. d, e, RT–qPCR (d) and western blot (e) showed that TET2 dominated amongst the TET family in A2058-TET2WT cells. In A2058 cells, expression of all three genes was extremely low. f, Flag–TET2 protein levels in whole-cell lysates from A2058-TET2WT cells cultured in high glucose or normal glucose. g, Comparable levels of Flag–TET2 mRNA from A2058-TET2WT cells cultured in high glucose or normal glucose. h, Half-lives of Flag–TET2 in A2058-TET2WT cells cultured in high glucose or normal glucose. i, High glucose shock resulted in an acute increase in 5hmC in A2058-TET2WT cells followed by a rapid drop to baseline. j, Long-term culturing of A2058-TET2WT cells in normal glucose resulted in a sustained increase in 5hmC, which could be reversed by switching the medium to high glucose. See Supplementary Information for more details. k, Dot blot quantification of 5hmC levels in A2058-TET2WT, mock, A2058-TET2M, and A2058-TET2CD cell lines in Fig. 1e; **P = 0.0068. Data in b–k represent three biologically independent repeats each. Two-sided Student’s t-test, data shown as mean ± s.d. *P < 0.05, **P < 0.01. For gel source data, see Supplementary Fig. 1.
Extended Data Fig. 2 |. Genome-wide alterations in 5mC and 5hmC under normal glucose compared with high glucose.
a, Normalized 5mC tag density distribution of A2058-TET2WT across gene bodies under high glucose (red) and normal glucose (blue). Each gene body was normalized relative to position percentage within the gene. In contrast to 5hmC (Fig. 1f), the 5mC landscape of A2058-TET2WT cells showed marginal differences between high and normal glucose conditions. b, Total peak numbers for differentially 5-hydroxymethylated regions (DhMRs) when comparing normal glucose to high glucose. We identified 30,217 DhMRs in total, among which the majority (>80%, ~24,537) were increased in normal glucose, whereas <20% were decreased. c, hMeDIP–qPCR validation of DhMRs in a group of cancer-related genes including CHEK1, CENPA, MCM7, CREB3L2, GABPB1 and COBLL1 in A2058-TET2WT cells under high or normal glucose conditions; n = 3 biologically independent repeats. d, Genome-wide distribution of increased DhMRs in annotated genomic regions in A2058-TET2WT cells under normal glucose compared to high glucose. The majority of the DhMRs (65.4%) localized to transcribed gene regions, with 9.56% in promoters and 55.84% in gene bodies. e, Gene ontology (GO, left) and disease ontology (DO, right) analysis of genes (n = 11,475) that had increased DhMRs in A2058-TET2WT cells under normal glucose compared to high glucose. These genes were enriched in pathways related to cancer.
Extended Data Fig. 3 |. Gene ontology and functional disease ontology analysis of genes that were transcriptionally regulated by glucose and TET2.
a, The 585 glucose-modulated and TET2-dependent genes (Fig. 1h) identified in A2058-TET2WT cells were analysed by gene ontology (left) and disease ontology (right). These genes are enriched in cell cycle pathways and are strongly correlated with cancers, including carcinoma, colon cancer, lung cancer and embryoma. b, Detailed disease ontology clustering of the 585 genes showed strong association with various cancer types. c, Two hundred and thirteen out of the 585 genes also had increased DhMRs in normal glucose as compared to high glucose. Further analysis of this gene subset by gene ontology and disease ontology showed that these genes are also highly associated with cell cycle functions and strongly correlated with cancers. d, Of these 213 genes with increased 5hmC and altered gene expression in response to glucose alterations, 124 were upregulated and 89 were downregulated. Consistent with the intricate role of 5hmC in gene regulation, correlation analysis revealed no significant relationship between increased 5hmC and gene upregulation.
Extended Data Fig. 4 |. Purification of full-length TET2 recombinant proteins and determination of TET2 S99 phosphorylation by AMPK.
a, SDS–PAGE gel showing the quality and quantity of recombinant TET2WT, TET2S99A, TET2SLF and TET2S1205A proteins. b, Representation of TET2 S99 phosphorylation levels, as detected by LC–MS/MS after in vitro kinase assay. The peak areas represent the abundance of peptides containing non-phosphorylated S99 (lower lane) or phosphorylated S99 (upper lane). The levels of S99 phosphorylation were much higher after the addition of AMPK in the in vitro kinase assay. c, Various amounts of unphosphorylated or phosphorylated TET2S99 peptides were spotted onto nitrocellulose membrane and detected by purified anti-TET2 pS99 antibody (right) or unpurified whole serum (left). The TET2pS99 antibody specifically recognized phosphorylated S99 peptides. Figures in a–c represent three biologically independent repeats each. d, Quantification of the radioactivity of AMPK phosphorylation. At the end of the phosphorylation assay, 20 μg of full-length Flag–TET2 WT and mutant proteins bound to beads were subjected to measurements by Liquid Scintillation Analyzer. The calculation is based on the specific activity of [γ−32P]ATP (800 c.p.m. per pmol) used and the calculated molar amounts of TET2 added to the assay tube. The stoichiometry is around 0.38 mol phosphates per mole of TET2WT. This number decreases markedly if the TET2 protein is mutated (S99A mutant or SLF mutant, both of which disrupt the AMPK-recognizing consensus sequence). TET2WT and the S1205A mutant had comparably high levels of phosphorylation. n = 3 biologically independent repeats, with data shown as mean ± s.d.
Extended Data Fig. 5 |. Increased AMPK activation, TET2 phosphorylation and TET2 stability in cells cultured with normal glucose.
a, Representations of TET2 S99 phosphorylation levels detected by LC–MS/MS in A2058-TET2WT cells cultured under high (left) or normal glucose (right). Flag–TET2 from A2058-TET2WT cells cultured under normal or high glucose was purified and then subjected to LC–MS/MS analysis. The peak areas represent the abundance of peptides that contained non-phosphorylated S99 (top) or phosphorylated S99 (bottom). The ratio was calculated as area(phosphorylated S99)/(area(phosphorylated S99) + area(non-phosphorylated S99)), which indicated the level of S99 phosphorylation. S99 phosphorylation (TET2pS99) in cells cultured in normal glucose was significantly higher than the phosphorylation levels observed in cells cultured under high glucose. Data are representative of three biologically independent repeats in each condition. b, A2058-TET2WT cells were switched from high to normal glucose for 0, 2 or 4 days. Results showed a steady increase in the levels of pAMPK as well as TET2pS99 and Flag–TET2 during this period. Data are representative of three biologically independent repeats. c, Western blot showing increased levels of TET2pS99 and pAMPK in cell lines (PBMC, HUVEC, TF-1) cultured under normal glucose versus high glucose. Data are representative of three biologically independent repeats. d, Western blot comparison of TET2, TET2pS99, and pAMPK levels between PBMCs from healthy donors and from patients with diabetes. TET2, TET2pS99 and pAMPK levels were significantly higher in healthy donors than in patients. Data are representative of three western blot repeats.
Extended Data Fig. 6 |. Effects of AMPK activators (A769662 and metformin) on TET2 protein stability and 5hmC levels.
a, A2058-TET2WT cells were treated with metformin and then immunoblotted with the indicated antibodies. Metformin treatment increased the levels of pAMPK, TET2pS99 and Flag–TET2. b, A2058-TET2WT cells were treated with 2 μM, 10 μM or 100 μM A769662 (an AMPK activator) for 30 min or 1 h, and then immunoblotted with the indicated antibodies. A769662 treatment increased pAMPK, TET2pS99 and Flag–TET2 levels. c, Quantification of normalized Flag–TET2WT half-life in A2058-TET2WT cells treated with CHX and with (+) or without (−) metformin (5 mM) in Fig. 3f. Metformin treatment increased the half-life of TET2. d, Left, CHX was used to measure the half-life of Flag–TET2 in A2058-TET2WT cells treated with (+) or without (−) A769662 (100 μM) in high glucose. Right, quantification of normalized Flag–TET2WT treated with CHX and with (+) or without (−) A769662. A769662 increased TET2 stability from 42% to 73% at 4 h after CHX treatment. Data in a–d are representative of three biologically independent repeats each. e, hMeDIP–qPCR showed that metformin treatment increased DhMRs to similar levels as observed in normal glucose in the previously validated genes in Extended Data Fig. 2c. n = 3 biologically independent repeats, data shown as mean ± s.d.
Extended Data Fig. 7 |. Effects of AMPK knockdown on 5hmC in cells expressing TET2WT, TET2S99A or TET2S99D.
a, b, Western blot (a) and RT–qPCR (b) to measure TET2 protein and mRNA levels in cells expressing TET2WT, TET2S99A or TET2S99D. TET2S99A has the lowest protein level (a), but it has the highest mRNA level (b) amongst the three cell lines. c, Representations of HPLC–MS/MS analysis of genomic DNA from A2058 cells expressing TET2WT, TET2S99A or TET2S99D with or without AMPK knockdown (AMPK KD) in Fig. 3i. Left, chromatograms of 5hmC in cells expressing TET2WT or mutants with or without AMPK KD. Right, corresponding chromatograms of G. Total cytosine levels were estimated and equalized to the intensities of G. The ratios (right) were calculated as 5hmC intensity/G intensity, which indicated the cellular 5-hydroxymethylation level. 5hmC levels in A2058 cells expressing TET2WT, but not TET2S99A or TET2S99D, were decreased after AMPK KD. d, Comparison of the rescuing effects of calpain inhibitor on TET2WT, TET2S99A and TET2S99D. Data are representative of three biologically independent repeats in a, b, d and three technical repeats in c. Data shown as mean ± s.d.
Extended Data Fig. 8 |. In vitro characterization of the effects of glucose and the AMPK–TET2 axis on tumour suppression.
a. MTS proliferation assay shows that A2058-TET2WT cells grew significantly more slowly under normal glucose than under high glucose, but mock cells showed no difference; n = 5 biologically independent repeats, P = 5.68 × 10⁻⁵. b, TET2 was effectively knocked down (KD) in TF-1 cells, as confirmed by western blot (left) and RT–qPCR (right). c, TF-1 TET2 KD cells exhibited cytokine-independent growth under no cytokines, consistent with a previous report26. d, Proliferation of TF-1 shControl and shTET2 cells treated with high or normal glucose under the indicated cytokine concentrations. TF-1 shControl proliferation was slower under the lower glucose condition, but TF-1 shTET2 cells showed no differential growth rates. P values (from left to right) are 0.0078, 1.94 × 10⁻⁵, 3.21 × 10⁻⁴, 0.0011, and 0.0091. a and d suggest that TET2 is a crucial point through which glucose levels affect tumour growth rates. n = 3 biologically independent repeats in b–d. e, Left, dot blot showing 5hmC levels in A2058-TET2WT, A2058-TET2S99A and mock cells with (+) and without (−) metformin (5 mM) treatment. Right, normalization of n = 5 biologically independent dot blot repeats; P = 0.026. f, MTS proliferation assay of A2058 cells expressing TET2WT, TET2S99A or mock treated with (+) or without (−) metformin (5 mM); n = 5 biologically independent repeats, P = 7.18 × 10⁻⁵. g, h, Soft agar growth of A2058-TET2WT, A2058-TET2S99A and mock cells treated with 0 mM, 2 mM or 4 mM metformin (g) and respective colony counting (h). P = 6.99 × 10⁻⁵ (top), 0.004 (middle), 0.0013 (bottom). i, j, mRNA (i) and protein (j) levels in MDA-MB-231 cells stably expressing mock, TET2WT or TET2S99A. k, l, Soft agar growth (k) and quantification (l) of MDA-MB-231 cells stably expressing mock, TET2WT or TET2S99A; n = 3 biologically independent repeats. The data suggest that TET2WT suppresses anchorage-independent tumour cell growth in vitro. Prevention of TET2 phosphorylation at S99 results in loss of this TET2-mediated suppression. Two-sided Student’s t-test, data shown as mean ± s.d. *P < 0.05, **P < 0.01, ****P < 0.0001.
Extended Data Fig. 9 |. The mouse study paradigm and examination of the regulatory function of the tumour-suppressive glucose–AMPK–TET2 axis in vivo.
a, Division of mice into eight groups. b, Outline of experimental procedure. In brief, nude mice were first induced to develop diabetes, and then transplanted with designated tumour cells. Tumour formation and sizes were documented continuously for three weeks, followed by histological and pathological examination. See more details in Supplementary Information. c, d, Growth curves of A2058-TET2WT and A2058 mock tumours in diabetic (c) and non-diabetic (d) nude mice, with and without metformin treatment. n = 5, P = 0.048 in c; n = 4–5, P = 0.0046 in d. e, f, Comparison between endpoint A2058-TET2WT and mock tumour sizes in diabetic and non-diabetic mice. Mice were treated either with (f) or without (e) metformin, n = 4–5. Tumours from diabetic TET2 groups were significantly larger than that from nondiabetic TET2 groups in both e and f. However, mock groups showed no difference between diabetic or non-diabetic conditions in either e or f. *P = 0.026 (bottom), ***P = 0.00043 (top) in e; **P = 0.0023 (bottom), ***P = 0.00013 (top) in f. g, Western blot showed successful TET2 knock down (A2058-TET2KD cells) in comparison with its TET2WT precursor. Data are representative of three biologically independent repeats. h, Growth curves of A2058-TET2WT and A2058-TET2KD tumours with and without metformin treatment, n = 4–5. The curve indicates that A2058-TET2KD tumours were no longer suppressed by metformin, and grew larger than A2058-TET2WT tumours; *P = 0.031. Two-sided Student’s t-test, data shown as mean ± s.e.m. *P < 0.05, **P < 0.01, ***P < < 0.001, ****P < 0.0001; ns, not significant.
Extended Data Fig. 10 |. 5hmC and pAMPK levels in tumour xenografts after metformin treatment in diabetic and non-diabetic mice.
a, Representative histology of pAMPK IHC staining in mock and A2058-TET2WT tumours treated with (+) or without (−) metformin (200×); pictures represent four different stained slides in each group. b, Representative histology of 5hmC IHC staining in mock and A2058-TET2WT tumours treated with (+) or without (−) metformin (200×); pictures represent four different stained slides in each group. All slides were counterstained with haematoxylin (light blue). c, d, Statistical analyses of the average score of pAMPK and 5hmC staining in mock and A2058-TET2WT tumours treated with or without metformin. Counts were done on 10 random fields in each group. Metformin treatment increased pAMPK in both mock and A2058-TET2WT tumours xenografted into diabetic and non-diabetic mice; ***P = 6.06 × 10⁻⁶ (1), **P = 0.0013 (2), ****P = 1.04 × 10⁻¹¹ (3), ****P = 3.53 × 10⁻⁶ (4). However, metformin increased 5hmC only in A2058-TET2WT tumours in diabetic and non-diabetic mice, with no increase in 5hmC in mock tumours under metformin treatment; **P = 0.0010 (5), **P = 0.028 (6). Box plot: centre lines, median; limits, upper and lower quartiles; top and bottom whiskers, minima and maxima. Two-sided Student’s t-test, data shown as mean ± s.d. *P < 0.05, **P < 0.01, ***P < 0.001, ****P < 0.0001.
Extended Data Table 1 |.
Correlation data analysis of 5hmC in diabetes, glucose/TET2 co-regulated genes and metformin impact on blood glucose
| a | |||||||||||
|---|---|---|---|---|---|---|---|---|---|---|---|
| Correlation between 5hmC and various health parameters. | |||||||||||
| Health Parameters | Beta Coefficient | P-value | |||||||||
| Presence of diabetes | −13.51 | 0.0001 | |||||||||
| BMI | −0.8 | <0.0001 | |||||||||
| Age | −0.51 | <0.0001 | |||||||||
| Systolic blood pressure | −0.33 | 0.007 | |||||||||
| HbAlC | −0.23 | <0.05 | |||||||||
|
b | |||||||||||
| Downregulated in Normal-g vs.High-g | CYB561D1 | FDXl | FAM195A | TACC3 | NUP85 | HSPH1 | HAUS7 | IMPDH1 | ZNF408 | SLC25A19 | |
| GTSE1 | RPL13P5 | CDC73 | PLEKHB2 | SLC25A15 | FOXM1 | ESF1 | NUDT19 | NOP2 | NCAPH | ||
| LSM10 | REX04 | MCM7 | NR3C1 | PDCD7 | C12orf44 | TCOF1 | WASF1 | LYPD1 | PAN3 | ||
| MRPL47 | MRPL35 | HOXB2 | RALA | TIPIN | GNG10 | BRI3BP | NOP14 | RPS27L | TMEM98 | ||
| RINT1 | STOM | SOCS7 | SASS6 | GTF2E2 | ITGAE | Clorfl09 | XP04 | CEP55 | FAM73B | ||
| NME7 | ANKRD33B | DOLPP1 | ORC4 | MRPL46 | WDR77 | EP400 | TMEM201 | TEAD4 | HHEX | ||
| TSR1 | CXorf40A | NIPA2 | EXOl | ZZZ3 | ARMC6 | PNP | GLRX2 | ACOT9 | IQCB1 | ||
| SVIP | UNC119 | KIF14 | GPNMB | HSPA9 | TMEM55B | CRADD | QRICH1 | MFHAS1 | MT1H | ||
| M6PR | RFC4 | SPAG5 | CENPA | C15orf61 | SNRPA1 | GABPB1 | MCM6 | C19orf48 | MAP4K3 | ||
| C5orf30 | BCL2L12 | KIFC1 | LCLAT1 | DSCC1 | BRIX1 | TOMM22 | BUB1B | EXOSC8 | CRY1 | ||
| NSUN5P2 | C10orf32 | RAN | ZNF576 | MY019 | KIAA0101 | ORC6 | NCAPD3 | HOXCIO | C9orf40 | ||
| CHEK1 | PIGU | DSN1 | FGF13 | ACYP1 | OPHN1 | LSG1 | TAF5 | HYI | AMOTL2 | ||
| SHROOM2 | TCEAL8 | MDH1 | DARS2 | CHST10 | C2orf47 | STRA13 | RNF26 | RNASEH2C | EPHA2 | ||
| YRDC | SETD8 | WDR36 | IP05 | ADM | TRMT11 | UBE2C | MRPL15 | RNMTL1 | GLRX5 | ||
| RWDD3 | GADD45A | ANP32B | RAD54L2 | SERTAD2 | ADO | RFC3 | TSNAX | RRS1 | |||
| MTPAP | C16orf80 | H2AFX | PPID | METRNL | KIAA0947 | ZNF330 | Clorfll2 | MCM3 | |||
| MSTOl | CDC5L | FOXD1 | RNF149 | RRP7A | PPP6C | FST | CKS1B | SERTAD1 | |||
| VARS2 | DDX5 | DUS1L | PDRG1 | CCT3 | LRRC58 | DCTPP1 | ANAPC4 | CHKA | |||
| EZR | OSBPL3 | KIAA1033 | Cllorf31 | CENPN | Clorf9 | P2RX5 | CRNKL1 | SUV39H1 | |||
| TFDP1 | DUT | TGS1 | CTCF | LI MAI | NSUN2 | DDX46 | MMGT1 | ABL2 | |||
| MAD2L1BP | CDC45 | UBE2T | CCNB1 | ETF1 | EIF3B | HOXB7 | SRRM1 | HIST1H2BK | |||
| ASNSD1 | UBR7 | BTAF1 | COIL | FLRT3 | CASP7 | CDC26 | TIPARP | POLA1 | |||
| ZNF783 | CKAP2L | PTPLB | PCID2 | ZNF721 | ZC3HC1 | SDC1 | EMP1 | ERCC6L | |||
| COXIO | ARL4A | PPAT | POGK | DHX33 | SRXN1 | RBM25 | NOL11 | POLE2 | |||
| RBM22 | C20orf20 | TYW3 | NUP50 | IRS2 | ZWINT | PAK1IP1 | URM1 | ZNF274 | |||
| PNN | NUBP1 | DNAJB14 | LZIC | TMEM97 | PRIM1 | CDCA3 | BYSL | CDCA5 | |||
| SMC2 | SMNDC1 | UTP20 | SRRM2 | WDR45L | BAZ1A | AGPAT9 | PIGW | ATAD5 | |||
| MPHOSPH10 | MKI67 | ADCY6 | BTBD6 | LIG1 | FLNB | CCNT1 | MSL1 | WDR85 | |||
| CCDC101 | ACBD3 | SHQ1 | DCLRE1A | UQCRFS1 | MYBL2 | FANCI | BLM | C8orf73 | |||
| TIGD5 | NANP | CHERP | NAA40 | POP7 | CPSF7 | POLR3K | PFAS | ATP6V0E2 | |||
| Upregulated in Normal-g vs.High-g | ERCC5 | SERPINB1 | ZCCHC24 | KDM5B | PSIP1 | GLG1 | LGALS1 | NEU1 | PSAP | RASA1 | PPA1 |
| PAN2 | YPEL5 | TNC | PCY0X1 | IMPACT | NES | TULP3 | ETV4 | DHX32 | DYNLT1 | UBAC2 | |
| C3orf32 | RABAC1 | STX18 | RALY | NDUFA9 | SPA17 | SLK | CXXC5 | GTSF1 | MAN2B1 | DNASE2 | |
| PRKCD | BUD13 | MAGED2 | PIGH | CCDC104 | BRMS1 | PLDN | SNX1 | GPX4 | ARAP1 | SF3B14 | |
| SH3BP5 | STOML2 | FAM60A | WDR45 | HEBP1 | ATRN | SPSB2 | SHISA5 | CD97 | NGFRAP1 | ||
| DALRD3 | EMP3 | CALHM2 | PKIG | LDLRAP1 | AP3B1 | SYTL5 | GDE1 | PLA2G12A | RWDD4 | ||
| B4GALT2 | MLKL | APOA1BP | CREBL2 | STX16 | BAX | RDH11 | PIM3 | EIF5A | MECR | ||
| TLCD1 | NRIP1 | COL16A1 | AKR1A1 | GNAI2 | CTSB | PYCRL | GOLGA5 | CCNG1 | PFDN1 | ||
| GGPS1 | PLOD1 | TOR1B | MRC2 | COX17 | NAPRT1 | ZNF512B | PLP1 | KDELR3 | C17orf48 | ||
| MAML2 | SPATA20 | CYBA | POLR2G | UQCRQ | BSG | LHFPL2 | UPRT | IDE | PFDN5 | ||
| TMEM181 | TRIOBP | BLMH | SCO 2 | TAF6 | PREX1 | LOC401397 | POT1 | AMFR | POR | ||
| SPESP1 | C21orf33 | G6PD | LOC645212 | SNX30 | TMEM41B | HAGHL | RALGDS | LEPREL4 | LGALS3 | ||
| ELP4 | RPS6KB2 | KIAA0319L | SLC26A2 | TCF7L2 | PACSIN3 | FAM116A | GTF2A1 | SDHA | CDK5 | ||
| GBAS | HOXA5 | NFU1 | FAF2 | LGALS8 | TSHZ1 | RBL2 | GLT25D1 | GNAQ | MFSD10 | ||
| LOC147727 | NT5E | HAPLN1 | ACADVL | ZYG11B | DCP1A | HIBCH | LAMBI | SH3GLB1 | VPS11 | ||
| SLC39A1 | CEP192 | CKB | KCTD3 | ARL2 | PRKCI | ATG4A | SLC25A6 | TTC13 | HINT2 | ||
| C10orfl25 | TPD52L1 | C6orf70 | SLU7 | DAP | CAB39 | IGF2BP3 | EIF2A | IFI30 | VPS4A | ||
| 0CEL1 | PAPSS2 | S100A3 | SCAMPI | NRAS | CETN3 | EAPP | FAM108C1 | TTC32 | ESYT1 | ||
| CYFIP1 | PPP1CA | MANSC1 | SMYD3 | ABR | BCKDK | IL13RA2 | ATP5A1 | IGBP1 | MLL5 | ||
| BBS2 | MYH10 | ATP6AP1 | CLIP4 | PMVK | TBCE | SCANDI | SLC44A1 | UGGT1 | MGAT4B | ||
| HMGCL | AMOTL1 | PRKAR1A | MYBBP1A | MBTPS1 | RB1CC1 | CD70 | TMEM192 | FAM82A2 | RAB11FIP5 | ||
| FZD7 | SNHG8 | HSD17B8 | HTRA2 | TWF2 | SV2A | ARL6IP5 | DTX3L | PRPSAP2 | KIAA1143 | ||
| OSTF1 | SIDT2 | DECR1 | RFXANK | Clorf85 | TSPAN31 | LOC152217 | LCMT1 | ATG9A | AP2B1 | ||
| C6orfl20 | KIAA1191 | SNX10 | SLC25A46 | C5orf54 | EIF4B | TTC19 | AGGF1 | ZMYND8 | SDHC | ||
| FAM125A | C4orf52 | POLR3GL | MTFMT | ROBOl | BCKDHA | NDRG3 | DHX40 | SRP14 | MTAP | ||
| FKBP2 | SFRP1 | ALKBH6 | ARPC1B | EMD | HADH | VPS29 | FKBP11 | FAM86A | TMEM14C | ||
| COG4 | FAM174A | PTGFRN | ZKSCAN1 | MTR | CBR3 | NDUFB5 | UBE2L6 | NECAP1 | DHX16 | ||
| MXI1 | NFATC2 | MPV17 | KCNN4 | PPP1R7 | GABARAP | EDEM1 | ACVR1 | VPS72 | EPS15 | ||
| FAM114A1 | SH3BGRL3 | PTPN14 | RNF181 | SERINC1 | FADS3 | CRELD2 | LOC642361 | AKR7A2 | HOXB3 | ||
| TCTN3 | RIN1 | C4orf48 | DSG2 | TSPAN14 | COX7A2 | RNF123 | ALDH2 | NT5DC1 | BNIP3 | ||
|
c | |||||||||||
| Status | Tumor | Metformin | Average Blood Glucose (mM) | Status | Tumor | Metformin | Average Blood Glucose (mM) | ||||
| Non-diabetic | TET2 | − | 6.30±0.59 | Diabetic | TET2 | − | 12.94±2.27 | ||||
| TET2 | + | 5.65±0.73 | TET2 | + | 14.16±3.76 | ||||||
| Mock | − | 5.40±0.84 | Mock | − | 14.08±3.49 | ||||||
| Mock | + | 5.60±0.69 | Mock | + | 14.76±2.90 | ||||||
a, Univariate regression analysis showing presence of diabetes, BMI, age, systolic blood pressure, and HbA1c in association with 5hmC. These health parameters, particularly the presence of diabetes and HbA1c, are negatively correlated with 5hmC. n = 28 healthy donors and 29 diabetic patients. Two-sided t-test.
b, Glucose-modulated and TET2 dependent genes. Five hundred and eighty-five genes that are up- or downregulated in normal glucose compared to high glucose in A2058-TET2WT cells are listed. These genes had differential expression under normal glucose versus high glucose in A2058-TET2WT cells only, and not in A2058-TET2M or mock cells. These genes are defined as glucose-modulated and TET2-dependent. Expression profile of these genes is shown in Fig. 1h.
c, Blood glucose levels in diabetic and non-diabetic mice treated with or without metformin. Blood glucose levels were measured on the last day of experiment. Metformin treatment did not alter blood glucose levels in either diabetic or non-diabetic mice. n = 4–5, data shown as mean ± s.d.
Supplementary Material
Acknowledgements
We thank A. Banks for discussions and reading of the manuscript; J. Cai for discussions and technical help; and L. Wang for technical support for PBMC culture. The TET1 antibody was a gift from G. Xu. This work was supported by NIH grants GM112062 and CA194302 to Y.G.S. See Supplementary Information for more details.
Reviewer information Nature thanks G. Hardie, R. Levine and the other anonymous reviewer(s) for their contribution to the peer review of this work.
Footnotes
Competing interests Y.S. is cofounder of Constellation Pharmaceuticals, Inc and a member of its scientific advisory board. All other authors declare no competing financial interests.
Supplementary information is available for this paper at https://doi.org/10.1038/s41586-018-0350-5.
Online content
Any Methods, including any statements of data availability and Nature Research reporting summaries, along with any additional references and Source Data files, are available in the online version of the paper at https://doi.org/10.1038/s41586-018-0350-5.
References
- 1.Nathan DM Long-term complications of diabetes mellitus. N. Engl. J. Med 328, 1676–1685 (1993). [DOI] [PubMed] [Google Scholar]
- 2.Gregg EW et al. Changes in diabetes-related complications in the United States, 1990–2010. N. Engl. J. Med 370, 1514–1523 (2014). [DOI] [PubMed] [Google Scholar]
- 3.Giovannucci E et al. Diabetes and cancer: a consensus report. CA Cancer J. Clin 60, 207–221 (2010). [DOI] [PubMed] [Google Scholar]
- 4.Chowdhury TA Diabetes and cancer. QJM 103, 905–915 (2010). [DOI] [PubMed] [Google Scholar]
- 5.Brower V Illuminating the diabetes-cancer link. J. Natl Cancer Inst 104, 1048–1050 (2012). [DOI] [PubMed] [Google Scholar]
- 6.Baylin SB & Jones PA A decade of exploring the cancer epigenome - biological and translational implications. Nat. Rev. Cancer 11, 726–734 (2011). [DOI] [PMC free article] [PubMed] [Google Scholar]
- 7.Jones PA Functions of DNA methylation: islands, start sites, gene bodies and beyond. Nat. Rev. Genet 13, 484–492 (2012). [DOI] [PubMed] [Google Scholar]
- 8.Ko M, An J & Rao A DNA methylation and hydroxymethylation in hematologic differentiation and transformation. Curr. Opin. Cell Biol 37, 91–101 (2015). [DOI] [PMC free article] [PubMed] [Google Scholar]
- 9.Tahiliani M et al. Conversion of 5-methylcytosine to 5-hydroxymethylcytosine in mammalian DNA by MLL partner TET1. Science 324, 930–935 (2009). [DOI] [PMC free article] [PubMed] [Google Scholar]
- 10.Zhang H et al. TET1 is a DNA-binding protein that modulates DNA methylation and gene transcription via hydroxylation of 5-methylcytosine. Cell Res. 20, 1390–1393 (2010). [DOI] [PubMed] [Google Scholar]
- 11.He YF et al. Tet-mediated formation of 5-carboxylcytosine and its excision by TDG in mammalian DNA. Science 333, 1303–1307 (2011). [DOI] [PMC free article] [PubMed] [Google Scholar]
- 12.Carey BW, Finley LW, Cross JR, Allis CD & Thompson CB Intracellular α-ketoglutarate maintains the pluripotency of embryonic stem cells. Nature 518, 413–416 (2015). [DOI] [PMC free article] [PubMed] [Google Scholar]
- 13.Xu W et al. Oncometabolite 2-hydroxyglutarate is a competitive inhibitor of α-ketoglutarate-dependent dioxygenases. Cancer Cell 19, 17–30 (2011). [DOI] [PMC free article] [PubMed] [Google Scholar]
- 14.Ko M et al. Impaired hydroxylation of 5-methylcytosine in myeloid cancers with mutant TET2. Nature 468, 839–843 (2010). [DOI] [PMC free article] [PubMed] [Google Scholar]
- 15.Lian CG et al. Loss of 5-hydroxymethylcytosine is an epigenetic hallmark of melanoma. Cell 150, 1135–1146 (2012). [DOI] [PMC free article] [PubMed] [Google Scholar]
- 16.Williams K et al. TET1 and hydroxymethylcytosine in transcription and DNA methylation fidelity. Nature 473, 343–348 (2011). [DOI] [PMC free article] [PubMed] [Google Scholar]
- 17.Xu Y et al. Genome-wide regulation of 5hmC, 5mC, and gene expression by Tet1 hydroxylase in mouse embryonic stem cells. Mol. Cell 42, 451–464 (2011). [DOI] [PMC free article] [PubMed] [Google Scholar]
- 18.Hardie DG, Ross FA & Hawley SA AMPK: a nutrient and energy sensor that maintains energy homeostasis. Nat. Rev. Mol. Cell Biol 13, 251–262 (2012). [DOI] [PMC free article] [PubMed] [Google Scholar]
- 19.Hardie DG, Carling D & Carlson M The AMP-activated/SNF1 protein kinase subfamily: metabolic sensors of the eukaryotic cell? Annu. Rev. Biochem 67, 821–855 (1998). [DOI] [PubMed] [Google Scholar]
- 20.de Lange P et al. Fuel economy in food-deprived skeletal muscle: signaling pathways and regulatory mechanisms. FASEB J. 21, 3431–3441 (2007). [DOI] [PubMed] [Google Scholar]
- 21.Zhou G et al. Role of AMP-activated protein kinase in mechanism of metformin action. J. Clin. Invest 108, 1167–1174 (2001). [DOI] [PMC free article] [PubMed] [Google Scholar]
- 22.Cool B et al. Identification and characterization of a small molecule AMPK activator that treats key components of type 2 diabetes and the metabolic syndrome. Cell Metab. 3, 403–416 (2006). [DOI] [PubMed] [Google Scholar]
- 23.Kim N et al. AMPKα2 translocates into the nucleus and interacts with hnRNP H: implications in metformin-mediated glucose uptake. Cell. Signal 26, 1800–1806 (2014). [DOI] [PubMed] [Google Scholar]
- 24.Wang Y & Zhang Y Regulation of TET protein stability by calpains. Cell Reports 6, 278–284 (2014). [DOI] [PMC free article] [PubMed] [Google Scholar]
- 25.Ma S et al. Site-specific phosphorylation protects glycogen synthase kinase-3β from calpain-mediated truncation of its N and C termini. J. Biol. Chem 287, 22521–22532 (2012). [DOI] [PMC free article] [PubMed] [Google Scholar]
- 26.Losman JA et al. (R)-2-hydroxyglutarate is sufficient to promote leukemogenesis and its effects are reversible. Science 339, 1621–1625 (2013). [DOI] [PMC free article] [PubMed] [Google Scholar]
- 27.Pernicova I & Korbonits M Metformin—mode of action and clinical implications for diabetes and cancer. Nat. Rev. Endocrinol 10, 143–156 (2014). [DOI] [PubMed] [Google Scholar]
- 28.Morales DR & Morris AD Metformin in cancer treatment and prevention. Annu. Rev. Med 66, 17–29 (2015). [DOI] [PubMed] [Google Scholar]
- 29.Sander V et al. Role of the N, N′-dimethylbiguanide metformin in the treatment of female prepuberal BALB/c mice hyperandrogenized with dehydroepiandrosterone. Reproduction 131, 591–602 (2006). [DOI] [PubMed] [Google Scholar]
- 30.Green AS et al. LKB1/AMPK/mTOR signaling pathway in hematological malignancies: from metabolism to cancer cell biology. Cell Cycle 10, 2115–2120 (2011). [DOI] [PubMed] [Google Scholar]
Associated Data
This section collects any data citations, data availability statements, or supplementary materials included in this article.


