Abstract
Optical biosensors provide a platform for qualitatively and quantitatively analyzing various biomolecular interactions. In addition to advantages such as label-free and high-throughput detection, these devices are also capable of measuring real-time binding curves in response to changes in optical properties of biomolecules. These kinetic data may be fitted to models to extract binding affinities such as association rates, dissociation rates, and equilibrium dissociation constants. In these biosensors, one of the binding pair is usually immobilized on a solid substrate for capturing the other. Due to the nature of these surface-based methods, mass transport effects and immobilization heterogenetity may cause problems when fitting the kinetic curves with the simple one-to-one Langmuir model. Here real-time binding curves of various antibody-antigen reactions were obtained by using an ellipsometry-based biosensor, and the results were fitted to the simple one-to-one model as well as a more sophisticated approach. The results show that the one-to-two model fitted much better to the curves than the one-to-one model. The two-site model may be explained by assuming two immobilization configurations on the surface. In summary, in fitting real-time curves obtained from optical biosensors, more sophisticated models are usually required to take surface-related issues, such as immobilization heterogenetity and mass transport effects within targets, into account.
Keywords: reaction rates, label-free optical biosensor, biomolecular interaction, Langmuir equation, oblique-incidence reflectivity difference (OI-RD) microscopy
INTRODUCTION
Optical biosensors are important tools in characterizing biomolecular interactions. Recently, various techniques based on surface plasmon resonance (SPR), interference, and ellipsometry have been applied in constructing such devices.[1] Both SPR and ellipsometry measure the changes in refractive index of biomolecules near the sensor surface by plasmon resonance and reflectivity difference, respectively.[2, 3] These biosensors are capable of label-free detection, where no extra fluorescent labeling is required.[4] In addition, they are often designed to operate in a high-throughput manner, where tens to tens of thousands of reactions are monitored in parallel and simultaneously.[5, 6] Most importantly, by following the real-time binding curves, optical biosensors provide information on the kinetic rates between pairs of biomolecules.[7, 8] These reaction rates give better understanding to the underlying binding mechanisms. For example, in characterizing specific protein-binding ligands, traditional fluorescence-based methods provide only end-point, yes-or-no results, yet optical biosensors tell the binding affinities of certain protein-ligand complexes. Besides, thermodynamic properties of a reaction can be obtained by extracting the kinetic parameters in different conditions such as temperature or pH.
In a typical optical biosensor-based experiment, one of the interacting pair, the target, is immobilized on a solid substrate (e.g., glass or silicon wafer). The substrate is specially coated with active chemical groups such as epoxy, amino, or dextran matrix for capturing the target molecules. The other, the probe, is then flowed across the target-covered surface, and the binding signals are recorded versus time as the association phase. In the dissociation phase, the probe solution is replaced with the reaction buffer, and the loss of bound probe molecules is monitored subsequently. To obtain the kinetic constants of a specific probe-target interaction, one can globally fit the binding curves of different probe concentrations with desired models. The most commonly and widely used model is the one-to-one (1:1) Langmuir model, where the association and dissociation phases of a binding curve are fitted to two separate single-exponential equations.[9, 10] However, with this simple model, the reaction rates derived from these surface-based biosensors may be significantly different from those obtained from solution-based methods such as isothermal titration calorimetry (ITC) [11–15] because this model oversimplifies the reaction by assuming that there is only one binding site between a probe and a target and the probe molecules are always near the surface.
In reality, due to the nature of surface-based optical biosensors, there are physical phenomena that need to be addressed. First, mass transport effects may affect the binding kinetics.[16–19] Probe molecules have to diffuse and propagate through bulk solution to reach surface-immobilized target molecules. This can, to some extent, be overcome by continuously flowing fresh solution into the reaction chamber. Moreover, in SPR-based biosensors, three-dimensional dextran matrices are commonly coated in the surface to capture as many target molecules as possible.[20, 21] Mass transport of probe molecules from solution into the three-dimensional structure can also lead to questionable fitting rate constants. Second, immobilization heterogenetity may cause steric hindrance and more complicated interactions between probe and target molecules.[22] Thirdly, if antibodies are reacted with surface antigens, the bivalency of the antibody may be an issue.[23] In the second and third cases, the reactions can be one probe binding to many targets or many probes binding to one target. The simple one-to-one Langmuir model does not fit well in the three conditions mentioned above.[8, 9, 20, 22] Therefore, more sophisticated fitting models, such as one-to-two (1:2), two-to-one (2:1), and mass transport-included one-to-one Langmuir models, are required to obtain accurate reaction rates.[9, 20, 22, 24–26]
In this paper, we report, using a label-free optical biosensor, oblique-incidence reflectivity difference (OI-RD) microscopy to study the kinetics of antibody-antigen reactions. In combination with the microarray platform for surface target immobilization, the OI-RD microscopy has many advantages that include real-time measurements; sensitivity to conformational changes; measurement of up to tens of thousands of biomolecular interactions simultaneously; and compared to surface plasmon resonance- (SPR-) based biosensors, which are limited to metal-coated substrates, OI-RD is suitable for all flat surfaces. The only disadvantage of this approach is that the system is totally customized, meaning that it takes time for users to become familiar with this biosensor. This OI-RD microscope was used to obtain real-time binding curves for being globally fitted to both one-to-one and one-to-two Langmuir models. Clearly, the one-to-two model provided more precise fittings to the real-time data, and the fitting results were explained well by considering immobilization heterogenetity. We concluded that, when using these surface-based optical biosensors, one should be mindful in fitting the kinetic curves, and usually a more complicated model other than the simple one-to-one Langmuir one is required to extract accurate binding affinities.
MATERIALS AND METHODS
Targets And Probes
In the first experiment, vascular endothelial growth factor (Fc-conjugated), kinase insert domain-containing receptor (Fc-conjugated), antibody against vascular endothelial growth factor (anti-vascular endothelial growth factor v-6–2), and antibody against kinase insert domain-containing receptor (anti-kinase insert domain-containing receptor v1) were obtained from Epitomics (Burlingame, CA). Descriptions to these biomolecules were detailed in reference.[27] In the second experiment, biotin-bovine serum albumin, biotin-polyvinyl alcohol, 2, 4-dinitrophenol-bovine serum albumin, and 2, 4dinitrophenol-polyvinyl alcohol of different loadings were synthesized as described in reference.[28] Antibodies against biotin (anti-biotin) and antibody against 2, 4dinitrophenol (anti-2, 4-dinitrophenol) were purchased from Jackson ImmunoResearch Laboratories (West Grove, PA).
Preparation Of Target Microarrays
In the first experiment, vascular endothelial growth factor, kinase insert domain-containing receptor, anti-vascular endothelial growth factor, and anti-kinase insert domain-containing receptor were printed on epoxy-coated glass substrates as microarrays.[27] In the second experiment, the first microarray consisted of 40× biotin-bovine serum albumin, 20× biotin-bovine serum albumin, 10× biotin-bovine serum albumin, 5× biotin-bovine serum albumin, 4% biotin-polyvinyl alcohol, 2% biotin-polyvinyl alcohol, and 1% biotin-polyvinyl alcohol immobilized on epoxy-coated glass substrates.[28] The second microarray consisted of 40× 2, 4-dinitrophenol-bovine serum albumin, 20× 2, 4-dinitrophenol-bovine serum albumin, 10× 2, 4-dinitrophenol-bovine serum albumin, 5× 2, 4-dinitrophenol-bovine serum albumin, 1.5% 2, 4-dinitrophenolpolyvinyl alcohol, and 0.75% 2, 4-dinitrophenol-polyvinyl alcohol immobilized on epoxy-coated glass substrates.
OI-RD Microscopy
The working principles of OI-RD microscopy have been detailed in references.[2, 3, 29, 30] Basically, it measures the changes in reflectivity difference between p- and s-polarized components of a laser beam in response to surface-captured biomolecules. In combination with microarrays, it provides a platform for label-free, real-time, and high-throughput detection of biomolecular interactions with high stability and repeatability.[4–8, 31–36]
Experimental Apparatus and Procedure
After assembly of the fluidic chamber, the microarray-bearing slide was washed with 1× phosphate buffered saline a few times to remove excess unbound target and buffer precipitates. The phosphate buffered saline buffer was replaced with a probe solution at a flow rate of 30 mL/min for few seconds, and then the flow rate was reduced to 0.01 mL/min for a period of time to observe the association phase. For the dissociation phase, the probe solution was replaced with phosphate buffered saline buffer at 30 mL/min followed by 0.01 mL/min flow rate. Mass transport effects in bulk solution could be eliminated by the continuous flow process.
Curve Fitting
The real-time binding curves were globally fitted to the one-to-one and one-to-two Langmuir models where A is the probe in solution, B is the target on the surface, and AB is the reaction complex on the surface, [A] is the concentration of A in (number of molecules)/(solution volume), [B] is the concentration of B in (number of molecules)/(surface area), [AB] is the concentration of AB in (number of molecules)/(surface area), V is the volume of solution, and S is the surface area. With the dynamic on-rate (kon) and dynamic off-rate (koff), the association rate is defined as and the dissociation rate is defined as . In a chemical reaction between A and B,
| (1) |
and by using the conservation of molecules, one obtains
| (2) |
and
| (3) |
After Integrating (2) and (3), one obtains
| (4) |
and
| (5) |
Here, subscript 0 denotes the initial condition, and subscript max denotes the maximum concentration. From (2), the rate equation is:
| (6) |
where the coverage is defined as:
| (7) |
With (6) and (7), (5) can be expressed as:
| (8) |
Under conditions where no mass transport occurs, [A] [A]0, and (8) becomes:
| (9) |
By integrating (9) one obtains and
| (10) |
where θ0 = (0), and
The probe solution is replaced with buffer at t = t0. So from (10), for t ≤ t0, the association phase is:
| (11) |
Also from (10), for t ≥ t0, the dissociation phase is:
| (12) |
(11) and (12) are the equations to the one-to-one Langmuir model.
In the one-to-two Langmuir model, there are two types of targets on the surface. Let γ(1) and γ(2) be the occupation ratios of the first and second types of the surface targets, respectively, (11) and (12) can be reexpressed as:
| (13) |
and
| (14) |
In these two equations, kon(1 or 2) and koff(1 or 2) are the dynamic on-rate and off-rate of the first or second type of targets, respectively.
To fit the real-time curves obtained in OI-RD microscopy, θ(t) and θeq in (11) ~ (14) are simply replaced with the OI-RD signal and the equilibrium OI-RD signal, respectively.
RESULTS AND DISCUSSION
Vascular Endothelial Growth Factor And Kinase Insert Domain-Containing Receptor Measurements.
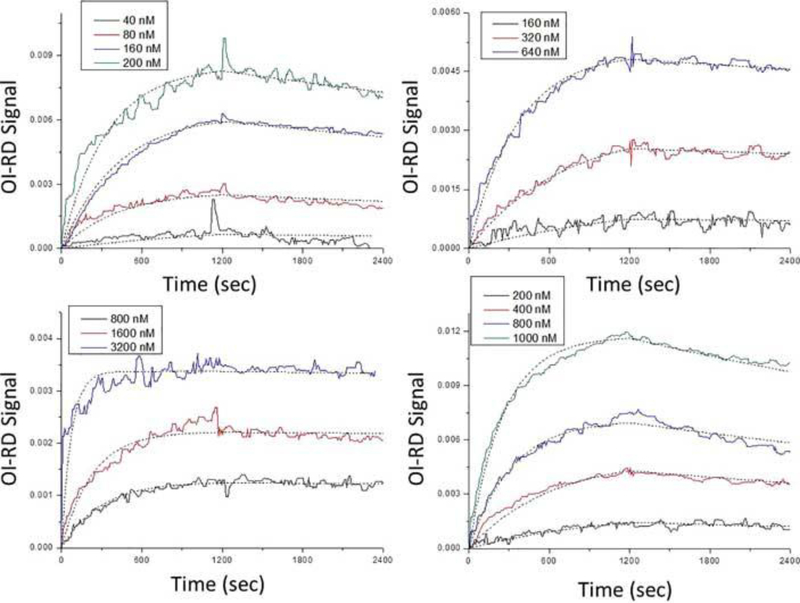
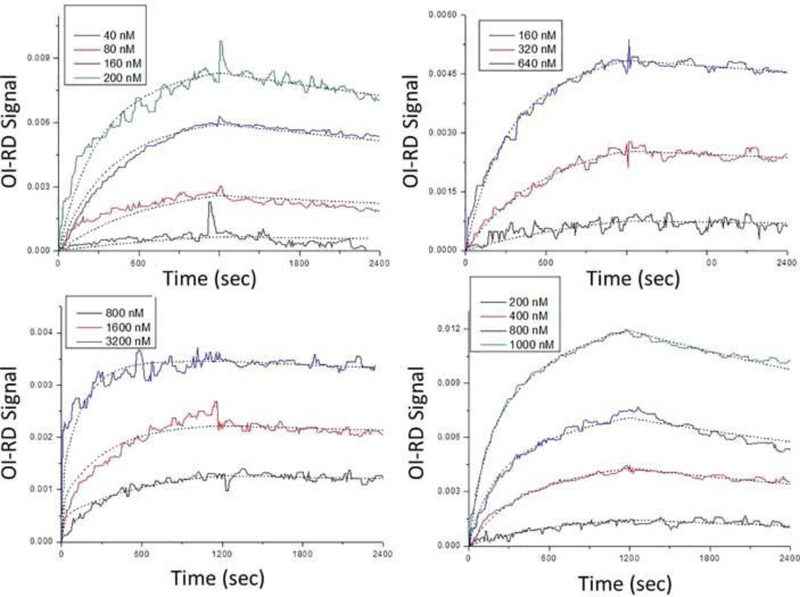
Microarrays consisting of vascular endothelial growth factor, kinase insert domain-containing receptor, anti-vascular endothelial growth factor, and anti-kinase insert domain-containing receptor were reacted with anti-vascular endothelial growth factor, anti-kinase insert domain-containing receptor, vascular endothelial growth factor, and kinase insert domain-containing receptor, respectively, to observe specific antibody-antigen interactions.[27] Probe solutions of different concentrations were used to obtain titrated curves for global fittings: anti-vascular endothelial growth factor solutions of 40, 80, 160, and 200 nM were reacted with surface vascular endothelial growth factor; anti-kinase insert domain-containing receptor solutions of 160, 320, and 640 nM were reacted with surface kinase insert domain-containing receptor; vascular endothelial growth factor solutions of 800, 1600, and 3200 nM were reacted with surface anti-vascular endothelial growth factor; kinase insert domain-containing receptor solutions of 100, 400, 800, and 1000 nM were reacted with surface anti-kinase insert domain-containing receptor. The association and dissociation phases were both monitored for a period of 20 mins.
Figure 1 shows the real-time binding curves of (A) anti-vascular endothelial growth factor to vascular endothelial growth factor, (B) anti-kinase insert domain-containing receptor to kinase insert domain-containing receptor, (C) vascular endothelial growth factor to anti-vascular endothelial growth factor, and (D) kinase insert domain-containing receptor to anti-kinase insert domain-containing receptor reactions. In each panel, the curves were fitted to the one-to-one Langmuir model ((11) and (12)) as shown in dotted lines. All fitting parameters were listed in Table 1. The equilibrium dissociation constants for anti-vascular endothelial growth factor binding to surface vascular endothelial growth factor, vascular endothelial growth factor binding to surface anti-vascular endothelial growth factor, anti-kinase insert domain-containing receptor binding to surface kinase insert domain-containing receptor, and kinase insert domain-containing receptor binding to surface anti-kinase insert domain-containing receptor were derived to be 7.44 nM, 1.89 nM, 10.62 nM, and 38.67 nM, respectively. These values are typical antigen-antibody binding affinities.[37, 38] Differences in equilibrium dissociation constants between antibody binding to surface antigen and antigen binding to surface antibody might be due to target immobilization heterogenetity and/or available epitopes.[27]
Figure 1.
Real-time binding curves and Langmuir one-to-one fittings of (A) Anti-vascular endothelial growth factor reactions with surface vascular endothelial growth factor, (B) anti-kinase insert domain-containing receptor reactions with surface kinase insert domain-containing receptor, (C) vascular endothelial growth factor reactions with surface anti-vascular endothelial growth factor, and (D) kinase insert domain-containing receptor reactions with surface anti-kinase insert domain-containing receptor. Different colors represent different probe concentrations, and dotted lines indicate fittings. All fitting parameters are listed in Table 1.
Table 1.
One-to-one Langmuir fitting parameters to various vascular endothelial growth factor and kinase insert domain-containing receptor reactions.
| Probe | Target | On-rate (nMs)−1 | Off-rate (s)−1 | Equilibrium dissociation constant (nM) |
|---|---|---|---|---|
| Anti-vascular endothelial growth factor | Vascular endothelial growth factor | 1.43×10⁻⁵ | 1.06×10⁻⁴ | 7.44 |
| Vascular endothelial growth factor | Anti-vascular endothelial growth factor | 4.33×10⁻⁶ | 8.38×10⁻⁶ | 1.89 |
| Anti-kinase insert domain-containing receptor | Kinase insert domain-containing receptor | 4.31×10⁻⁶ | 4.59×10⁻⁵ | 10.62 |
| Kinase insert domain-containing receptor | Anti-kinase insert domain-containing receptor | 3.75×10⁻⁶ | 1.45×10⁻⁴ | 38.67 |
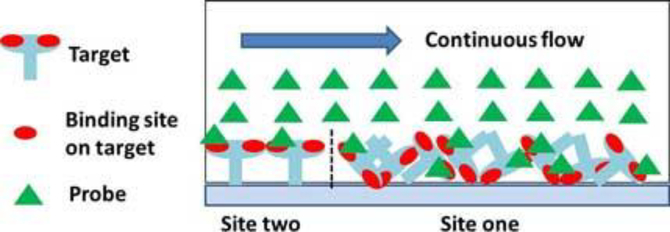
In Figure 2, the same curves were globally fitted to the one-to-two Langmuir model ((13) and (14)) as shown in dotted lines. All fitting parameters including site one occupation ratio were listed in Table 2. Qualitatively, the fittings in Figure 2 are more accurate than those in Figure 1 (for example, 1000 nM and 400 nM curves in panel (D)). Quantitatively, in the case of kinase insert domain-containing receptor binding to surface anti-kinase insert domain-containing receptor, site one and site two had almost equal occupation ratios and affinities (equilibrium dissociation constant ~ 36 nM). In other three cases, site one had much higher occupation ratios (~ 0.8) than site two (~ 0.2). When probes bound to targets at site one, the equilibrium dissociation constants were close to those obtained in one-to-one fittings (8.01 nM for anti-vascular endothelial growth factor binding to surface vascular endothelial growth factor, 1.56 nM vascular endothelial growth factor binding to surface anti-vascular endothelial growth factor, and 12.07 nM anti-kinase insert domain-containing receptor binding to surface kinase insert domain-containing receptor). For bindings occurred in site two, the dynamic off-rates were very small (< 7 × 10⁻⁷ s−1), which in turn resulted in small equilibrium dissociation constants (less than 1 nM). This further indicated that reactions in site two had stronger binding affinities than those in site one. As shown in Figure 3, one possibility was that site-two targets (~ 20% of all targets) provided direct bindings for probes, yet site-one targets (~ 80% of all targets) reacting with probes was somehow affected by mass transport effects within target molecules.
Figure 2.
Real-time binding curves and Langmuir one-to-two fittings of (A) anti-vascular endothelial growth factor reactions with surface vascular endothelial growth factor, (B) anti-kinase insert domain-containing receptor reactions with surface kinase insert domain-containing receptor, (C) vascular endothelial growth factor reactions with surface anti-vascular endothelial growth factor, and (D) kinase insert domain-containing receptor reactions with surface anti-kinase insert domain-containing receptor. Different colors represent different probe concentrations, and dotted lines indicate fittings. All fitting parameters are listed in Table 2.
Table 2.
One-to-two Langmuir fitting parameters to various vascular endothelial growth factor and kinase insert domain-containing receptor reactions.
| Probe | Target | 1 On-rate (nMs)−1 |
1 Off-rate (s)−1 |
1 Equilibrium dissociation constant (nM) |
Site one ratio |
2 On-rate (nMs)−1 |
2 Off- rate (s)−1 |
2 Equilibrium dissociation constant (nM) |
|---|---|---|---|---|---|---|---|---|
| Anti-vascular endothelial growth factor | Vascular endothelial growth factor | 1.90×10⁻⁵ | 1.52×10⁻⁴ | 8.01 | 0.81 | 4.24×10⁻⁶ | <7×10⁻⁷ | <0.17 |
| Vascular endothelial growth factor | Anti-vascular endothelial growth factor | 6.33×10⁻⁵ | 9.88×10⁻⁵ | 1.56 | 0.78 | 1.90×10⁻⁶ | <7×10⁻⁷ | <0.37 |
| Anti-kinase insert Domain-containing receptor | Kinase insert domain-containing receptor | 6.12×10⁻⁶ | 7.39×10⁻⁵ | 12.07 | 0.83 | 1.12×10⁻⁶ | <7×10⁻⁷ | <0.63 |
| Kinase insert domain-containing receptor | Anti-kinase insert Domain-containing receptor | 1.61×10⁻⁶ | 5.73×10⁻⁵ | 35.68 | 0.53 | 9.18×10⁻⁶ | 3.30×10- 4 |
35.93 |
Figure 3.
In the Langmuir one-to-two model, site-two targets provided direct bindings for probes, yet site-one targets reacting with probes was somehow affected by mass transport effects within targets.
Biotin Measurements
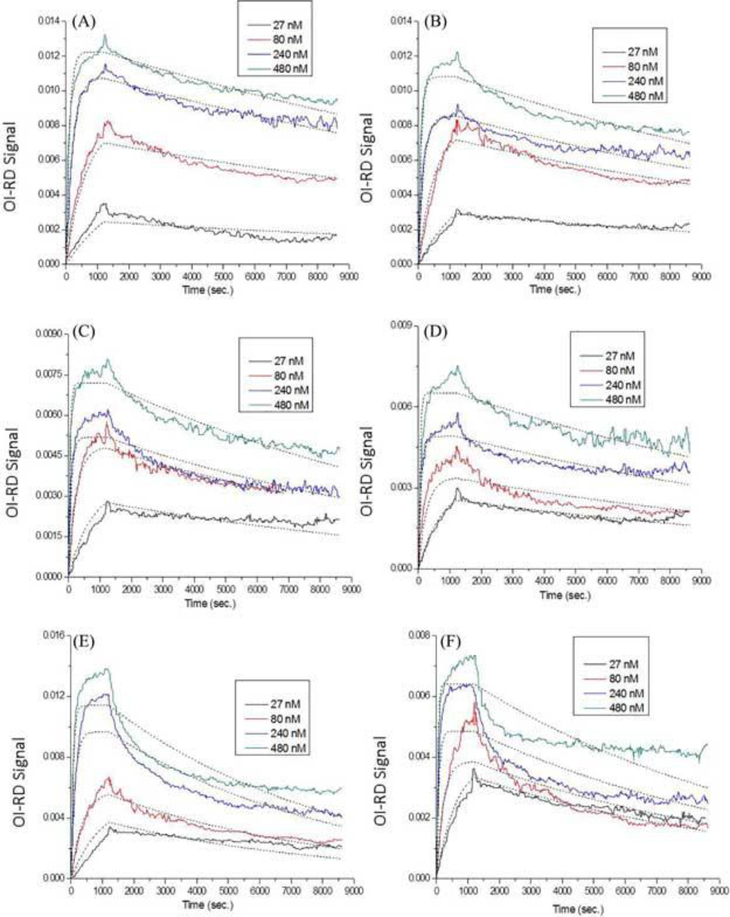
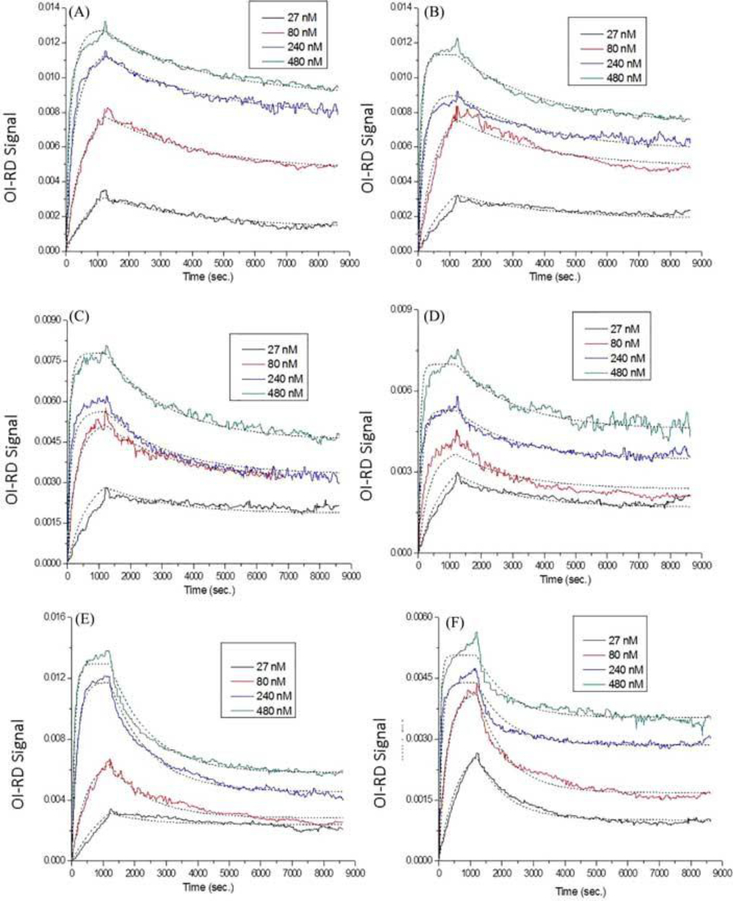
Microarrays consisting of different loadings of biotin-bovine serum albumin and biotin-polyvinyl alcohol were reacted with anti-biotin probes. Figure 4 shows the one-to-one Langmuir fittings to the real-time curves. The titrated probe concentrations used here were 27 nM, 80 nM, 240 nM, and 480 nM. The association and dissociation phased were monitored for periods of 20 mins and 130 mins, respectively. This figure indicated that the dotted lines (a fast association within the first 10 mins + saturation in the following 10 mins) did not fit well to the real binding curves (a very fast association within the first 10 mins + a much slower association in the following 10 mins). In the cases of biotin-polyvinyl alcohol targets, the fittings did not even lie on top of the kinetic curves.
Figure 4.
Real-time binding curves and Langmuir one-to-one fittings of anti-biotin reactions with surface (A) 40× biotin-bovine serum albumin, (B) 20× biotin-bovine serum albumin, (C) 10× biotin-bovine serum albumin, (D) 5× biotin-bovine serum albumin, (E) 4% biotin-polyvinyl alcohol, and (F) 2% biotin-polyvinyl alcohol. Different colors represent different probe concentrations (black: 27 nM; red: 80 nM; blue: 240 nM; green: 480 nM), and dotted lines indicate fittings. All fitting parameters are listed in Table 3.
All fitting parameters were listed in Table 3 with equilibrium dissociation constants for different targets ranging from 0.742 nM to 4.179 nM. These binding affinities could not be accurate due to those bad fittings. As a consequence, the one-to-two Langmuir model was applied to fitting these curves. As shown in Figure 5, the dotted lines fitted well to the real-time curves. All fitting parameters are listed in Table 4. In the cases of biotin-bovine serum albumin conjugates, site-two targets (occupation ratios = 0.6 ~ 0.7) provided high-affinity binding (equilibrium dissociation constants < 0.16 nM) for antibiotin probes, yet site-one targets (occupation ratios = 0.3 ~ 0.4) bound to probes with much lower affinities (equilibrium dissociation constants = 6 nM ~ 32 nM). In Figure 5, the fast (the first 10 mins) and slow (the following 10 mins) associations indicated the site-two and site-one bindings, respectively. This could be explained as a result of immobilization heterogenetity and mass transport effects within targets using Figure 3. In the cases of biotin-polyvinyl alcohol conjugates, since polyvinyl alcohol scaffolds were flexible polymers with a molecular weight of around 13 kDa, they tended to orient themselves randomly when immobilized on glass substrates. Therefore, it was reasonable to allow different γ(1) values for different probe concentrations. For example, in the case of anti-biotin binding to 4% biotin-polyvinyl alcohol, the γ(1) values for probe concentrations of 27 nM, 80 nM, 240 nM, and 480 nM were derived to be 0.16, 0.53, 0.61, and 0.55, respectively. Similarly, site-two targets (equilibrium dissociation constants < 0.09 nM) provided stronger bindings than site-one targets (equilibrium dissociation constants = 22 nM ~ 40 nM) to anti-biotin probes. No preferred majority in site one or site two was found in these biotin-polyvinyl alcohol conjugates.
Table 3.
One-to-one Langmuir fitting parameters to anti-biotin reactions with surface biotin-bovine serum albumin and biotin-polyvinyl alcohol conjugates. The loading was specified by the molar ratio of biotin to bovine serum albumin (40×, 20×, 10×, and 5×) or the percentage of biotin to polyvinyl alcohol (4%, 2%, and 1%).[28]
| Loading | 40× | 2× | 10× | 5× | 4% | 2% | 1% |
|---|---|---|---|---|---|---|---|
| On-rate (nMs)−1×10⁵ | 1.954 | 2.489 | 4.939 | 4.797 | 3.333 | 5.807 | 9.553 |
| Off-rate (s)−1×10⁶ | 4.665 | 5.909 | 7.659 | 6.111 | 13.93 | 10.26 | 7.093 |
| Equilibrium dissociation constant (nM) | 2.387 | 2.374 | 1.551 | 1.274 | 4.179 | 1.767 | 0.742 |
Figure 5.
Real-time binding curves and Langmuir one-to-two fittings of anti-biotin reactions with surface (A) 40× biotin-bovine serum albumin, (B) 20× biotin-bovine serum albumin, (C) 10× biotin-bovine serum albumin, (D) 5× biotin-bovine serum albumin, (E) 4% biotin-polyvinyl alcohol, and (F) 2% biotin-polyvinyl alcohol. Different colors represent different probe concentrations (black: 27 nM; red: 80 nM; blue: 240 nM; green: 480 nM), and dotted lines indicate fittings. All fitting parameters are listed in Table 4.
Table 4.
One-to-two Langmuir fitting parameters to anti-biotin reactions with surface biotin-bovine serum albumin and biotin-polyvinyl alcohol conjugates. The loading was specified by the molar ratio of biotin to bovine serum albumin (40×, 20×, 10×, and 5×) or the percentage of biotin to polyvinyl alcohol (4%, 2%, and 1%).[28]
| loading | 40× | 20× | 10× | 5× | 4% | 2% | 1% |
|---|---|---|---|---|---|---|---|
| 1 On-rate (nMs)−1×10⁵ | 4.87 | 2.10 | 1.53 | 4.12 | 2.25 | 3.67 | 2.46 |
| 1 Off-rate (s)−1×10⁴ | 3.19 | 3.69 | 4.91 | 5.25 | 8.03 | 8.14 | 10.4 |
| 1 Equilibrium dissociation constant (nM) | 6.55 | 17.57 | 32.09 | 12.74 | 35.69 | 22.18 | 40.81 |
| Site one occupation ratio | 0.3 | 0.35 | 0.41 | 0.34 | 0.16 | 0.27 | 0.61 |
| 0.53 | 0.61 | 0.6 | |||||
| 0.61 | 0.58 | 0.35 | |||||
| 0.55 | 0.39 | 0.3 | |||||
| 2 On-rate (nMs)−1×10⁵ | 0.98 | 2.12 | 6.96 | 3.04 | 2.04 | 3.06 | 6.31 |
| 2 Off-rate (s)−1 | <9×10⁻⁷ | <2×10⁻⁶ | <3.6×10⁻⁶ | <4.9×10⁻⁶ | <1.9×10⁻⁶ | <1×10⁻⁶ | <7×10⁻⁷ |
| 2 Equilibrium dissociation constant (nM) | <0.092 | <0.094 | <0.052 | <0.161 | <0.093 | <0.033 | <0.011 |
2,4-Dinitrophenol Measurements
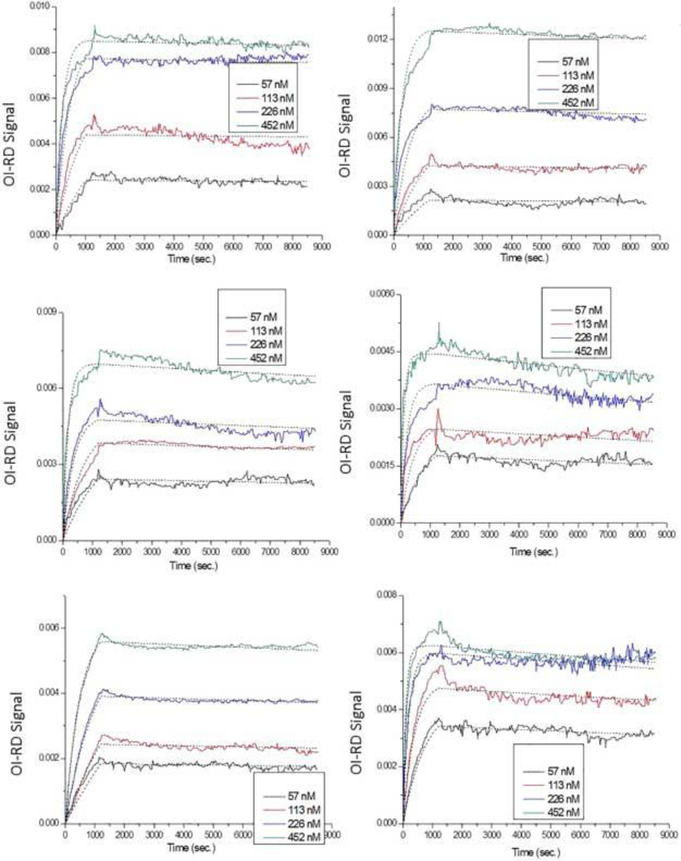
Microarrays consisting of different loadings of 2, 4-dinitrophenol-bovine serum albumin and 2, 4-dinitrophenol-polyvinyl alcohol were reacted with anti-biotin probes. Figure 6 shows the real-time binding curves and Langmuir one-to-one fittings of anti-2, 4dinitrophenol reactions with surface (A) 40× 2, 4-Dinitrophenol-bovine serum albumin, (B) 20× 2, 4-dinitrophenol-bovine serum albumin, (C) 10× 2, 4-dinitrophenol-bovine serum albumin, (D) 5× 2, 4-dinitrophenol-bovine serum albumin, (E) 1.5% 2, 4dinitrophenol-polyvinyl alcohol, and (F) 0.75% 2, 4-dinitrophenol-polyvinyl alcohol. The titrated probe concentrations used here were 57 nM, 113 nM, 226 nM, and 452 nM. The association and dissociation phases were monitored for periods of 20 mins and 130 mins, respectively. Again, except for the 1.5% 2, 4-dinitrophenol-polyvinyl alcohol conjugates, the dotted lines fitted well only in the first 5 to 10 mins of the association phase.
Figure 6.
Real-time binding curves and Langmuir one-to-one fittings of anti-2, 4-dinitrophenol reactions with surface (A) 40× 2, 4-dinitrophenol-bovine serum albumin, (B) 20× 2, 4-dinitrophenol-bovine serum albumin, (C) 10× 2, 4-dinitrophenol-bovine serum albumin, (D) 5× 2, 4-dinitrophenol-bovine serum albumin, (E) 1.5% 2, 4dinitrophenol-polyvinyl alcohol, and (F) 0.75% 2, 4-dinitrophenol-polyvinyl alcohol. Different colors represent different probe concentrations (black: 57 nM; red: 113 nM; blue: 226 nM; green: 452 nM), and dotted lines indicate fittings. All fitting parameters are listed in Table 5.
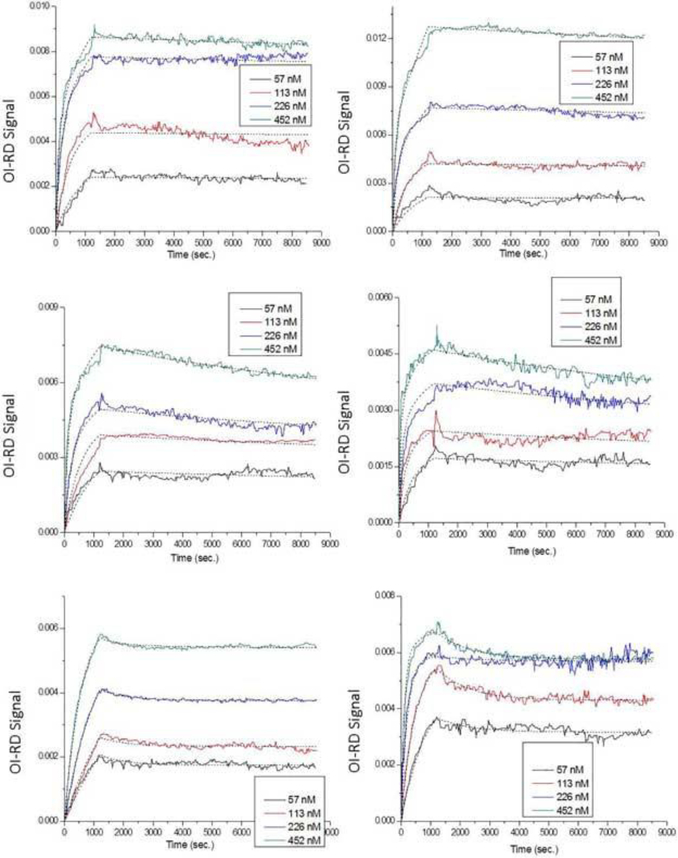
All fitting parameters are listed in Table 5, which showed equilibrium dissociation constants ranging from 0.287 nM to 1.56 nM. These values were in general smaller than those of anti-biotin reactions. This suggested that anti-2, 4-dinitrophenol had a higher binding affinity to surface 2, 4-dinitrophenol than anti-biotin had to surface biotin. However, these values were still not accurate enough for representing the real binding curves. Figure 7 shows the Langmuir one-to-two fitting to the same anti-2, 4dinitrophenol reactions. The dotted lines fitted well to the kinetic curves, especially in the association part. All fitting parameters are listed in Table 6 with the γ(1) variable in 2, 4dinitrophenol-polyvinyl alcohol conjugates. For the 2, 4-dinitrophenol-bovine serum albumin conjugates, site-two targets provided high-affinity bindings (equilibrium dissociation constants < 0.09 nM) to anti-2, 4-dinitrophenol probes, and site-one targets showed much lower affinities (equilibrium dissociation constants = 6 nM ~ 86 nM) to the same probes. There were no preferred majority in site one or site two.
Table 5.
One-to-one Langmuir fitting parameters to anti-2, 4-dinitrophenol reactions with surface biotin-2, 4-dinitrophenol and biotin-2, 4-dinitrophenol conjugates. The loading was specified by the molar ratio of biotin to bovine serum albumin (40×, 20×, 10×, and 5×) or the percentage of biotin to polyvinyl alcohol (4%, 2%, and 1%).[28]
| Loading | 40× | 20× | 10× | 5× | 1.5% | 0.75% |
|---|---|---|---|---|---|---|
| On-rate (nMs)−1×10⁵ | 0.998 | 0.793 | 1.256 | 2.042 | 0.438 | 2.288 |
| Off-rate (s)−1×10⁶ | 2.862 | 5.481 | 9.871 | 19.1 | 6.839 | 12.95 |
| Equilibrium dissociation constant (nM) | 0.287 | 0.691 | 0.786 | 0.935 | 1.56 | 0.566 |
Figure 7.
Real-time binging curves and Langmuir one-to-two fittings of anti-2, 4-dinitrophenol reactions with surface (A) 40× 2, 4-dinitrophenol-bovine serum albumin, (B) 20× 2, 4-dinitrophenol-bovine serum albumin, (C) 10× 2, 4-dinitrophenol-bovine serum albumin, (D) 5× 2, 4-dinitrophenol-bovine serum albumin, (E) 1.5% 2, 4dinitrophenol-polyvinyl alcohol, and (F) 0.75% 2, 4-dinitrophenol-polyvinyl alcohol. Different colors represent different probe concentrations (black: 57 nM; red: 113 nM; blue: 226 nM; green: 452 nM;), and dotted lines indicate fittings. All fitting parameters are listed in Table 6.
Table 6.
One-to-two Langmuir fitting parameters to anti-2, 4-dinitrophenol reactions with surface biotin-2, 4-dinitrophenol and biotin-2, 4-dinitrophenol conjugates. The loading was specified by the molar ratio of biotin to bovine serum albumin (40×, 20×, 10×, and 5×) or the percentage of biotin to polyvinyl alcohol (4%, 2%, and 1%).[28]
| Loading | 40× | 20× | 10× | 5× | 1.5% | 0.75% |
|---|---|---|---|---|---|---|
| 1 On-rate (nMs)−1×10⁶ | 1.76 | 0.19 | 1.23 | 4.19 | 2.34 | 0.46 |
| 1 Off-rate (s)−1×10⁵ | 1.14 | 1.64 | 8.45 | 7.87 | 116 | 96.5 |
| 1 Equilibrium dissociation constant (nM) | 6.48 | 86.32 | 68.70 | 18.78 | 495.7 | 2099 |
| Site one occupation ratio | 0.58 | 0.89 | 0.53 | 0.42 | 0.05 | 0.15 |
| 0.05 | 0.26 | |||||
| 0.06 | 0.03 | |||||
| 0.05 | 0.18 | |||||
| 2 On-rate (nMs)−1×10⁵ | 2.46 | 2.75 | 2.01 | 4.40 | 0.39 | 2.21 |
| 2 Off-rate (s)−1 | <1.4×10⁻⁶ | <1.1×10⁻⁶ | <1.7×10⁻⁶ | <1.7×10⁻⁶ | <3×10⁻⁷ | <1.2×10⁻⁶ |
| 2 Equilibrium dissociation constant (nM) | <0.057 | <0.040 | <0.085 | <0.039 | <0.077 | <0.054 |
In the case of the 2, 4-dinitrophenol-polyvinyl alcohol conjugates, most targets were in the site-two configuration (occupation ratios > 0.94 for 1.5% 2, 4-dinitrophenol-polyvinyl alcohol, and > 0.74 for 0.75% 2, 4-dinitrophenol-polyvinyl alcohol). Targets of this site bound to anti-2, 4-dinitrophenol probes with high affinities (equilibrium dissociation constants < 0.07 nM), while those of the other site (site one) showed very small affinities to the same probes (equilibrium dissociation constant = 496 nM for 1.5% 2, 4dinitrophenol-polyvinyl alcohol, and equilibrium dissociation constant = 2099 nM for 0.75% 2, 4-dinitrophenol-polyvinyl alcohol). Being linear, flexible polymers, polyvinyl alcohol scaffolds oriented to configurations where most of the 2, 4-dinitrophenol molecules were directly available to the anti-2, 4-dinitrophenol probes in the solution.
CONCLUSIONS
Optical biosensors provide a useful platform for label-free and real-time characterization of biomolecular interactions. The binding affinities of specific reactions may be directly derived from globally fitting the kinetic binding curves. These values are important in understanding the underlying reaction mechanisms as well as in screening for high-affinity drugs and ligands. However, due to the nature of these surface-based optical biosensors, the simple one-to-one Langmuir model sometimes does not fit well to the real-time curves. Possible reasons include mass transport effects, immobilization heterogenetity, and the bivalency of the antibody probes. In this article, the one-to-one and one-to-two Langmuir models were used to globally fit various antibody-antigen reactions. The results indicate that the one-to-two model fitted much better to the curves than the one-to-one model did. This two-site model was explained by assuming two immobilization configurations on the surface. We conclude that, in fitting real-time curves obtained from optical biosensors, more sophisticated models are usually required to take surface-related issues, such as immobilization heterogenetity and mass transport effects within targets, into account.
ACKNOWLEDGMENTS
The authors are thankful for financial support from NIH-R01-HG003827 (X.D. Zhu) and Taiwan MOST 105-2112-M-030-002-MY2 (Y.S. Sun).
References
- 1.Sun YS, Optical Biosensors for Label-Free Detection of Biomolecular Interactions. Instrum Sci Technol 2014, 42, (2), 109–127. [Google Scholar]
- 2.Landry JP; Zhu XD; Gregg JP, Label-free detection of microarrays of biomolecules by oblique-incidence reflectivity difference microscopy. Opt Lett 2004, 29, (6), 581–3. [DOI] [PubMed] [Google Scholar]
- 3.Zhu XD, Comparison of two optical techniques for label-free detection of biomolecular microarrays on solids. Opt Commun 2006, 259, (2), 751–753. [Google Scholar]
- 4.Sun YS; Landry JP; Fei YY; Zhu XD, Effect of Fluorescently Labeling Protein Probes on Kinetics of Protein-Ligand Reactions. Langmuir 2008, 24, (23), 13399–13405. [DOI] [PMC free article] [PubMed] [Google Scholar]
- 5.Landry JP; Fei Y; Zhu X; Ke Y; Yu G; Lee P, Discovering small molecule ligands of vascular endothelial growth factor that block VEGF-KDR binding using label-free microarray-based assays. Assay Drug Dev Technol 2013, 11, (5), 326–32. [DOI] [PMC free article] [PubMed] [Google Scholar]
- 6.Landry JP; Fei YY; Zhu XD, Simultaneous Measurement of 10,000 Protein-Ligand Affinity Constants Using Microarray-Based Kinetic Constant Assays. Assay Drug Dev Techn 2012, 10, (3), 250–259. [DOI] [PMC free article] [PubMed] [Google Scholar]
- 7.Fei YY; Schmidt A; Bylund G; Johansson DX; Henriksson S; Lebrilla C; Solnick JV; Boren T; Zhu XD, Use of real-time, label-free analysis in revealing low-affinity binding to blood group antigens by Helicobacter pylori. Anal Chem 2011, 83, (16), 6336–41. [DOI] [PMC free article] [PubMed] [Google Scholar]
- 8.Sun YS; Landry JP; Fei YY; Zhu XD, An Oblique-Incidence Reflectivity Difference Study of the Dependence of Probe-Target Reaction Constants on Surface Target Density Using Streptavidin-Biotin Reactions as a Model. Instrum Sci Technol 2013, 41, (5), 535–544. [Google Scholar]
- 9.Morton TA; Myszka DG; Chaiken IM, Interpreting complex binding kinetics from optical biosensors: a comparison of analysis by linearization, the integrated rate equation, and numerical integration. Anal Biochem 1995, 227, (1), 176–85. [DOI] [PubMed] [Google Scholar]
- 10.Rich RL; Myszka DG, Survey of the year 2005 commercial optical biosensor literature. J Mol Recognit 2006, 19, (6), 478–534. [DOI] [PubMed] [Google Scholar]
- 11.Parker KM; Stalcup AM, Affinity capillary electrophoresis and isothermal titration calorimetry for the determination of fatty acid binding with beta-cyclodextrin. J Chromatogr A 2008, 1204, (2), 171–82. [DOI] [PubMed] [Google Scholar]
- 12.Talhout R; Villa A; Mark AE; Engberts JB, Understanding binding affinity: a combined isothermal titration calorimetry/molecular dynamics study of the binding of a series of hydrophobically modified benzamidinium chloride inhibitors to trypsin. J Am Chem Soc 2003, 125, (35), 10570–9. [DOI] [PubMed] [Google Scholar]
- 13.Krainer G; Broecker J; Vargas C; Fanghanel J; Keller S, Quantifying highaffinity binding of hydrophobic ligands by isothermal titration calorimetry. Anal Chem 2012, 84, (24), 10715–22. [DOI] [PubMed] [Google Scholar]
- 14.O’Shannessy DJ; Brigham-Burke M; Soneson KK; Hensley P; Brooks I, Determination of rate and equilibrium binding constants for macromolecular interactions using surface plasmon resonance: use of nonlinear least squares analysis methods. Anal Biochem 1993, 212, (2), 457–68. [DOI] [PubMed] [Google Scholar]
- 15.Zeder-Lutz G; Altschuh D; Geysen HM; Trifilieff E; Sommermeyer G; Van Regenmortel MH, Monoclonal antipeptide antibodies: affinity and kinetic rate constants measured for the peptide and the cognate protein using a biosensor technology. Mol Immunol 1993, 30, (2), 145–55. [DOI] [PubMed] [Google Scholar]
- 16.Fagerstam LG; Frostell-Karlsson A; Karlsson R; Persson B; Ronnberg I, Biospecific interaction analysis using surface plasmon resonance detection applied to kinetic, binding site and concentration analysis. J Chromatogr 1992, 597, (1–2), 397–410. [DOI] [PubMed] [Google Scholar]
- 17.Kusnezow W; Syagailo YV; Ruffer S; Klenin K; Sebald W; Hoheisel JD; Gauer C; Goychuk I, Kinetics of antigen binding to antibody microspots: strong limitation by mass transport to the surface. Proteomics 2006, 6, (3), 794–803. [DOI] [PubMed] [Google Scholar]
- 18.Schuck P; Minton AP, Analysis of mass transport-limited binding kinetics in evanescent wave biosensors. Anal Biochem 1996, 240, (2), 262–72. [DOI] [PubMed] [Google Scholar]
- 19.Glaser RW, Antigen-antibody binding and mass transport by convection and diffusion to a surface: a two-dimensional computer model of binding and dissociation kinetics. Anal Biochem 1993, 213, (1), 152–61. [DOI] [PubMed] [Google Scholar]
- 20.Karlsson R; Falt A, Experimental design for kinetic analysis of protein-protein interactions with surface plasmon resonance biosensors. J Immunol Methods 1997, 200, (1–2), 121–33. [DOI] [PubMed] [Google Scholar]
- 21.Heding A; Gill R; Ogawa Y; De Meyts P; Shymko RM, Biosensor measurement of the binding of insulin-like growth factors I and II and their analogues to the insulin-like growth factor-binding protein-3. J Biol Chem 1996, 271, (24), 13948–52. [DOI] [PubMed] [Google Scholar]
- 22.Edwards PR; Gill A; Pollard-Knight DV; Hoare M; Buckle PE; Lowe PA; Leatherbarrow RJ, Kinetics of protein-protein interactions at the surface of an optical biosensor. Anal Biochem 1995, 231, (1), 210–7. [DOI] [PubMed] [Google Scholar]
- 23.Karlsson R; Stahlberg R, Surface plasmon resonance detection and multispot sensing for direct monitoring of interactions involving low-molecular-weight analytes and for determination of low affinities. Anal Biochem 1995, 228, (2), 274–80. [DOI] [PubMed] [Google Scholar]
- 24.Rich RL; Cannon MJ; Jenkins J; Pandian P; Sundaram S; Magyar R; Brockman J; Lambert J; Myszka DG, Extracting kinetic rate constants from surface plasmon resonance array systems. Anal Biochem 2008, 373, (1), 112–20. [DOI] [PubMed] [Google Scholar]
- 25.Morton TA; Myszka DG, Kinetic analysis of macromolecular interactions using surface plasmon resonance biosensors. Methods Enzymol 1998, 295, 268–94. [DOI] [PubMed] [Google Scholar]
- 26.Myszka DG, Kinetic analysis of macromolecular interactions using surface plasmon resonance biosensors. Curr Opin Biotechnol 1997, 8, (1), 50–7. [DOI] [PubMed] [Google Scholar]
- 27.Sun YS; Zhu XD, Ellipsometry-Based Biosensor for Label-Free Detection of Biomolecular Interactions in Micro array Format. Sensor Mater 2013, 25, (9), 673–688. [Google Scholar]
- 28.Sun YS; Landry JP; Fei YY; Zhu XD; Luo JT; Wang XB; Lam KS, Macromolecular scaffolds for immobilizing small molecule microarrays in label-free detection of protein-ligand interactions on solid support. Anal Chem 2009, 81, (13), 5373–80. [DOI] [PMC free article] [PubMed] [Google Scholar]
- 29.Landry JP; Gray J; O’Toole MK; Zhu XD, Incidence-angle dependence of optical reflectivity difference from an ultrathin film on solid surface. Opt Lett 2006, 31, (4), 531–3. [DOI] [PubMed] [Google Scholar]
- 30.Zhu XD; Landry JP; Sun YS; Gregg JP; Lam KS; Guo XW, Oblique-incidence reflectivity difference microscope for label-free high-throughput detection of biochemical reactions in a microarray format. Appl Optics 2007, 46, (10), 1890–1895. [DOI] [PMC free article] [PubMed] [Google Scholar]
- 31.Fei Y; Landry JP; Li Y; Yu H; Lau K; Huang S; Chokhawala HA; Chen X; Zhu XD, An optics-based variable-temperature assay system for characterizing thermodynamics of biomolecular reactions on solid support. Rev Sci Instrum 2013, 84, (11), 114102. [DOI] [PMC free article] [PubMed] [Google Scholar]
- 32.Fei YY; Landry JP; Sun YS; Zhu XD; Luo JT; Wang XB; Lam KS, A novel high-throughput scanning microscope for label-free detection of protein and small-molecule chemical microarrays. Rev Sci Instrum 2008, 79, (1), 013708. [DOI] [PMC free article] [PubMed] [Google Scholar]
- 33.Fei YY; Landry JP; Sun YS; Zhu XD; Wang XB; Luo JT; Wu CY; Lam KS, Screening small-molecule compound microarrays for protein ligands without fluorescence labeling with a high-throughput scanning microscope. J Biomed Opt 2010, 15, (1). [DOI] [PMC free article] [PubMed] [Google Scholar]
- 34.Fei YY; Sun YS; Li YH; Lau K; Yu H; Chokhawala HA; Huang SS; Landry JP; Chen X; Zhu XD, Fluorescent labeling agents change binding profiles of glycan-binding proteins. Mol Biosyst 2011, 7, (12), 3343–3352. [DOI] [PMC free article] [PubMed] [Google Scholar]
- 35.Landry JP; Sun YS; Guo XW; Zhu XD, Protein reactions with surfacebound molecular targets detected by oblique-incidence reflectivity difference microscopes. Appl Opt 2008, 47, (18), 3275–88. [DOI] [PMC free article] [PubMed] [Google Scholar]
- 36.Sun YS; Luo JT; Lam KS; Zhu XD, Detection of Formation and Disintegration of Micelles by Oblique-Incidence Reflectivity Difference Microscopy. Instrum Sci Technol 2013, 41, (6), 545–555. [Google Scholar]
- 37.Katsamba PS; Navratilova I; Calderon-Cacia M; Fan L; Thornton K; Zhu M; Bos TV; Forte C; Friend D; Laird-Offringa I; Tavares G; Whatley J; Shi E; Widom A; Lindquist KC; Klakamp S; Drake A; Bohmann D; Roell M; Rose L; Dorocke J; Roth B; Luginbuhl B; Myszka DG, Kinetic analysis of a high-affinity antibody/antigen interaction performed by multiple Biacore users. Anal Biochem 2006, 352, (2), 208–21. [DOI] [PubMed] [Google Scholar]
- 38.Papalia GA; Baer M; Luehrsen K; Nordin H; Flynn P; Myszka DG, High-resolution characterization of antibody fragment/antigen interactions using Biacore T100. Anal Biochem 2006, 359, (1), 112–9. [DOI] [PubMed] [Google Scholar]


