

Abstract
Background
Angiopoietin‐like protein 8 (ANGPTL8) is a hormone that mainly secreted from the liver and adipose tissue and plays an important role in the proliferation of pancreatic beta cells and lipid metabolism. Therefore, we studied the association of ANGPTL8 rs2278426 (C/T) and rs892066 (C/G) polymorphisms with the risk of type 2 diabetes mellitus (T2DM) and their association with biochemical parameters.
Methods
Two hundred and eighty‐eight subjects (controls; n = 138 and type 2 diabetic patients; n = 150) were enrolled in this study. Direct haplotyping was performed using amplification‐refractory mutation system (ARMS)‐RFLP‐PCR.
Results
The CT genotype frequency of rs2278426 (C/T) variant was significantly higher in T2DM patients compared to the controls group (P = 0.02), and there was a significant association between this genotype and increased risk of T2DM (OR: 2.41, CI: 1.26‐4.59, P = 0.007). In addition, there was a significant relationship between CT genotype of this variant and high‐density lipoprotein cholesterol (HDL‐C), fasting blood sugar (FBS), insulin, insulin resistance and glycated hemoglobin (P < 0.05). Furthermore, bioinformatics analysis revealed that arginine (Arg) to tryptophan (Trp) substitution at rs2278426 position causes structural instability of ANGPTL8 protein. Genotype and allele distribution of rs892066 (C/G) was not statistically significant in T2DM patients compared to the control group. The distribution of haplotypes had no significant difference between controls and T2DM patients (P = 0.24).
Conclusion
Our results suggest that the rs2278426 (C/T) variant is associated with increased risk of T2DM and may cause dyslipidemia due to its effect on decreasing HDL‐C levels.
Keywords: ANGPTL8, insulin resistance, polymorphism, rs2278426, type 2 diabetes mellitus
1. INTRODUCTION
Type 2 diabetes mellitus (T2DM) is a common metabolic disorder characterized by hyperglycemia and insulin resistance.1 Studies showed that 425 million people suffered from diabetes in 2017, and this number is estimated to rise to 629 million by 2045.2 The diabetes prevalence in Iran was 9.3% in 2011 and is expected to increase to 13.1% by 2030.3 It seems insulin has an important role in carbohydrate and lipid metabolism, and therefore, insulin resistance caused by T2DM can affect metabolism of these compounds. The increased triglyceride (TG) level and the reduced HDL‐C in T2DM patients suggest that type 2 diabetes is associated with dyslipidemia.4, 5, 6 Meanwhile, insulin resistance caused by T2DM induces excessive division and thus a decrease in pancreatic beta cell mass.7 Therefore, the study of factors involved in beta cell proliferation and lipid metabolism regulation can be effective in controlling diabetes complications.
ANGPTL8 (also known as betatrophin, TD26, IRFL or lipasin) as a member of angiopoietin‐like proteins family is a hormone that mainly expressed in the liver and fat tissue.8 Studies conducted on animal models of insulin resistance show that ANGPTL8 is a potential factor in inducing beta cell proliferation that consequently increase insulin content, islet size, and improved glucose metabolism.9, 10 Several studies have shown that besides the pivotal role in proliferation of beta cells, ANGPTL8 affects the lipid profile through the regulation of very low‐density lipoprotein (VLDL) secretion from the liver, inhibition of lipoprotein lipase activity and interaction with angiopoietin‐like protein 3 (ANGPTL3).11, 12
ANGPTL8 gene (Gene ID: 55908) is located in the corresponding intron of DOCK6 on chromosome 19 open reading frame 80 (c19orf80). Considering the role of ANGPTL8 in the proliferation of pancreatic β‐cells and lipid metabolism, it seems that gene variants of ANGPTL8 are associated with lipid profile and glucose metabolism.13, 14 The rs2278426 (C/T) variant of ANGPTL8 gene results in the substitution of Arg amino acid (C allele) with Trp amino acid (T allele). Previous studies have shown that rs2278426 (C/T) is related to reduced LDL‐C and HDL‐C and increased the FBS level.13, 15, 16 However, a study on African Americans population showed that this variant is associated with a decrease only in HDL‐C.17
Another ANGPTL8 gene variant is rs892066 (C/G), a synonymous sequence variation that substitutes Leu with Leu amino acid. A study on the Kuwaiti population showed that there is no association between rs892066 (C/G) variant and level of HDL‐C and LDL‐C.13
Given the importance role of ANGPTL8 gene and its variants in lipid and glucose metabolism, especially in T2DM patients on the one hand and the paucity of research on the effect of this gene variations on lipid metabolism in Iranian population on the other, we investigated the genotype and allele frequency of rs2278426 (C/T) and rs892066 (C/G) polymorphism and their association with the risk of T2DM development and biochemical parameters in these patients and healthy controls.
2. MATERIALS AND METHODS
2.1. Subjects
Two hundred and eighty‐eight subjects participated in this study, including 150 patients with T2DM (aged 61.32 ± 13.6 years) and 138 age and sex‐matched healthy controls (aged 59.12 ± 10.4 years). They enrolled between 2013 and 2015 from the Diabetes Consulting Center of Imam Hossein Hospital, Hamadan University of Medical Sciences, Iran. T2DM was diagnosed based on American Diabetes Association criteria.18 All patients with gestational diabetes, chronic liver and kidney disorders, malignancy, thyroid diseases and patients receiving insulin were excluded from the present study. Control subjects were selected from among those who referred for laboratory routine tests. Controls had FBS< 100 mg/kg, HbA1c < 5.7% and none of whose first‐degree relatives had diabetes. This study was approved by the Ethics Committee of Hamadan University of Medical Sciences, and informed consent was obtained from all subjects.
2.2. Sample preparation and laboratory measurements
After about 12‐hour fasting, whole blood was collected from all subjects and fractioned into an EDTA‐containing tube and a clot tube. Genomic DNA was extracted from the EDTA‐containing tube using salting out method.19 Lipid profile, including total cholesterol, triglyceride (TG), HDL‐C and FBS were assayed by use of a Hitach‐912 Autoanalyser (Roche, Switzerland) with commercial reagents, calibrators and controls (Pars Azmoon, Tehran, Iran). Low‐density lipoprotein cholesterol (LDL‐C) was calculated according to Friedewald formula. Glycated hemoglobin (HbA1c) was measured using a BioSystems kit (Barcelona, Spain) according to the manufacturer's protocol. Insulin concentration was assayed using an ELISA kit (Monobind Inc, USA), and insulin resistance was calculated according to the homeostatic model assessment (HOMA‐IR) formula [insulin (μU/mL) × glucose (mmol/L)/22.5].20
2.3. Haplotyping
The ARMS‐PCR technique was used for allele separation in position of rs892066 (C/G). ARMS‐PCR reactions were performed using a premix PCR kit (Bioneer, Korea) in two tubes by the following primers: common primer 5′‐ ATTGTGCGGCCATAGAGACC ‐3′, specific primers 5′‐ TGCCTGCTCTGTGCCTGATC ‐3′, and 5′‐ TGCCTGCTCTGTGCCTGATG ‐3′ (one in each tube). The cycling condition was followed after initial denaturation in 95°C for 4 minutes by 30 cycles (95°C for 30 seconds, 58°C for 45 seconds and 72°C for 40 seconds) with a final extension step in 72°C for 7 minutes. Subsequently, 2% agarose gel was used to confirm ARMS‐PCR product (214 bp). The pattern of electrophoresis at this step was such that in case of heterozygotes (CG), the ARMS‐PCR product was observed in both microtubes; while in homozygotes (CC or GG), the product was seen only in one microtube. The products of ARMS‐PCR step (214 bp) were used for rs2278426 (C/T) genotyping by RFLP technique. For this purpose, ARMS‐PCR products were digested with BtsCI restriction enzyme (NEB) and electrophoresed on 3% agarose gel. The electrophoresis pattern was such that one bond (214 bp) was detected for CC genotype, two bonds (171 and 43 bp) for TT, and three bonds (214, 171 and 43 bp) were detected for heterozygote genotype (CT).14
2.4. Bioinformatics analysis
We performed multiple sequence alignment (MSA) to evaluate the sequence conservation using multalin (http://multalin.toulouse.inra.fr/multalin). The effect of rs2278426 (C/T) on protein stability and protein structure was also assessed using PolyPhen‐221 and MUpro server.22 In addition, the linkage disequilibrium (LD) of variants was evaluated by HploReg V4 (http://archive.broadinstitute.org/mammals/haploreg/haploreg.php).
2.5. Statistical analysis
SPSS 16.0 was used for data analysis. Normal distribution of data was evaluated by one‐sample Kolmogorov‐Smirnov test. The quantitative data were presented as mean ± SD or median (interquartile range). The Student t, Mann‐Whitney U and chi‐square tests were used to evaluate the statistical differences between the two groups. The association between genotypes and biochemical factors was analyzed by ANOVA or Kruskal‐Wallis H tests. The logistic regression was used to estimate the relative risk of genotypes. In addition, compatibility of genotype frequency with Hardy‐Weinberg equilibrium was evaluated by chi‐square test. All comparisons were significant when P < 0.05.
3. RESULTS
3.1. Characteristics of the population
Table 1 shows the characteristics of all study population (see supplementary file 1). Based on this table, there was no significant difference between age, sex and BMI in controls and T2DM patients (P > 0.05). In addition, the values of TG and LDL‐C were significantly higher in T2DM patients compared to the control group (P < 0.05) while total cholesterol and HDL‐C concentration did not show any significant difference between the two groups (P > 0.05). On the other hand, the values of insulin, insulin resistance, FBS and HbA1c were significantly higher in T2DM patients compared to the control group (P < 0.001).
Table 1.
Demographic and biochemical characteristics of the T2DM patients and control subjects
| Variables | Controlsa (n = 138) | T2DM patientsa (n = 150) | P |
|---|---|---|---|
| Age (y) | 59.12 ± 10.4b | 61.32 ± 13.6b | 0.12 |
| Sex (Male/Female) | 74/64 | 87/63 | 0.45 |
| BMI (kg/m2) | 27.45 (25.6‐28.96) | 27.4 (25.07‐28.9) | 0.35 |
| LDL (mg/dL) | 94.5 (85‐110) | 103.5 (84.3‐115) | 0.03 |
| HDL (mg/dL) | 42 (39‐47) | 41.5 (38‐46) | 0.12 |
| TG (mg/dL) | 153.94 ± 25.37b | 162.54 ± 33.01b | 0.01 |
| Total cholesterol (mg/dL) | 160 (145‐178) | 160 (143‐186) | 0.47 |
| Fasting blood sugar (mg/dL) | 90 (85.75‐97) | 138 (126.75‐153.25) | 0.000 |
| HbA1c (%) | 4.44 (3.66‐4.96) | 7.92 (7.22‐9.4) | 0.000 |
| Insulin (μ IU/mL) | 5.34 (4.36‐7.12) | 9.32 (8.35‐9.81) | 0.000 |
| HOMA‐IR | 1.14 (0.95‐1.52) | 3.35 (2.87‐4.05) | 0.000 |
BMI, Body Mass Index; HbA1c, glycated hemoglobin; HDL‐C, high‐density lipoprotein cholesterol; HOMA, homeostasis model assessment of insulin resistance; LDL‐C, low‐density lipoprotein cholesterol; TG, Triglycerides.
Data are presented as median (interquartile range).
Result is presented as mean±SD.
3.2. NAGPTL8 rs2278426 (C/T)
The genotype and allele frequency distribution of rs2278426 (C/T) are presented in Table 2. The genotype frequency of rs2278426 (C/T) was compatible with Hardy‐Weinberg equilibrium in both groups (χ2 test, P > 0.05). Distribution of genotypes and alleles of this variant showed a significant difference between the two groups (P < 0.05). The CT genotype frequency in T2DM patients (32.6%) was significantly higher than that in the control subjects (21.73%) (P = 0.02). The binary logistic regression analysis after adjustment for BMI, age and lipid profile revealed that the odds ratio was significantly higher for CT genotype (OR: 2.41, 95% CI: 1.26‐4.59, P = 0.007). In the dominant model, distribution of genotypes between the two groups showed a significant statistical difference (P = 0.01). Furthermore, a logistic regression analysis of this model showed that there is a significant association between the genotype of rs2278426 (C/T) variant and type 2 diabetes (OR: 2.5, 95% CI: 1.26‐4.59, P = 0.004).
Table 2.
The allele and genotype distribution of rs2278426 (C/T) in the T2DM patients and control subjects
| Genotype | Controls (138) | T2DM patients (150) | P a | OR (95% CI)a | P b | OR (95% CI)b |
|---|---|---|---|---|---|---|
| rs2278426 (C/T) | ||||||
| CC | 104 (75.38%) | 92 (61.4%) | 0.03 | |||
| CT | 30 (21.73%) | 49 (32.6%) | 0.02 | 1.84 (1.02‐3.14) | 0.007 | 2.41 (1.26‐4.59) |
| TT | 4 (2.89%) | 9 (6%) | 0.11 | 2.54 (0.75‐8.53) | 0.06 | 3.54 (0.91‐13.77) |
| Recessive model | ||||||
| CC + CT | 134 (97.11%) | 141 (94%) | ||||
| TT | 4 (2.89%) | 9 (6%) | 0.2 | 2.13 (0.74‐7.1) | 0.27 | 2.05 (0.57‐7.36) |
| Dominant model | ||||||
| CT + TT | 34 (24.62%) | 58 (38.6%) | 0.01 | 1.92 (1.16‐3.2) | 0.004 | 2.5 (1.33‐4.71) |
| CC | 104 (75.38%) | 92 (61.4%) | ||||
| Allele | ||||||
| C | 238 (86.23%) | 233 (77.66%) | ||||
| T | 38 (13.77%) | 67 (22.34%) | 0.008 | 1.07 (0.71‐1.61) | ||
P and OR calculated by chi‐square test.
P and OR calculated by logistic regression test after adjustment for Age, BMI and lipid profile.
3.3. The association between rs2278426 (C/T) genotype and biochemical parameters
The biochemical parameters of study population based on the rs2278426 (C/T) genotype are shown in Table 3. Different genotypes of this variant did not show any significant difference in the values of BMI, TG, LDL‐C, and total cholesterol (P > 0.05). However, genotypes of this variant showed a significant difference in HDL‐C level (P = 0.003). Furthermore, fasting blood sugar, HbA1c, insulin, and insulin resistance also showed a significant difference between genotypes (P < 0.05).
Table 3.
Biochemical parameters of ANGPTL8 rs2278426 genotypes in study population
| rs2278426 (C/T) | ||||
|---|---|---|---|---|
| Variables | CC (n = 196) | CT (n = 79) | TT (n = 13) | P a |
| BMI (kg/m2) | 26.74 ± 3.22 | 27.3 ± 2.43 | 27.87 ± 3.85 | 0.23 |
| LDL (mg/dL) | 96.72 ± 21.1 | 100.9 ± 24.99 | 94.03 ± 25.64 | 0.31 |
| HDL (mg/dL) | 44.4 ± 6.99 | 37.84 ± 5.12 | 39.38 ± 7.13 | 0.003 |
| TG (mg/dL) | 157.27 ± 29.79 | 160.63 ± 29.76 | 162.38 ± 32.68 | 0.62b |
| Total cholesterol (mg/dL) | 162.94 ± 27.54 | 160.9 ± 28.29 | 160.15 ± 45.23 | 0.8 |
| Fasting blood sugar (mmol/L) | 6.34 ± 1.61 | 6.99 ± 1.82 | 6.57 ± 1.39 | 0.01 |
| HbA1c (%) | 6.04 ± 2.45 | 7.07 ± 2.62 | 6.46 ± 2.02 | 0.008 |
| Insulin (μ IU/mL) | 7.22 ± 2.37 | 8.19 ± 2.01 | 7.49 ± 1.85 | 0.005 |
| HOMA‐IR | 2.25 ± 1.3 | 2.82 ± 1.36 | 2.46 ± 1.03 | 0.004 |
P calculated by Kruskal‐Wallis H.
P calculated by one‐way ANOVA.
3.4. NAGPTL8 rs892066 (C/G)
The allele frequency and genotype distribution of rs892066 (C/G) in T2DM patients and control subjects are presented in Table 4. The genotype distribution of rs892066 (C/G) was in Hardy‐Weinberg equilibrium in the control group (P > 0.05). The genotype and allele frequency of rs892066 (C/G) was not significantly different between groups (P > 0.05). In addition, in the dominant and recessive models, the groups did not show any significant statistical difference (P > 0.05). Binary logistic regression analysis showed that there was no significant difference in the genotype distribution between controls and T2DM patients (P > 0.05).
Table 4.
The allele and genotype distribution of rs892066 (C/G) in the T2DM patients and control subjects
| Genotype | Controls (138) | T2DM patients (150) | P a | OR (95% CI)a | P b | OR (95% CI)b |
|---|---|---|---|---|---|---|
| rs892066 (C/G) | ||||||
| CC | 92 (66.6%) | 98 (65.3%) | 0.9 | |||
| CG | 38 (27.7%) | 42 (28.1%) | 0.89 | 1.03 (0.61‐1.75) | 0.82 | 0.94 (0.54‐01.61) |
| GG | 8 (5.7%) | 10 (6.6%) | 0.74 | 1.17 (0.44‐3.1) | 0.93 | 0.96 (0.35‐2.63) |
| Recessive model | ||||||
| CC + GC | 130 (94.3%) | 140 (93.4%) | ||||
| GG | 8 (5.7%) | 10 (6.6%) | 0.7 | 1.16 (0.44‐3.03) | 0.9 | 1.01 (0.37‐2.7) |
| Dominant model | ||||||
| GG + GC | 46 (33.4%) | 52 (34.7%) | 0.8 | 1.06 (0.65‐1.72) | 0.84 | 0.94 (0.57‐1.57) |
| CC | 92 (66.6%) | 98 (65.3%) | ||||
| Allele | ||||||
| G | 54 (19.5%) | 62 (20.6%) | ||||
| C | 222 (80.5%) | 238 (79.4%) | 0.74 | 1.07 (0.71‐1.61) | ||
P and OR calculated by chi‐square test.
P and OR calculated by logistic regression test after adjustment for Age, BMI, and lipid profile.
3.5. Bioinformatics analysis of variants
The MSA analysis showed that the sequence of ANGPTL8 is relatively conserved (Figure 1). However, as shown in this figure, the wild‐type allele C of rs2278426 (C/T) is well conserved among the different species. Evaluation of protein structure stability using PolyPhen‐2 database revealed that rs2278426‐T allele probably causes damage to the ANGPTL8 structure (Score: 998, sensitivity: 0.27; specificity: 0.99). Furthermore, MUpro analysis also demonstrated that mutant residue decreases protein stability (confidence score: −0.88). In order to find other variants with strong linkage to rs2278426 and rs892066, haplotype blocks were analyzed (Table 5). There were several variants with high LD (r 2 ≥ 0.9) including rs34692794, rs17699089, rs3760782, rs737337, rs737338, and rs3745683. Among the variants of this block, the rs34692794 polymorphism changes the structure of the Pax‐4 motif that has been shown to regulate pancreas development20 and is therefore linked to diabetes.21, 22, 23 LD block analysis for rs892066 (C/G) demonstrated that rs10406522, rs12979813, rs10421795, rs10421382, and rs6511729 have a strong linkage with this variant (C/G).
Figure 1.
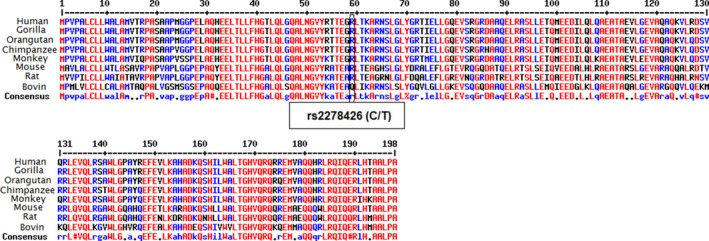
Multiple sequence alignment result for ANGPTL8 sequence in different organism. The ANGPTL8 sequence is partially conserved but rs2278426 (C/T) position is highly conserved between different species
Table 5.
Variants that have strong linkage (r 2 ≥ 0.9) to ANGPTL8 rs2278426 and rs892066 (C/G)
| Polymorphism | Position (hg38) | R 2 | D’ | Linked variant | Motif changed | GENCOD gene |
|---|---|---|---|---|---|---|
| rs2278426 (C/T) | Chr19: 11232871 | 0.92 | 0.98 | rs34692794 | Glis2, Pax‐4, Zfp740 | DOCK6 |
| Chr19: 11233119 | 0.94 | 0.97 | rs17699089 | RBP‐Jkappa, Znf143 | DOCK6 | |
| Chr19: 11224801 | 0.91 | 0.98 | rs3760782 | 17 altered motifs | DOCK6 | |
| Chr19: 11236817 | 0.91 | 0.98 | rs737337 | ‐ | DOCK6 | |
| Chr19: 11236981 | 0.92 | 0.98 | rs737338 | ‐ | DOCK6 | |
| Chr19: 11237845 | 0.93 | 0.98 | rs3745683 | RXRa | DOCK6 | |
| rs892066 (C/G) | Chr19: 11230959 | 0.9 | 0.98 | rs10406522 | CTCF, Rad21 | DOCK6 |
| Chr19: 11232027 | 0.9 | 0.98 | rs12979813 | ‐ | DOCK6 | |
| Chr19: 11233730 | 0.93 | 0.98 | rs10421795 | EBF, LUN‐1 | DOCK6 | |
| Chr19: 11234297 | 0.9 | 0.98 | rs10421382 | HP1‐site‐factor, Mef2, Zfp105 | DOCK6 | |
| Chr19: 11235576 | 0.94 | 0.98 | rs6511729 | EBF, SP1 | DOCK6 |
3.6. The rs2278426 (C/T) and rs892066 (C/G) haplotype
Based on the direct haplotyping technique results, nine haplotypes were detected in this study (Table 6). Haplotype distribution analysis showed that there was no significant difference in distribution of haplotypes between the two groups (P = 0.24).
Table 6.
Two allele haplotype distribution of rs2278426 (C/T) and rs892066 (C/G) in the T2DM patients and control subjects
| Haplotype | Controls (n = 138) | T2DM patients (n = 150) | P |
|---|---|---|---|
| CC/CC | 76 (55.1%) | 62 (41.3%) | 0.24 |
| CC/CG | 25 (18.1%) | 25 (16.7%) | |
| CC/TC | 14 (10.1%) | 31 (20.7%) | |
| CC/TG | 12 (8.7%) | 14 (9.3%) | |
| CG/CG | 3 (2.2%) | 5 (3.3%) | |
| CG/TG | 4 (2.9%) | 4 (2.7%) | |
| TC/TC | 2 (1.4%) | 5 (3.3%) | |
| TC/TG | 1 (0.7%) | 3 (2%) | |
| TG/TG | 1 (0.7) | 1 (0.7%) |
4. DISCUSSION
ANGPTL8 protein is a hormone that mainly secreted from the liver and adipose tissue.17 There is plenty of evidence that ANGPTL8 has an important role in pancreatic β‐cells proliferation and lipid metabolism.23 In this study, we aimed to investigate the association between the rs2278426 and rs892066 variant of ANGPTL8 gene and T2DM and their relationship with biochemical parameters in these patients.
The present study showed that there is a significant difference in distribution of genotypic and allelic frequency of ANGPTL8 rs2278426 (C/T) polymorphism between T2DM patients and healthy controls. In addition, our results showed that subjects with CT genotype compared to other genotypes are more susceptible to develop T2D. That is, in subjects carrying CT genotype, the values of FBS, insulin, HbA1c, and insulin resistance were significantly higher than in those carrying CC and TT genotypes. The present study also showed that in subjects with CT genotype compared to those carrying CC and TT genotypes, the level of HDL‐C was significantly lower. On the other hand, there is showed that distribution of the genotypes and alleles of ANGPTL8 rs892066 (C/G) polymorphism had no association with biochemical factors of study subjects. In addition, the distribution of two‐allele haplotypes between T2DM patients and controls was not statistically significant.
Previous studies on nondiabetic people have shown that there is a relationship between ANGPTL8 rs2278426 (C/T) polymorphism and lipid profile. In the Dallas Heart Study as a multiethnic study, results showed that in the African American and Hispanic population, T allele of rs2278426 (C/T) caused a significant decrease in levels of HDL‐C and LDL‐C.15 However, no association was found between this allele with LDL‐C and HDL‐C in European‐American population. In another study on participants in the Atherosclerosis Risk in Communities Study (ARIC), it was shown that in European American participants, the T allele was associated only with decrease in HDL‐C.15 In addition, Hanson et al24 revealed that T allele of rs2278426 (C/T) variant is associated with decreased levels of total cholesterol and HDL‐C in Pima Indians and Mexican Americans.
Abu‐Farha et al13 studied the relationship between ANGPTL8 rs2278426 (C/T) variant and glucose level in nondiabetic Arab population. Consistent with our results, their study demonstrated that the level of FBS in subjects with CT genotype was significantly higher than those carrying CC genotype. On the other hand, there was no significant relationship between this variant and HDL‐C and LDL‐C.
There is a disparity between reported results about ANGPTL8 rs2278426 (C/T) polymorphism and biochemical factors, which is mainly due to the differences in the race of the studied populations. In this regard, Guo et al14 showed that differences in race can affect allelic and genotypic frequency of ANGPTL8 rs2278426 (C/T) and also their relationship with other biochemical parameters.
The current study demonstrated that CT heterozygote genotype of rs2278426 (C/T) might be associated with reducing HDL‐C levels. The molecular mechanism of this association is unknown. Previous studies have shown that ANGPTL3 inhibits the lipoprotein lipase (LPL) activity.25, 26, 27 In addition, another study showed that inactivation of ANGPTL3 causes a significant reduction in HDL‐C level.28 Therefore, it can be concluded that ANGPTL3 activity is necessary for HDL‐C biogenesis. Quagliarini et al15 demonstrated that ANGPTL3 activity required its interaction with ANGPTL8. Therefore, it is possible that any factor interfering with this interaction can decrease HDL‐C level.
Arg replacement with Trp caused by rs2278426 polymorphism, firstly reduces the ANGPTL8 protein charge and possibly its interaction with other proteins, and secondly the mutant residue which is bigger might lead to bumps and reduction in ANGPTL8 stability.21, 22 Overall, our hypothesis is that this variant probably affects the interaction of ANGPTL8 with ANGPTL3 and thus reduces HDL‐C levels. However, elucidation of this issue requires further investigation. One of the important factors involved in the phenotypic manifestation of gene variants is LD with other casual variants. Bioinformatics analysis in the present study demonstrated that several variants including rs34692794, rs17699089, rs3760782, rs737337, rs737338, and rs3745683 had a high LD with ANGPTL8 rs2278426 variant. Cannon et al29 demonstrated that rs3760782, rs737338, and rs3745683 are associated with decreased levels of HDL‐C. Therefore, it is possible that the association between rs2278426 polymorphism with decreased HDL‐C in the Iranian population is related to LD with these variants.
Another interesting point in our results was that there was a significant association between the heterozygote genotype and the increased risk of T2DM, while there was no such association with mutant homozygote. This could be due to the low frequency of homozygous mutant genotypes, and it is likely that by increasing the sample size, a similar association would be observed in homozygous mutants.
The present study further highlights that ANGPTL8 gene may be involved in glucose metabolism in Iranian population. That is, CT heterozygote genotype of rs2278426 (C/T) polymorphism had higher levels of FBS, HbA1c, insulin, and insulin resistance compared to CC and TT genotypes. In the other word, CT genotype is associated with the risk factors of T2DM. Abu‐Farha et al13 study on nondiabetic population revealed that FBS level in subjects with the CT genotype of rs2278426 variant compared to those carrying CC genotype is significantly higher. Another study by Quagliarini et al15 reported that in Hispanic participant subjects of Dallas heart study (DHS), those carrying TT genotype of rs2278426 variant had higher significantly FBS level than subjects with CC homozygote genotype. These results suggested that heterozygote (CT) and homozygote mutant (TT) of rs2278426 variant are associated with the increased level of FBS. The mechanism of this association is unknown. Previous studies have shown that in T2D condition, increased levels of glucose caused increase the levels of HbA1c and insulin.30, 31 Therefore, it is likely that the association between CT genotype of rs2278426 variant with HbA1c, insulin, and insulin resistance was related to the effect of this genotype on the FBS level. The relationship between the CT genotype and insulin resistance is also debatable from another aspect. One of the compensating responses to insulin resistance condition is an increase in the number and activity of pancreatic β‐cells.32, 33 Accordingly, interfering factors in the process of beta cell proliferation can exacerbate insulin resistance. Bioinformatics analysis in the current study demonstrated that rs2278426 (C/T) has a strong linkage with rs34692794 variant that itself changes the binding site of Pax‐4. Previous studies showed that Pax‐4 is a conserved transcription factor that mainly expressed in the pancreas and play an important role in the generation of insulin producing β‐cells.34, 35, 36, 37 Therefore, it is possible that impaired function of this transcript factor causes insulin resistance and increases the risk of T2DM. Altogether, it can be hypothesized that the association of CT genotype of rs2278426 variant with insulin resistance condition is related to its strong linkage with the rs34692794 casual variant.
The present study showed that there is no significant difference in the genotypic frequency of ANGPTL8 rs892066 polymorphism between T2DM patients and control subjects. Abu‐Farha et al13 also demonstrated that different genotypes rs892066 variant have no significant differences in HDL‐C, LDL‐C, FBS, and total cholesterol. The LD of this variant with other variants was also evaluated. None of these linked variants were associated with the biochemical factors. As this variant causes a synonymous substitution, the effect of this variant on ANGPTL8 structure and function is unexpected. Finally, there are no significantly differences in two‐allele haplotypes of rs2278426 and rs892066 variants between T2DM patients and controls. Therefore, it can be concluded that there is no linkage between these two variants.
5. CONCLUSION
The findings of our study demonstrated that ANGPTL8 rs2278426 (C/T) polymorphism is associated with increased risk of T2DM and decreased HDL‐C level. The mechanism of this association is unclear and may be due to the effect of this variant on the protein function or the strong linkage of this variant with causative variants.
ETHICAL STATEMENT
All procedures performed in studies involving human participants were in accordance with the ethical standards of the Ethics Committee of Hamadan University of Medical Sciences and with the Helsinki declaration.
Supporting information
ACKNOWLEDGMENTS
This study was supported by a grant from Vice Chancellor of Research of Hamadan University of Medical Sciences (grant number: 9304171911). We thank all the volunteers participating in this study.
Ghasemi H, Karimi J, Khodadadi I, Saidijam M, Tavilani H. Association between rs2278426 (C/T) and rs892066 (C/G) variants of ANGPTL8 (betatrophin) and susceptibility to type2 diabetes mellitus. J Clin Lab Anal. 2019;33:e22649 10.1002/jcla.22649
REFERENCES
- 1. Tuomi T, Santoro N, Caprio S, Cai M, Weng J, Groop L. The many faces of diabetes: a disease with increasing heterogeneity. Lancet. 2014;383(9922):1084‐1094. [DOI] [PubMed] [Google Scholar]
- 2. Aynalem SB, Zeleke AJ. Prevalence of diabetes mellitus and its risk factors among individuals aged 15 years and above in Mizan‐Aman Town, Southwest Ethiopia, 2016: a cross sectional study. Int J Endocrinol. 2018;2018:9317987. [DOI] [PMC free article] [PubMed] [Google Scholar]
- 3. Whiting DR, Guariguata L, Weil C, Shaw J. IDF diabetes atlas: global estimates of the prevalence of diabetes for 2011 and 2030. Diabetes Res Clin Pract. 2011;94(3):311‐321. [DOI] [PubMed] [Google Scholar]
- 4. Taskinen M‐R. Type 2 diabetes as a lipid disorder. Curr Mol Med. 2005;5(3):297‐308. [DOI] [PubMed] [Google Scholar]
- 5. Garvey WT, Kwon S, Zheng D, et al. Effects of insulin resistance and type 2 diabetes on lipoprotein subclass particle size and concentration determined by nuclear magnetic resonance. Diabetes. 2003;52(2):453‐462. [DOI] [PubMed] [Google Scholar]
- 6. Krentz AJ. Lipoprotein abnormalities and their consequences for patients with type 2 diabetes. Diabetes Obes Metab. 2003;5(Suppl 1):S19‐S27. [DOI] [PubMed] [Google Scholar]
- 7. Meier JJ, Bonadonna RC. Role of reduced β‐cell mass versus impaired β‐cell function in the pathogenesis of type 2 diabetes. Diabetes Care. 2013;36(Suppl 2):S113‐S119. [DOI] [PMC free article] [PubMed] [Google Scholar]
- 8. Ren G, Kim JY, Smas CM. Identification of RIFL, a novel adipocyte‐enriched insulin target gene with a role in lipid metabolism. Am J Physiol Endocrinol Metab. 2012;303(3):E334‐E351. [DOI] [PMC free article] [PubMed] [Google Scholar]
- 9. Rahier J, Guiot Y, Goebbels R, Sempoux C, Henquin J‐C. Pancreatic β‐cell mass in European subjects with type 2 diabetes. Diabetes Obes Metab. 2008;10(Suppl 4):32‐42. [DOI] [PubMed] [Google Scholar]
- 10. Yi P, Park J‐S, Melton DA. Betatrophin: a hormone that controls pancreatic β cell proliferation. Cell. 2013;153(4):747. [DOI] [PMC free article] [PubMed] [Google Scholar] [Retracted]
- 11. Zhang R. Lipasin, a novel nutritionally‐regulated liver‐enriched factor that regulates serum triglyceride levels. Biochem Biophys Res Comm. 2012;424(4):786‐792. [DOI] [PubMed] [Google Scholar]
- 12. Zhang R, Abou‐Samra AB. Emerging roles of Lipasin as a critical lipid regulator. Biochem Biophys Res Comm. 2013;432(3):401‐405. [DOI] [PubMed] [Google Scholar]
- 13. Abu‐Farha M, Melhem M, Abubaker J, Behbehani K, Alsmadi O, Elkum N. ANGPTL8/Betatrophin R59W variant is associated with higher glucose level in non‐diabetic Arabs living in Kuwaits. Lipids Health Dis. 2016;15(1):26. [DOI] [PMC free article] [PubMed] [Google Scholar]
- 14. Guo T, Yin RX, Wu J, et al. Association of the angiopoietin‐like protein 8 rs2278426 polymorphism and several environmental factors with serum lipid levels. Mol Med Rep. 2015;12(3):3285‐3296. [DOI] [PMC free article] [PubMed] [Google Scholar]
- 15. Quagliarini F, Wang Y, Kozlitina J, et al. Atypical angiopoietin‐like protein that regulates ANGPTL3. Proc Natl Acad Sci. 2012;109(48):19751‐19756. [DOI] [PMC free article] [PubMed] [Google Scholar]
- 16. Weissglas‐Volkov D, Aguilar‐Salinas CA, Nikkola E, et al. Genomic study in Mexicans identifies a new locus for triglycerides and refines European lipid loci. J Med Genet. 2013;50:298‐308. [DOI] [PMC free article] [PubMed] [Google Scholar]
- 17. Zhang R, Abou‐Samra AB. A dual role of lipasin (betatrophin) in lipid metabolism and glucose homeostasis: consensus and controversy. Cardiovasc Diabetol. 2014;13(1):133. [DOI] [PMC free article] [PubMed] [Google Scholar]
- 18. American Diabetes Association . Diagnosis and classification of diabetes mellitus. Diabetes Care. 2014;37(Suppl 1):S81‐S90. [DOI] [PubMed] [Google Scholar]
- 19. Miller S, Dykes D, Polesky H. A simple salting out procedure for extracting DNA from human nucleated cells. Nucleic Acids Res. 1988;16(3):1215. [DOI] [PMC free article] [PubMed] [Google Scholar]
- 20. Katsuki A, Sumida Y, Gabazza EC, et al. Homeostasis model assessment is a reliable indicator of insulin resistance during follow‐up of patients with type 2 diabetes. Diabetes Care. 2001;24(2):362‐365. [DOI] [PubMed] [Google Scholar]
- 21. Adzhubei I, Jordan DM, Sunyaev SR. Predicting functional effect of human missense mutations using PolyPhen‐2. Curr Protoc Hum Genet. 2013;Chapter 7:Unit 7.20. [DOI] [PMC free article] [PubMed] [Google Scholar]
- 22. Cheng J, Randall A, Baldi P. Prediction of protein stability changes for single‐site mutations using support vector machines. Proteins: Struct, Funct, Bioinf. 2006;62(4):1125‐1132. [DOI] [PubMed] [Google Scholar]
- 23. Musunuru K, Pirruccello JP, Do R, et al. Exome sequencing, ANGPTL3 mutations, and familial combined hypolipidemia. N Engl J Med. 2010;363(23):2220‐2227. [DOI] [PMC free article] [PubMed] [Google Scholar]
- 24. Hanson RL, Leti F, Tsinajinnie D, et al. The Arg59Trp variant in ANGPTL8 (betatrophin) is associated with total and HDL‐cholesterol in American Indians and Mexican Americans and differentially affects cleavage of ANGPTL3. Mol Genet Metab. 2016;118(2):128‐137. [DOI] [PMC free article] [PubMed] [Google Scholar]
- 25. Lee E‐C, Desai U, Gololobov G, et al. Identification of a new functional domain in angiopoietin‐like 3 (ANGPTL3) and angiopoietin‐like 4 (ANGPTL4) involved in binding and inhibition of lipoprotein lipase (LPL). J Biol Chem. 2009;284(20):13735‐13745. [DOI] [PMC free article] [PubMed] [Google Scholar]
- 26. Shimizugawa T, Ono M, Shimamura M, et al. ANGPTL3 decreases very low density lipoprotein triglyceride clearance by inhibition of lipoprotein lipase. J Biol Chem. 2002;277(37):33742‐33748. [DOI] [PubMed] [Google Scholar]
- 27. Shan L, Yu X‐C, Liu Z, et al. The angiopoietin‐like proteins ANGPTL3 and ANGPTL4 inhibit lipoprotein lipase activity through distinct mechanisms. J Biol Chem. 2009;284(3):1419‐1424. [DOI] [PMC free article] [PubMed] [Google Scholar]
- 28. Shimamura M, Matsuda M, Yasumo H, et al. Angiopoietin‐like protein3 regulates plasma HDL cholesterol through suppression of endothelial lipase. Arterioscler Thromb Vasc Biol. 2007;27(2):366‐372. [DOI] [PubMed] [Google Scholar]
- 29. Cannon ME, Duan Q, Wu Y, et al. Trans‐ancestry Fine Mapping and Molecular Assays Identify Regulatory Variants at the ANGPTL8 HDL‐C GWAS Locus. G3: Genes, Genomes . Genetics. 2017;7(9):3217‐3227. [DOI] [PMC free article] [PubMed] [Google Scholar]
- 30. Sherwani SI, Khan HA, Ekhzaimy A, Masood A, Sakharkar MK. Significance of hba1c test in diagnosis and prognosis of diabetic patients. Biomark Insights. 2016;11:95. [DOI] [PMC free article] [PubMed] [Google Scholar]
- 31. Kahlon AS, Pathak R. Patterns of glycemic control using glycosylated hemoglobin in diabetics. J Pharm Bioallied Sci. 2011;3(3):324. [DOI] [PMC free article] [PubMed] [Google Scholar]
- 32. Bernal‐Mizrachi E, Kulkarni RN, Scott DK, Mauvais‐Jarvis F, Stewart AF, Garcia‐Ocaña A. Human β‐cell proliferation and intracellular signaling part 2: still driving in the dark without a road map. Diabetes. 2014;63(3):819‐831. [DOI] [PMC free article] [PubMed] [Google Scholar]
- 33. El Ouaamari A, Kawamori D, Dirice E, et al. Liver‐derived systemic factors drive β cell hyperplasia in insulin‐resistant states. Cell Rep. 2013;3(2):401‐410. [DOI] [PMC free article] [PubMed] [Google Scholar]
- 34. Martin‐Montalvo A, Lorenzo PI, López‐Noriega L, Gauthier BR. Targeting pancreatic expressed PAX genes for the treatment of diabetes mellitus and pancreatic neuroendocrine tumors. Expert Opin Ther Targets. 2017;21(1):77‐89. [DOI] [PubMed] [Google Scholar]
- 35. Blake JA, Thomas M, Thompson JA, White R, Ziman M. Perplexing Pax: from puzzle to paradigm. Dev Dyn. 2008;237(10):2791‐2803. [DOI] [PubMed] [Google Scholar]
- 36. Blake JA, Ziman MR. Pax genes: regulators of lineage specification and progenitor cell maintenance. Development. 2014;141(4):737‐751. [DOI] [PubMed] [Google Scholar]
- 37. Napolitano T, Avolio F, Courtney M, et al. Pax4 acts as a key player in pancreas development and plasticity. Semin Cell Dev Biol. 2015;44:107‐114 [DOI] [PubMed] [Google Scholar]
Associated Data
This section collects any data citations, data availability statements, or supplementary materials included in this article.
Supplementary Materials