Abstract
Background
This study aimed to investigate the change of circulating miRNA expression profiles in knee osteoarthritis (OA) patients before and after celecoxib treatment.
Methods
Two hundred and eighteen knee OA patients underwent celecoxib treatment for 6 weeks were enrolled. Plasma samples were obtained at baseline (W0) and at W6, and treatment efficacy were assessed by WOMAC index. In the exploration stage, miRNA expression profiles in plasma before and after treatment from 6 patients were detected by microarray. Subsequently, in the validation stage, 10 top differentially expressed miRNAs (DEMs) after and before treatment in microarray were further validated in all 218 patients by qPCR.
Results
In the exploration stage, patients after treatment could be distinguished from them before treatment by miRNAs expression profiles by PCA plot and heatmap analysis, and 45 up‐regulated and 48 down‐regulated miRNAs were identified by volcano plot. In the validation stage, miR‐126‐5p and miR‐320a levels increased at W6 compared to W0, while miR‐155‐5p and miR‐146a‐5p levels decreased. WOMAC pain/stiffness/physical function scores were all decreased at W6 compared to W0, and 71% of patients achieved clinical response. The increase of miR‐126‐5p expression (W6‐W0) in clinical responders was much larger compared to nonclinical responders. And miRNA‐320a level declined in nonclinical responders while increased in clinical responders. Conversely, miRNA‐146a‐5p level increased in nonclinical responders while decreased in clinical responders.
Conclusion
Circulating miRNA expression profiles act as important roles in knee OA patients underwent celecoxib treatment, and miR‐126‐5p, miR‐320a as well as miR‐146a‐5p might correlate with treatment response to celecoxib.
Keywords: celecoxib, knee osteoarthritis, microRNAs, profile
1. INTRODUCTION
Osteoarthritis (OA), as the most prevalent chronic and degenerative joint disease, is caused by destruction and loss of articular cartilage, subchondral bone changes, or synovial effusion.1, 2 As a dominant type of OA, knee OA is characterized by pain, stiffness, swelling, degeneration of knee joint, as well as increasing disability, affecting an estimated 25% of populations with age above 55 years and costing from 1.0% to 2.5% of gross domestic product (GDP) worldwide.1, 3 Numerous patients suffering from knee OA have limitations in function that has adverse impacts on their usual activities, such as social activities, body image, emotional well‐being, and so on.4 At present, there is no treatment that has been shown to prevent the progression of OA, and the current treatments which include lifestyle modification, surgery, and pharmaceutical drugs all aim at structural modification and symptom improvement.5 Currently, the most widely prescribed drugs for OA are nonsteroidal anti‐inflammatory drugs (NSAIDs), while traditional NSAIDs (inhibiting both cyclo‐oxygenase (COX) ‐1 and COX‐2) have serious adverse effect on gastrointestinal tract resulting from its role in inhibiting COX‐1, which is thought to protect the GI mucosa by the synthesis of prostaglandin.6, 7 Subsequently, the selective COX‐2 inhibitors are developed and present with a better therapeutic effect and a safer gastrointestinal profile through sparing COX‐1 compared to traditional NSAIDs.2, 5 Celecoxib, as one of the most frequently used selective COX‐2 inhibitors, has also been reported to be highly effective and well tolerated in OA patients with the advantage of better renal safety profile and lower incidence of gastrointestinal adverse events compared to traditional NSAIDs, including ibuprofen and diclofenac.1, 2, 8, 9 However, the molecular mechanisms underlying the clinical effect in alleviating pain and function improvement of celecoxib in knee OA patients has not been fully elucidated.
MicroRNAs (miRNAs), a family of small non‐coding RNAs with 21‐28 nucleotides in length, regulate gene expression by inhibiting RNA translational and/or promoting mRNA degradation though binding to specific binding site in the 3′ untranslated region (UTR) of their target mRNAs.10 Several miRNAs are reported to show tissue‐specific or developmental stage‐specific expression profile associated with various join‐related diseases, including joint disorders, rheumatoid arthritis (RA), and OA.11 For example, Zi Wang et al12 reveal that the expression of miR‐140‐5p and miR‐149 was significantly down‐regulated in knee OA patients compared with the healthy controls (HCs), and low expression of miR‐140‐5p/149 inhibit chondrocyte proliferation and autophagy by targeting fucosyltransferase 1 (FUT1). As miRNAs are involved in the pathogenesis of OA development and progression, and celecoxib is observed to regulate a number of miRNAs in several diseases,13, 14, 15, 16 we hypothesized that celecoxib treatment would modulate miRNA expression profiles in knee OA.
Thus, this study aimed to investigate the change of circulating miRNA expression profiles in knee OA patients before and after celecoxib treatment.
2. MATERIALS AND METHODS
2.1. Patients
Two hundred and eighteen knee OA patients underwent celecoxib treatment for 6 weeks from Jan 2015 to Jun 2017 at Department of Orthopedics, The Central Hospital of Wuhan, Tongji Medical College, Huazhong University of Science and Technology were consecutively enrolled in this prospective cohort study. The inclusion criteria were as follows: (a) diagnosed as knee OA according to 1986 classification of osteoarthritis of knee in diagnostic criteria of the American Rheumatism Association,17 (b) age above 40 years, (c) Kellgren‐Lawrence (KL) grade II‐III, (d) pain of knee joint lasted for at least 1 month and Western Ontario and McMaster Universities Osteoarthritis Index (WOMAC) pain score above 40 mm, (e) about to receive celecoxib treatment, and (f) able to be followed up regularly. The exclusions were as follows: (a) complicated with other arthritis disease such as rheumatoid arthritis, septic arthritis, osteochondritis dissecans, or spondyloarthritis, (b) complicated with congestive heart failure, unstable angina, uncontrolled hypertension, stroke, or transient ischemic attack within 6 months, (c) complicated with severe renal or hepatic dysfunction, (d) knee OA with two‐side joints, (e) history of knee joint surgery, (f) received NSAIDs or high‐dose acetaminophen treatment within 1 month, (g) received articular injection of glucocorticoid or hyaluronic acid (HA) sodium within 3 months, and (h) pregnancy or lactation.
2.2. Ethics statement
Ethics Committee of The Central Hospital of Wuhan, Tongji Medical College, Huazhong University of Science and Technology had approved this study. This study was conducted according to the Declaration of Helsinki. All the patients provided signed informed consents before enrollments.
2.3. Study design
The study design is presented in Figure 1. 441 knee OA patients were invited to participate in this study, while 85 were excluded (14 missed the invitation and 71 declined to participate); thus, the remaining 356 knee OA patients were screened for eligibility. Among the 356 screened knee OA patients, 73 were excluded (29 exclusions and 44 disagreed to sign the informed consents); therefore, 283 knee OA patients were enrolled and received celecoxib treatment for 6 weeks. Among the study duration, 65 patients withdrew the study (3 lacked efficiency, 4 withdrew the consents, 18 stopped celecoxib in advance, and 40 lost follow‐up); hence, 218 knee OA patients completed the protocol and were included in the analysis.
Figure 1.
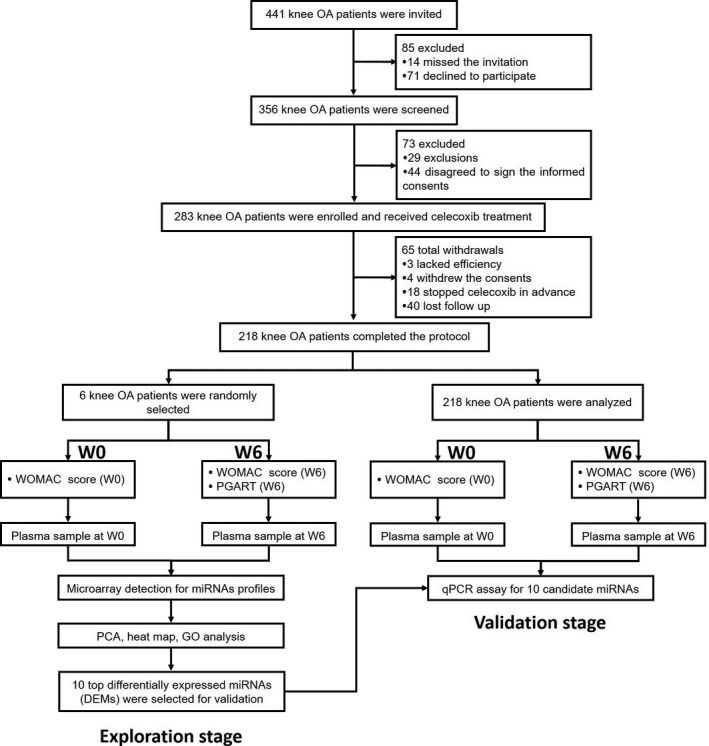
Study flow
In the exploration stage, 6 knee OA patients were randomly selected, and plasma sample was obtained before initiation of treatment (W0) and at 6 weeks (W6) after celecoxib treatment. And miRNA profiles in plasma were subsequently detected by microarray (GeneChip miRNA 4.0 Array (Affymetrix, USA)). Then, principal components analysis (PCA), heat map, and GO analysis for miRNA profiles before and after celecoxib treatment were performed, and 10 top differentially expressed miRNAs (DEMs) were selected for validation (Figure 1).
In the validation stage, plasma sample was obtained before initiation of celecoxib treatment (W0) and at W6 after celecoxib treatment in 218 knee OA patients. And qPCR assay was performed to determine the expressions of 10 candidate miRNAs at W0 and W6.
2.4. Treatment and assessments
All knee OA patients received celecoxib treatment for 6 weeks according to disease conditions and patients' willingness as follows: celecoxib 200 mg bid at day 1, and then 200 mg qd. WOMAC questionnaire was assessed at W0 and W6, which included pain (Question 1‐5), stiffness (Question 6‐7), and physical function subscales (Question 8‐24).18 Each question was scored as 0‐100 mm, and average score of questions in each subscale was used for analysis. Patients' global assessment of response to therapy (PGART) was assessed at W6 on a 5‐point categorical scale as follows: 0—no response, 1—poor response, 2—intermediate response, 3—good response, 4—excellent response. And clinical response was defined as good response + excellent response in this study.
2.5. Microarray and subsequent analysis for miRNA profiles before and after celecoxib treatment
Total RNA was extracted from each plasma sample of 6 knee OA patients before and after celecoxib treatment using TRIzol solution (Invitrogen, USA) according to manufacturer's protocol. Total RNAs (500 ng) were labeled using the FlashTag Biotin labeling kit (Genisphere, USA) and hybridized to the GeneChip miRNA 4.0 Array (Affymetrix, USA), respectively, which covered 2578 human mature miRNA, 2025 pre‐miRNA and 1996 snoRNA. RNA molecules were polyadenylated and followed by a ligation step with a biotin‐labeled DNA molecule attached, and then, labeled RNA was hybridized to the array, finally washed and stained in a GeneChip Fluidics Station 450 and scanned in a GeneChip Scanner 7G (Affymetrix, USA).
On account of the influence of intrinsic background of different chips on calculating the expression values, the raw data of each chip was normalized using the Geoquery package in R language (Version 3.3.3). After transformation of data to log2 expression, the Limma package in R language was used to identify the DEMs in plasma samples before and after celecoxib treatment. P values were adjusted by method of Benjamini and Hochberg procedure to control the false‐discovery rate. The statistical significance was defined as P < 0.05, and the clinical significance was defined as a difference of at least 1.5 folds, abs (log2 (fold change))>1.5. So as to illustrate the pattern of DEMs, PCA plot, and hierarchical clustering analysis was performed by R and pheatmap package (version 1.0.2, available at http://cran.r-project.org/web/packages/pheatmap/index.html). In addition, miEAA database were annotated to DEMs, which including GO_GeneOntology function and GO_Pathways analysis. The enrichment analysis of DEMs and its precursor was completed by Fisher's exact test to identify overrepresented miRNA‐related items.
2.6. qPCR assay
In the validation stage, qPCR assay was used to detect the 10 top DEMs that were identified in exploration stage by microarray. In brief, total RNA was extracted from each plasma sample of 218 knee OA patients by Trizol LS RNA isolation kit (Invitrogen, USA) and then reversely transcribed into cDNAs by Transcript First‐strand cDNA synthesis superMix (TransGen Biotech, China). Afterwards, SYBR Premix Ex Taq kit (Takara, China) was performed to detect the DEMs, while the data of DEMs were normalized according to the expression of U6. After that, the results were analyzed using SDS 1.4 software according to the 2−ΔΔCt method.
2.7. Statistics
Statistical analysis was performed using the SPSS 22.0 (IBM, USA), GraphPad Prism 6 (GraphPad Software, USA) and R software 3.2.5 (MathSoft, USA). Data were mainly described as mean value ± standard deviation or count (percentage). Difference between two groups was determined by paired t test, Wilcoxon signed‐rank sum test or t test. A 2‐tailed P value <0.05 was considered statistically significant.
3. RESULTS
3.1. Baseline characteristics of knee OA patients in exploration stage
The overall demographic and clinical characteristics of knee OA patients (N = 6) in exploration stage are listed in Table 1. The mean age of knee OA patients was 55.2 ± 10.0 years, and among them, there were four females and two males. In addition, the mean value of body mass index (BMI) was 23.8 ± 2.2 kg/m2. 4 (67%) patients had knee OA in their left side, while 2 (33%) in the right side. The numbers of knee OA patients in KL grade II and III were 4 (67%) and 2 (33%), respectively. The mean WOMAC scores were as follows: pain 61.7 ± 7.5, stiffness 53.3 ± 5.2, and physical function 58.3 ± 11.7.
Table 1.
Characteristics of AR patients and controls in Stage I of microarray assay
| Parameters | Knee OA patients (N = 6) |
|---|---|
| Age (y) | 55.2 ± 10.0 |
| Gender (Female/Male) | 4/2 |
| BMI (kg/m2) | 23.8 ± 2.2 |
| Side of knee OA (n/%) | |
| Left | 4 (67) |
| Right | 2 (33) |
| KL grade (n/%) | |
| II | 4 (67) |
| III | 2 (33) |
| WOMAC score | |
| Pain | 61.7 ± 7.5 |
| Stiffness | 53.3 ± 5.2 |
| Physical function | 58.3 ± 11.7 |
Data were presented as mean value ± standard deviation or counts (%).
BMI, body mass index; KL, Kellgren‐Lawrence; OA, osteoarthritis; WOMAC, Western Ontario and McMaster Universities Osteoarthritis Index.
3.2. Treatment efficiency of knee OA patients in exploration stage
In the exploration stage, the WOMAC pain score (P = 0.006, Figure 2A), WOMAC stiffness score (P = 0.003, Figure 2B), and WOMAC physical function score (P = 0.003, Figure 2C) in 6 knee OA patients were all declined at W6 compared with W0. In addition, at 6 weeks postcelecoxib treatment, 67% of knee OA patients achieved clinical response, while 33% of them failed to realize clinical response (Figure 2D).
Figure 2.
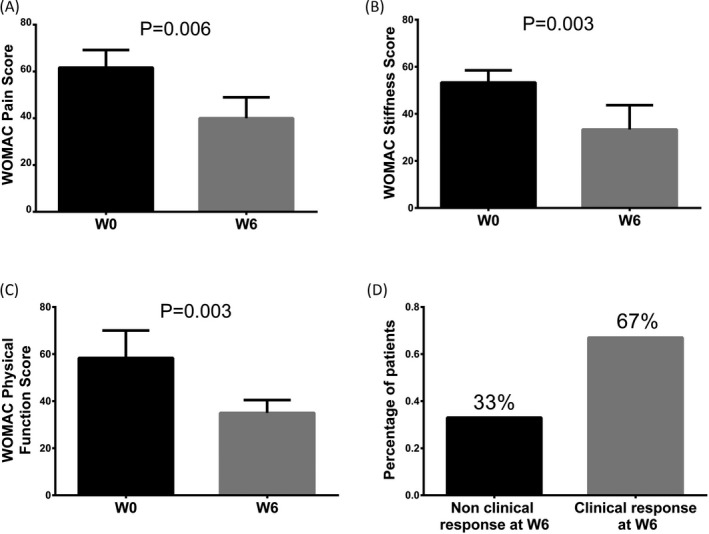
Treatment efficiency of knee OA patients in exploration stage. WOMAC Pain Score (A), WOMAC Stiffness Score (B), and WOMAC Physical Function Score (C) in exploration stage among 6 knee OA patients were all lower at W6 compared to at W0. And 67% of knee OA patients achieved clinical response, while 33% of them failed to realize clinical response at W6 (D). Difference between knee OA patients before and after treatment in WOMAC score was determined by paired t test. P < 0.05 was considered statistically significant. OA, osteoarthritis; WOMAC, Western Ontario and McMaster Universities; W, week
3.3. DEM analysis and enrichment analysis by microarray
Principal components analysis plot analysis was conducted to evaluate the difference of miRNAs aggregate in knee OA patients before and after celecoxib treatment, which showed that miRNA expression profiles could clearly distinguish knee OA patients before and after treatment in comp_2 axe (Figure 3A), while in comp_1 axe and comp_3 axe (Figure 3B), the miRNAs expression could not separate knee OA patients before and after treatment. Furthermore, as presented in volcano plot analysis (Figure 4A), 45 up‐regulated miRNAs and 48 down‐regulated miRNAs were detected in knee OA patients after celecoxib treatment. And the dysregulated miRNAs were then analyzed by heat map, which showed that the knee OA patients before and after celecoxib treatment could be differentiated by the expressions of dysregulated miRNAs (Figure 4B).
Figure 3.
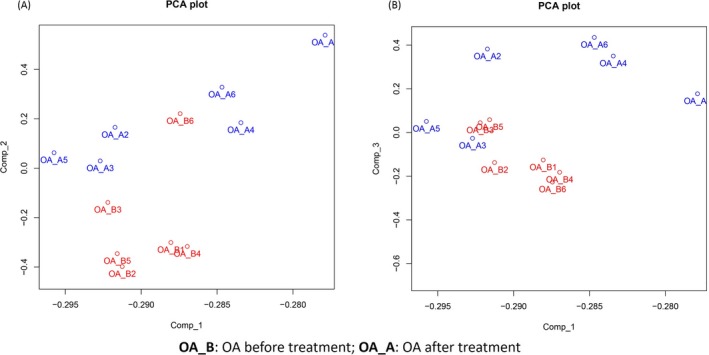
The PCA plot analysis. The red and blue text represents samples of before and after treatment, respectively. PCA plot showed that in comp_2 axe (A), knee OA patients before and after celecoxib treatment could be distinguished by miRNA expression profiles, while the differences of miRNA expressions between knee OA patients before and after treatment were not found in comp_1 axe (A) as well as in comp_3 axe (B). The PCA plot analysis was used to evaluate the difference of miRNA expression profiles for distinguishing knee OA patients before and after celecoxib treatment (Comp_1, Comp_2 and Comp_3 stand for three principal components respectively). OA, osteoarthritis; PCA, principal component analysis
Figure 4.
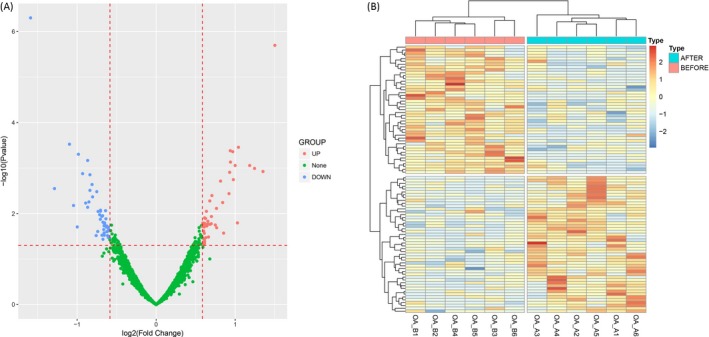
Volcano map and heat map analysis of DEMs. Volcano plot displayed 45 up‐regulated and 48 down‐regulated DEMs (A) and heat map analysis showed that knee OA patients before and after celecoxib treatment can be distinguished by dysregulated DEMs (B). DEMs was compared by R package limma, Benjamini as well as Hochberg procedure was used to adjust P values, and clinical significance defined as a difference of 1.5 folds (absolute (log2 (fold change))>1.5). OA, osteoarthritis; DEMs, differentially expressed miRNAs
The enrichment analysis of DEMs consisted of two areas, including GO_GeneOntology (Figure 5A) and GO_Pathways (Figure 5B), which showed that the DEMs are predominantly associated with inflammatory response, cartilage development involved in endochondral, and pathways related to NF‐kappa B, IL‐2, tumor necrosis factor (TNF), Toll‐like receptor, or insulin signaling and so on.
Figure 5.
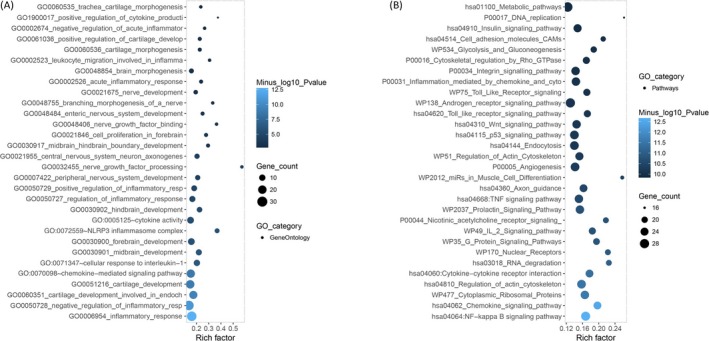
Enrichment analysis. Enrichment analysis showed that the DEMs were mostly associated to the inflammatory responses (A) (IL‐1, cartilage, NLRP3 inflammasome, cytokine, and leukocyte) and pathways (NF‐kappa B, IL‐2, TNF, Toll‐like receptor, or insulin signaling) related to OA (B). Enrichment analysis of DEMs and its precursor was completed by Fisher's exact test to identify over‐represented miRNA‐related items. OA, osteoarthritis; DEMs, differentially expressed miRNAs; IL, interleukin; TNF, tumor necrosis factor
3.4. Top 10 DEMs by microarray
Top 10 DEMs were selected in microarray according to their P values (Table 2), which consisted of 6 up‐regulated miRNAs, miR‐126‐5p, miR‐320a, miR‐210, miR‐3197, miR‐4796, and miR‐92a‐3p, and 4 down‐regulated miRNAs, miR‐675‐3p, miR‐155‐5p, miR‐17‐3p, and miR‐146a‐5p.
Table 2.
Top 10 differentially expressed miRNAs (DEMs) by microarray
| miRNA | logFC | AveExpr | t | P value | Trend |
|---|---|---|---|---|---|
| miR‐675‐3p | −1.59009 | 3.926462 | −6.33881 | 4.99E‐07 | DOWN |
| miR‐126‐5p | 1.502821 | 2.009337 | 5.845465 | 2.00E‐06 | UP |
| miR‐155‐5p | −1.09694 | 2.238497 | −4.07826 | 0.0003 | DOWN |
| miR‐320a | 1.04129 | 0.814671 | 4.022784 | 0.000349 | UP |
| miR‐210 | 0.937893 | 0.816236 | 3.960002 | 0.000416 | UP |
| miR‐3197 | 0.969965 | 1.175404 | 3.944028 | 0.000434 | UP |
| miR‐17‐3p | −0.9831 | 0.606195 | −3.89475 | 0.000497 | DOWN |
| miR‐146a‐5p | −0.86577 | 0.495813 | −3.78169 | 0.000678 | DOWN |
| miR‐4796 | 0.941133 | 0.743564 | 3.75141 | 0.000736 | UP |
| miR‐92a‐3p | 1.183994 | 3.682781 | 3.687173 | 0.000877 | UP |
Top 10 DEMs (according to P value) after and before celecoxib treatment were selected. Significance of the comparison was completed by limma package in R. P valve <0.05 was considered significant.
AveExpr, average of expression level; LogFC, log2 (fold change).
3.5. Baseline characteristics of knee OA patients in validation stage
Baseline characteristics of 218 knee OA patients in validation stage are shown in Table 3 with mean age 57.3 ± 11.7 years, female 165 cases and mean BMI 24.0 ± 3.1 kg/m2. One hundred and sixteen (53%) patients were left side knee OA, and 102 (47%) were right side. The numbers of knee OA patients in KL grade II and III were 159 (73%) and 59 (27%), respectively. Additionally, the mean WOMAC scores were as follows: pain 62.4 ± 12.2, stiffness 55.0 ± 9.4, and physical function 61.7 ± 12.9.
Table 3.
Baseline characteristics of knee OA patients in validation stage
| Parameters | Knee OA patients (N = 218) |
|---|---|
| Age (y) | 57.3 ± 11.7 |
| Gender (Female/Male) | 165/53 |
| BMI (kg/m2) | 24.0 ± 3.1 |
| Side of knee OA (n/%) | |
| Left | 116 (53) |
| Right | 102 (47) |
| KL grade (n/%) | |
| II | 159 (73) |
| III | 59 (27) |
| WOMAC score | |
| Pain | 62.4 ± 12.2 |
| Stiffness | 55.0 ± 9.4 |
| Physical function | 61.7 ± 12.9 |
Data were presented as mean value ± standard deviation or counts (%).
BMI, body mass index; KL, Kellgren‐Lawrence; OA, osteoarthritis; WOMAC, Western Ontario and McMaster Universities Osteoarthritis Index.
3.6. Treatment efficiency of knee OA patients in validation stage
In the validation stage, the WOMAC pain score (P < 0.001, Figure 6A), WOMAC stiffness score (P < 0.001, Figure 6B), and WOMAC physical function score (P < 0.001, Figure 6C) in knee OA patients at W6 were all decreased in comparison with W0. What's more, after celecoxib treatment for 6 weeks, 71% of knee OA patients realized clinical response, while the remaining 29% were failed (Figure 6D).
Figure 6.
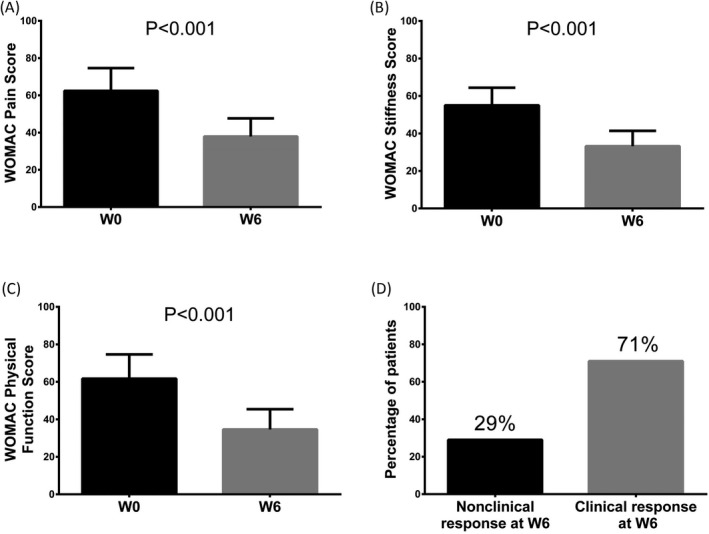
Treatment efficiency of knee OA patients in validation stage. The WOMAC pain score (A), WOMAC stiffness score (B) and WOMAC physical function score (C) in knee OA patients at W6 after celecoxib treatment were all declined compared to W0. And 71% of knee OA patients achieved clinical response, while the remaining 29% were failed (D). Difference between knee OA patients before and after treatment in WOMAC score was determined by paired t test. P < 0.05 was considered statistically significant. OA, osteoarthritis; WOMAC, Western Ontario, and McMaster Universities
3.7. Comparison of candidate miRNAs expressions before and after treatment in validation stage
After 6 weeks of celecoxib treatment, miR‐126‐5p (P < 0.001, Figure 7B) and miR‐320a (P = 0.004, Figure 7D) levels were elevated in knee OA patients compared with W0, while miR‐155‐5p (P < 0.001, Figure 7C) and miR‐146a‐5p (P = 0.001, Figure 7H) levels were decreased. However, no difference concerning the levels of miR‐675‐3p (P = 0.089, Figure 7A), miR‐210 (P = 0.145, Figure 7E), miR‐3197 (P = 0.269, Figure 7F), miR‐17‐3p (P = 0.109, Figure 7G),miR‐4796 (P = 0.191, Figure 7I), or miR‐92a‐3p (Figure 7J) (P = 0.770) between W6 and W0 was found.
Figure 7.
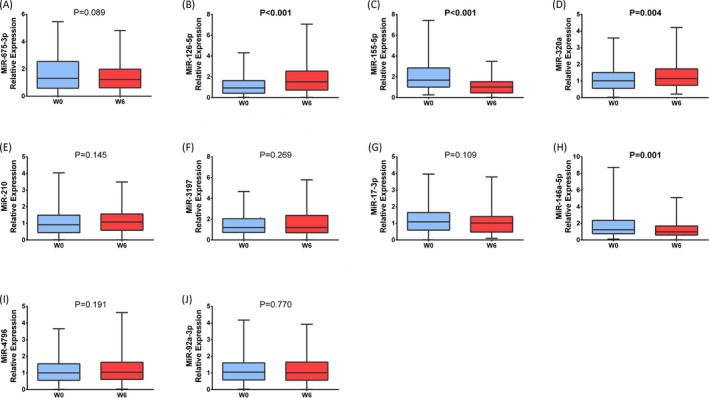
Comparison of candidate miRNAs before and after treatment in validation stage. The relative expressions of 10 DEMs were assessed by qPCR in validation stage, which showed that after celecoxib treatment for 6 weeks, patients with knee OA had increased levels of miR‐126‐5p (B), miR‐320a (D), and decreased levels of miR‐155‐5p (C) and miR‐146a‐5p (H). The difference of miR‐675‐3p (A), miR‐210 (E), miR‐3197 (F), miR‐17‐3p (G), miR‐4796 (I), and miR‐92a‐3p (J) levels before and after celecoxib treatment in knee OA patients were not found. Comparison of candidate miRNAs before and after treatment in validation stage was determined by Wilcoxon signed rank sum test. P < 0.05 was considered statistically significant. OA, osteoarthritis; DEMs, differentially expressed miRNAs
3.8. Comparison of changes of candidate miRNAs expressions (W6‐W0) between clinical response patients and nonclinical response patients treated by celecoxib
MiR‐126‐5p level was increased at W6 both in clinical responders and nonclinical responders, while its increase in clinical responders was much larger than that in nonclinical responders (P = 0.037, Figure 8B). The expression of miRNA‐320a was declined in nonclinical responders while increased in clinical responders (P = 0.012, Figure 8D). Conversely, the expression of miRNA‐146a‐5p was increased in non‐clinical responders while decreased in clinical responders (P = 0.004, Figure 8H). No difference of the relative change in expression of miR‐675‐3p (P = 0.986, Figure 8A), miR‐155‐5p (P = 0.079, Figure 8C), miR‐210 (P = 0.566, Figure 8E), miR‐3197 (P = 0.459, Figure 8F), miR‐17‐3p (P = 0.606, Figure 8G), miR‐4796 (P = 0.950, Figure 8I), or miR‐92a‐3p (P = 0.515, Figure 8J) was detected between clinical responders and nonclinical responders.
Figure 8.
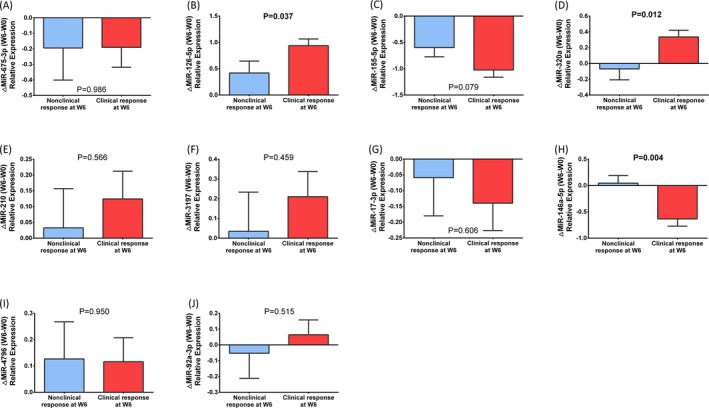
Comparison of changes of candidate miRNAs expressions (W6‐W0) between clinical response patients and nonclinical response patients. MiR‐126‐5p level in knee OA patients was increased at W6 compared to W0, and its increase level in clinical responders was much larger than that in non‐clinical responders (B). MiRNA‐320a level was declined in non‐clinical responders while was increased in clinical responders (D). Conversely, miRNA‐146a‐5p level was increased in non‐clinical responders while was decreased in clinical responders (H). No difference of the expression of miR‐675‐3p (A), miR‐155‐5p (C), miR‐210 (E), miR‐3197 (F), miR‐17‐3p (G) (P = 0.606), miR‐4796 (I) (P = 0.950), or miR‐92a‐3p (J) (P = 0.515) was detected between clinical responders and nonclinical responders. Difference between clinical responders and nonclinical responders was determined by t test. P < 0.05 was considered statistically significant. OA, osteoarthritis; W, week
4. DISCUSSION
Our study disclosed that (a) knee OA patients after celecoxib treatment could be differentiated from them before treatment through miRNA expression profiles by PCA plot analysis, and 45 up‐regulated miRNAs and 48 down‐regulated miRNAs were identified by volcano plot. (b) WOMAC pain score, WOMAC stiffness score, and WOMAC physical function score in knee OA patients at W6 were decreased compared to W0, and 71% of knee OA patients achieved clinical response while the remaining 29% failed. (c) MiR‐126‐5p and miR‐320a levels in knee OA patients were elevated at W6 compared to W0, while the levels of miR‐155‐5p and miR‐146a‐5p were decreased. (d) The increase in miR‐126‐5p expression in clinical responders was greater than that in nonclinical responders. And the expression of miRNA‐320a was declined in nonclinical responders while increased in clinical responders. Conversely, miRNA‐146a‐5p level was increased in nonclinical responders while decreased in clinical responders.
Accumulating studies suggest that miRNAs are implicated in the pathogenesis and treatment efficacy of arthritis, including RA and OA. For instance, Carmen Castro‐Villegas et al19 discover that miR‐126 is significantly up‐regulated by anti‐tumor necrosis factor alpha (anti‐TNFα) and disease‐modifying antirheumatic drugs combination therapy in serum samples from RA patients, and only clinical responders show an increase in miR‐126 expression after therapy, paralleling with the reduction in TNFα, IL‐6, IL‐17, rheumatoid factor, and C‐reactive protein, suggesting the positive role of miR‐126 in the regulation of these proinflammatory factors. An in vitro experiment report that miR‐320a expression was remarkably higher in OA chondrocytes than that in normal chondrocytes, and miR‐320a could mediate the expression levels of BMI‐1 and RUNX‐2 proteins in OA chondrocytes, which suggests that miR‐320a protects against OA cartilage degeneration by regulating the expression levels of BMI‐1 and RUNX2 proteins in chondrocytes.20 In our study, miR‐126‐5p and miR‐320a were up‐regulated in knee OA patients after celecoxib treatment. Furthermore, the increase in miR‐126‐5p expression in clinical responders was much larger than that in nonclinical responders, and miRNA‐320a level was declined in nonclinical responders while was increased in clinical responders. The probable explanation of these results may be that celecoxib produce good efficacy in OA patients via up‐regulating miR‐126‐5p and miR‐320a expression which have positive effects in OA cartilage by modulating proinflammatory cytokines and related proteins.14, 16, 21
MiR‐155‐5p has recently been reported to be strongly expressed and identified as a potent regulator of cytokine expression in inflammatory arthritis. For instance, Filková M et al22 observe that miR‐155 levels in sera from early RA were significantly lower compared to established RA. Ji‐Feng Xu et al4 illustrate that miR‐155‐5p level is notably reduced in synovial fluid from knee OA patients after HA treatment in comparison with its level at baseline. Moreover, overexpression of miR‐155 in peripheral blood CD14+ cells stimulates the production of pro‐inflammatory cytokines implicated in RA pathogenesis, such as IL‐1β, IL‐6, IL‐8, TNFα, and down‐regulates the production of anti‐inflammatory IL‐10.23 Those results suggest that miR‐155‐5p has negative effects in OA through enhancing inflammation by regulating several cytokines production, which might explain the lower level of miR‐155‐5p in knee OA patients after celecoxib treatment compared with baseline in our study; however, the difference of the relative change of miR‐155‐5p expression between nonclinical responders and clinical responders did not present statically significant, which might be resulted from the relative small sample size in this study or the weak correlation between miR‐155‐5p expression and PGART score. As for miR‐146a‐5p, a previous in vivo experiment illuminates that miR‐146a is overexpressed in human chondrocyte after mechanical pressure injury and may contribute to the pathogenesis of OA by stimulating vascular endothelial growth factor production and damaging the transforming growth factor (TGF)‐β signaling pathway through the targeted inhibition of Smad4 in cartilage.24 In another observational study, Yamasaki et al20 illustrate that miR‐146a is highly expressed in OA cartilage compared with normal cartilage, and its expression is induced by the stimulation of interleukin (IL)‐1β. In addition, there is also a study illuminating that miR‐146a and miR‐155 are upregulated in more advanced knee OA patients. To be exact, Soyocak A et al25 elucidate that miR‐146a and miR‐155 expressions are elevated in peripheral blood mononuclear cell (PBMC) of knee OA patients in progressive stages. In accordance with these findings, our study found that miR‐146a‐5p is low expressed in knee OA patients after celecoxib treatment, and its level was decreased in clinical responders while was increased in nonclinical responders, which could be explained by the destructive role of miR‐146a‐5p in cartilage and its regulatory function of inflammatory factors discovered by the previous studies.24, 26
Some limitations existed in this study: (a) The sample size in this study was relatively small, which may lead to lower statistical efficiency than studies with larger sample size; (b) all patients enrolled in this study were from single center, which might cause selection bias. Thus, further study enrolling patients from multicenter is required. (c) The cut‐off point of PGART score which was used to predict clinical response in knee OA patients is self‐defined because of without a universally standard. However, it remains to be verified which cut‐off value for clinical response is the most clinically relevant.
In conclusion, our results defined a profile of knee OA‐related dysregulated miRNA signatures that significantly different in knee OA patients before and after celecoxib treatment, revealing that these miRNAs might play important role in knee OA pathogenesis and celecoxib‐mediated therapeutics.
ACKNOWLEDGMENTS
None.
Dong Z, Jiang H, Jian X, Zhang W. Change of miRNA expression profiles in patients with knee osteoarthritis before and after celecoxib treatment. J Clin Lab Anal. 2019;33:e22648 10.1002/jcla.22648
Dong and Jiang contributed equally to this work.
REFERENCES
- 1. Xu C, Gu K, Yasen Y, et al. Efficacy and safety of celecoxib therapy in osteoarthritis: a meta‐analysis of randomized controlled trials. Medicine (Baltimore). 2016;95:e3585. [DOI] [PMC free article] [PubMed] [Google Scholar]
- 2. Puljak L, Marin A, Vrdoljak D, et al. Celecoxib for osteoarthritis. Cochrane Database Syst Rev. 2017;5:CD009865. [DOI] [PMC free article] [PubMed] [Google Scholar]
- 3. Hiligsmann M, Cooper C, Arden N, et al. Health economics in the field of osteoarthritis: an expert's consensus paper from the European Society for Clinical and Economic Aspects of Osteoporosis and Osteoarthritis (ESCEO). Semin Arthritis Rheum. 2013;43:303‐313. [DOI] [PubMed] [Google Scholar]
- 4. Xu JF, Zhang SJ, Zhao C, et al. Altered microRNA expression profile in synovial fluid from patients with knee osteoarthritis with treatment of hyaluronic acid. Mol Diagn Ther. 2015;19:299‐308. [DOI] [PubMed] [Google Scholar]
- 5. Glyn‐Jones S, Palmer AJ, Agricola R, et al. Osteoarthritis. Lancet. 2015;386:376‐387. [DOI] [PubMed] [Google Scholar]
- 6. da Costa BR, Reichenbach S, Keller N, et al. Effectiveness of non‐steroidal anti‐inflammatory drugs for the treatment of pain in knee and hip osteoarthritis: a network meta‐analysis. Lancet. 2017;390:e21‐e33. [DOI] [PubMed] [Google Scholar]
- 7. Reginster JY, Dudler J, Blicharski T, et al. Pharmaceutical‐grade Chondroitin sulfate is as effective as celecoxib and superior to placebo in symptomatic knee osteoarthritis: the ChONdroitin versus CElecoxib versus Placebo Trial (CONCEPT). Ann Rheum Dis. 2017;76:1537‐1543. [DOI] [PMC free article] [PubMed] [Google Scholar]
- 8. Lee M, Yoo J, Kim JG, et al. A randomized, multicenter, phase III trial to evaluate the efficacy and safety of polmacoxib compared with celecoxib and placebo for patients with osteoarthritis. Clin Orthop Surg. 2017;9:439‐457. [DOI] [PMC free article] [PubMed] [Google Scholar]
- 9. Silverstein FE, Faich G, Goldstein JL, et al. Gastrointestinal toxicity with celecoxib vs nonsteroidal anti‐inflammatory drugs for osteoarthritis and rheumatoid arthritis: the CLASS study: a randomized controlled trial. Celecoxib Long‐term Arthritis Safety Study. JAMA. 2000;284:1247‐1255. [DOI] [PubMed] [Google Scholar]
- 10. Sondag GR, Haqqi TM. The role of MicroRNAs and their targets in osteoarthritis. Curr Rheumatol Rep. 2016;18:56. [DOI] [PMC free article] [PubMed] [Google Scholar]
- 11. Churov AV, Oleinik EK, Knip M. MicroRNAs in rheumatoid arthritis: altered expression and diagnostic potential. Autoimmun Rev. 2015;14:1029‐1037. [DOI] [PubMed] [Google Scholar]
- 12. Wang Z, Hu J, Pan Y, et al. miR‐140‐5p/miR‐149 affects chondrocyte proliferation, apoptosis, and autophagy by targeting FUT1 in osteoarthritis. Inflammation. 2018;41:959‐971. [DOI] [PubMed] [Google Scholar]
- 13. Chen X, Peng D, Shen Y, et al. The potential combinational effect of miR‐34a with celecoxib in osteosarcoma. Anticancer Drugs. 2017;28:888‐897. [DOI] [PubMed] [Google Scholar]
- 14. Rmg DAC, Araujo R, Santos JMO, et al. Regulation of miRNA‐146a and miRNA‐150 levels by celecoxib in premalignant lesions of K14‐HPV16 mice. Anticancer Res. 2017;37:2913‐2918. [DOI] [PubMed] [Google Scholar]
- 15. Wong TY, Li F, Lin SM, et al. Celecoxib increases miR‐222 while deterring aromatase‐expressing breast tumor growth in mice. BMC Cancer. 2014;14:426. [DOI] [PMC free article] [PubMed] [Google Scholar]
- 16. Saito Y, Suzuki H, Imaeda H, et al. The tumor suppressor microRNA‐29c is downregulated and restored by celecoxib in human gastric cancer cells. Int J Cancer. 2013;132:1751‐1760. [DOI] [PubMed] [Google Scholar]
- 17. Altman R, Asch E, Bloch D, et al. Development of criteria for the classification and reporting of osteoarthritis. Classification of osteoarthritis of the knee. Diagnostic and Therapeutic Criteria Committee of the American Rheumatism Association. Arthritis Rheum. 1986;29:1039‐1049. [DOI] [PubMed] [Google Scholar]
- 18. Bellamy N, Buchanan WW, Goldsmith CH, et al. Validation study of WOMAC: a health status instrument for measuring clinically important patient relevant outcomes to antirheumatic drug therapy in patients with osteoarthritis of the hip or knee. J Rheumatol. 1988;15:1833‐1840. [PubMed] [Google Scholar]
- 19. Castro‐Villegas C, Perez‐Sanchez C, Escudero A, et al. Circulating miRNAs as potential biomarkers of therapy effectiveness in rheumatoid arthritis patients treated with anti‐TNFalpha. Arthritis Res Ther. 2015;17:49. [DOI] [PMC free article] [PubMed] [Google Scholar]
- 20. Peng H, Liang D, Li B, et al. MicroRNA‐320a protects against osteoarthritis cartilage degeneration by regulating the expressions of BMI‐1 and RUNX2 in chondrocytes. Pharmazie. 2017;72:223‐226. [DOI] [PubMed] [Google Scholar]
- 21. Chen WC, Lin MS, Ye YL, et al. microRNA expression pattern and its alteration following celecoxib intervention in human colorectal cancer. Exp Ther Med. 2012;3:1039‐1048. [DOI] [PMC free article] [PubMed] [Google Scholar]
- 22. Filkova M, Aradi B, Senolt L, et al. Association of circulating miR‐223 and miR‐16 with disease activity in patients with early rheumatoid arthritis. Ann Rheum Dis. 2014;73:1898‐1904. [DOI] [PMC free article] [PubMed] [Google Scholar]
- 23. Kurowska‐Stolarska M, Alivernini S, Ballantine LE, et al. MicroRNA‐155 as a proinflammatory regulator in clinical and experimental arthritis. Proc Natl Acad Sci U S A. 2011;108:11193‐11198. [DOI] [PMC free article] [PubMed] [Google Scholar]
- 24. Jin L, Zhao J, Jing W, et al. Role of miR‐146a in human chondrocyte apoptosis in response to mechanical pressure injury in vitro. Int J Mol Med. 2014;34:451‐463. [DOI] [PMC free article] [PubMed] [Google Scholar]
- 25. Soyocak A, Kurt H, Ozgen M, et al. miRNA‐146a, miRNA‐155 and JNK expression levels in peripheral blood mononuclear cells according to grade of knee osteoarthritis. Gene. 2017;627:207‐211. [DOI] [PubMed] [Google Scholar]
- 26. Prasadam I, Batra J, Perry S, et al. Systematic identification, characterization and target gene analysis of microRNAs involved in osteoarthritis subchondral bone pathogenesis. Calcif Tissue Int. 2016;99:43‐55. [DOI] [PubMed] [Google Scholar]


