Abstract
Background
Impaired levels or function of C1 inhibitor (C1‐INH) results in angioedema due to increased bradykinin. It is important to distinguish between angioedema related to C1‐INH deficiency and that caused by other mechanisms, as treatment options are different. In hereditary (HAE) and acquired (AAE) angioedema, C1‐INH concentration is measured to aid patient diagnosis. Here, we describe an automated turbidimetric assay to measure C1‐INH concentration on the Optilite® analyzer.
Methods
Linearity, precision, and interference were established over a range of C1‐INH concentrations. The 95th percentile reference interval was generated from 120 healthy adult donors. To compare the Optilite C1‐INH assay with a predicate assay used in a clinical laboratory, samples sent for C1‐INH investigation were used. The predicate results were provided to allow comparison.
Results
The Optilite C1‐INH assay was linear across the measuring range at the standard sample dilution. Intra and interassay variability was <6%. The 95th percentile adult reference interval for the assay was 0.21‐0.38 g/L. There was a strong correlation between the Optilite concentrations and those generated with the predicate assay (R 2 = 0.94, P < 0.0001, slope y = 0.83x). All patients with Type I HAE (n = 24) and AAE (n = 3) tested had concentrations below the measuring range in both assays, while all patients with unspecified angioedema (UAE), not diagnosed with HAE or AAE had values within the reference range.
Conclusion
The Optilite assay allows the automated and precise quantification of C1‐INH concentrations in patient samples. It could therefore be used as a tool to aid the investigation of patients with angioedema.
Keywords: AAE, angioedema, C1 inactivator, C1 inhibitor, C1‐INH, complement, HAE, Optilite, turbidimetric
1. INTRODUCTION
C1‐INH (C1 inhibitor, C1 inactivator) is a protease inhibitor which functions to control spontaneous activation of the classical complement pathway, as well as proteases of the fibrinolytic, clotting, and kinin pathways.1, 2 The key role of C1‐INH in regulating these pathways means that a C1‐INH deficiency or impaired C1‐INH function results in consumption of the early classical complement pathway proteins (C2 and C4)3 as well as increased concentrations of the vasoactive peptide bradykinin.4, 5 Increased bradykinin leads to vasodilation, fluid extravasation, increased capillary permeability and ultimately angioedema.5
Angioedema can be split into two main, broad subtypes—bradykinin‐induced angioedema and histamine‐induced angioedema. Bradykinin‐induced angioedema can be caused by an abnormal concentration or function of C1‐INH, as well as mutations in FXII and treatment with angiotensin‐converting enzyme (ACE) inhibitors.6 These bradykinin‐mediated forms of angioedema are distinct from histamine‐induced angioedema stemming from allergic reactions, as they do not respond to conventional therapies such as antihistamines or corticosteroids.7, 8, 9 This is crucial when deciding the appropriate treatment for patients presenting with angioedema.
Angioedema due to abnormal concentrations or function of C1‐INH may be hereditary (C1‐INH‐HAE) or acquired (C1‐INH‐AAE, from here on in, abbreviated to HAE and AAE). The measurement of C1‐INH concentration and function helps differentiate between angioedema due to impaired C1‐INH production or function, and that caused by other mechanisms.10, 11
Hereditary angioedema is a rare, genetic disorder, which in the majority of patients is due to mutations in the SERPING1 gene. Diagnosis of HAE is primarily made on biochemical testing. The disease is characterized by recurrent, nonurticarial, unpredictable episodes of swelling classically affecting the skin, gastrointestinal tract and airway. Gastrointestinal attacks of swelling can cause severe abdominal pain, nausea and vomiting12, 13 and may last from hours to days. Attacks of laryngeal angioedema are life‐threatening and require urgent treatment.14
There are two forms of HAE with C1‐INH deficiency—Type I, which is characterized by very low C1‐INH concentrations, and Type II, which is characterized by a normal or elevated C1‐INH concentration with reduced function, usually due to mutations in exon eight which affect target binding.11 Prevalence of HAE is approximately 1 in 50 000 individuals, with around 85% having Type I HAE.15, 16, 17, 18, 19 Notably, there is no family history of HAE in 20%‐25% of cases which are due to de novo mutations in SERPING1.
There are significant delays in the diagnosis of HAE,18, 19, 20 with one UK study reporting an average delay of 10 years for Type I diagnosis and 18 years for Type II HAE.20 This is a great cause for concern, because a diagnostic delay or incorrect diagnosis can lead to inappropriate and ineffective treatment, unnecessary (and potentially disease exacerbating) exploratory surgeries in patients with abdominal swelling and pain presenting as an acute abdomen, and may be fatal if appropriate treatment is not promptly administered to patients with a laryngeal edema attack. A recent study reported 29% mortality in undiagnosed HAE patients, compared with only 3% in those who had appropriate diagnoses.21 Accurate and timely diagnosis of HAE is therefore crucial to ensure patients receive the necessary treatment and the disease is managed appropriately. In addition to C1‐INH protein concentration and function, the measurement of C4 is important in the biochemical diagnostic assessment of HAE, and is reduced in Type 1 and Type 2 HAE as well as AAE.15, 22, 23
The clinical presentation of AAE due to C1‐INH deficiency is very similar to that of HAE, but the age of onset of symptoms is much later (by the second decade of life for 90% of HAE patients, but after the fourth decade of life for the majority of AAE patients).24, 25 In most patients, AAE due to C1‐INH deficiency is associated with the presence of neutralizing C1‐INH autoantibodies and/or lymphoproliferative disease. Diagnosis of AAE is predominantly based on the same biochemical tests as HAE; C1‐INH protein concentration, C4 concentration and C1‐INH functional tests, but with the addition of anti‐C1‐INH antibody testing and C1q concentrations. Similarly to HAE, around 20% of patients have normal antigenic levels of C1‐INH, but reduced function. A normal C1‐INH concentration, therefore, does not exclude a diagnosis of HAE or AAE; however, C4 would be predicted to be reduced in both conditions.24
Type I HAE and AAE with low C1‐INH concentration are the most common forms of the diseases. A simple, fast and reliable test to measure the concentration of C1‐INH is therefore an invaluable tool to aid in the diagnosis of these patients. Here, we describe a fully automated, turbidimetric assay for the measurement of C1‐INH protein concentration on the Optilite® turbidimetric analyzer.
2. MATERIALS AND METHODS
2.1. Serum samples
Serum samples were obtained from several sources for these studies.
2.1.1. Analytical studies
Serum samples from healthy adult blood donors were purchased from Quest Biomedical (Solihull, UK). Sample collection was approved by the Institution Ethics Review Board (#05142), with all donors providing written informed consent. These samples were used for development of the normal adult reference interval (n = 120, 60 male:60 female, age range 23‐94 years).
For assay validation experiments, sera were obtained from two main sources: (a) sera from healthy volunteers were purchased from Seralab, UK and (b) deidentified remnants of serum specimens collected for routine diagnostic testing, which were used in accordance with the World Medical Association Declaration of Helsinki‐Ethical Principles for Medical Research Involving Human Subjects 1964.
2.1.2. Assay comparisons
Residual, anonymous clinical samples, together with their serum C1‐INH concentration and function measurements determined by routine clinical assay, were obtained from the Immunodeficiency Centre for Wales and Department of Immunology, Barts Health NHS Trust (n = 260, age range 1‐87 years). The C1‐INH protein concentration and function results generated offsite in UKAS accredited immunology laboratories were provided to allow comparisons.
2.2. Sample preparation
Blood samples were collected by venepuncture, allowed to clot naturally and then the serum separated to prevent hemolysis. Samples were stored at −20°C before testing.
2.3. Development of C1‐INH‐specific antiserum
Sheep anti‐human C1‐INH antiserum was generated by subcutaneous immunization with 50 μg of purified human C1‐INH antigen (Calbiochem) mixed with complete Freund's adjuvant, with subsequent boosting at monthly intervals with 10 μg antigen in incomplete Freund's adjuvant.
To assess specificity of the C1‐INH antiserum, 10% SDS‐PAGE gels were loaded with pure C1‐INH or one of ten other plasma proteins; Factor XIa, Factor XIIa, Kallikrein, C1r, C1s, C2, C3c, C4, Factor B or Properdin. 0.5 μg of each protein was added for western blotting with the C1‐INH antiserum; 2 μg of each protein was added for Coomassie blue staining.
2.4. Development of C1‐INH‐depleted antiserum
Pooled serum was loaded on a CaptureSelect™ C1‐inhibitor Affinity Matrix column (Thermofisher, UK) to allow adsorption of C1‐INH protein. Effluent was collected and the absence of C1‐INH protein confirmed by 10% SDS‐PAGE and western blotting. Where low‐level C1‐INH samples were required, depleted serum was used for diluting samples.
2.5. Measurement of C1‐INH
Unless otherwise stated, C1‐INH concentrations were determined using the Optilite C1 Inactivator Kit (NK019.OPT) on the Optilite turbidimetric analyzer according to the manufacturer's instructions at The Binding Site, Birmingham (UK).
2.6. Assay validation
All analytical procedures were adapted from Clinical and Laboratory Standards Institute (CLSI) guidelines. For the assessment of linearity, 10 samples with varying C1‐INH concentrations were generated by mixing a serum sample pool with known high C1‐INH concentration with an analyte‐depleted serum sample pool. The observed concentrations were then plotted against the calculated expected concentrations.
The limit of blank (LoB) was determined by running analyte‐depleted serum 60 times. Limit of detection (LoD) and limit of quantification (LoQ) samples were generated by mixing unprocessed serum with analyte‐depleted serum to give C1‐INH concentrations of 0.1 and 0.7 g/L, respectively. The LoD was calculated from the LoB and the standard deviation (SD) of 60 tests of the LoD sample. The LoQ was calculated from 40 replicates of the LoQ sample, and the mean, SD and percentage coefficient of variation (%CV) were calculated.
Assay imprecision was assessed by measuring the C1‐INH concentrations in five different pooled sera samples (up to 100 donors per pool). The samples included a sample below the normal reference interval (0.13 g/L), a sample within the range at the standard 1/5 analyzer dilution (0.39 g/L), a sample within the range at the maximum 1/10 analyzer dilution (0.41 g/L), plus two samples −25% (0.16 g/L) and +25% (0.30 g/L) of the medical decision point (MDP, taken as the lower limit of the normal range 0.21 g/L). The samples were run in duplicate, with two runs per day using three reagent lots and five different analyzers over 21 consecutive days. The %CV and SD were determined for each source of variation.
Interference analysis was performed by spiking hemoglobin (5 g/L), bilirubin (200 mg/L), chyle (1500 FTU), or triglyceride (1000 mg/dL) into sera samples with three different C1‐INH concentrations (for hemoglobin, bilirubin, and chyle: 0.12, 0.23, and 0.32 g/L; triglyceride; 0.11, 0.20, and 0.32 g/L C1‐INH). Controls were generated by spiking samples with equivalent volumes of saline. The assay was deemed to have passed the interference assessment if the C1‐INH concentration after addition of the potential interfering substances was <±10% of the original value in the control sample.
2.7. Normal adult reference interval
The central 95th percentile reference interval was established by measuring the C1‐INH concentrations in serum samples taken from 120 healthy adult blood donors. These results were used to calculate the central 95th percentile range.
2.8. Assay comparison
To compare the Optilite C1‐INH assay with an assay already used in a clinical laboratory, 260 samples sent for C1‐INH investigation were assayed. These patients were undergoing investigation into the cause of their angioedema. The off‐site laboratory results for C1‐INH protein concentration were determined using a radial immunodiffusion assay (RID, The Binding Site Ltd.).
2.9. Comparison of C1‐INH protein concentration with C1‐INH functional activity
C1‐INH functional activity was determined using the Berichrom C1‐Inhibitor assay (Dade Behring, Germany). Optilite C1‐INH testing was performed at The Binding Site (Birmingham, UK). For the correlation between the Optilite C1‐INH concentration and the functional C1‐INH result, all samples with a result above the measuring range (>140% of the normal control) in the functional assay were removed from the analysis.
2.10. Statistical analysis
All graphs and statistical analyses were generated using GraphPad Prism version 5.04 or Analyze‐it® for Microsoft Excel programs. A P < 0.05 was considered statistically significant.
3. RESULTS
3.1. Assay development
The C1‐INH antiserum recognized C1‐INH upon western blotting of pure protein, but did not detect potential interfering proteins (Figure 1, results shown for Factor XIa, Factor XIIa, Kallikrein, C1r, C1s, C2, C3c, C4, Factor B, and Properdin).
Figure 1.
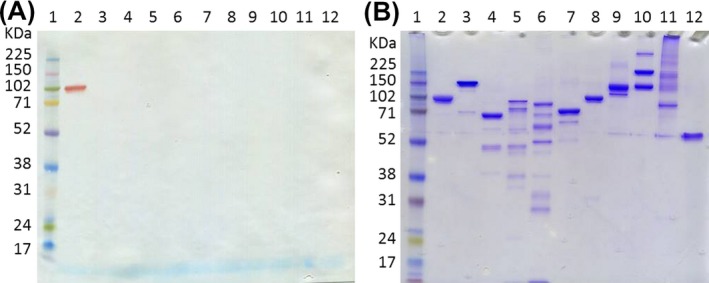
Assessment of C1‐INH antisera. 10% SDS‐PAGE gels were loaded with a protein ladder (lane 1) and various pure proteins; lane 2‐C1‐INH, 3‐Factor XIa, 4‐Factor XIIa, 5‐Kallikrein, 6‐C1r, 7‐C1s, 8‐C2, 9‐C3c, 10‐C4, 11‐Factor B, 12‐Properdin. A, 0.5 μg of each protein was added for western blotting with C1‐INH antiserum. B, 2 μg of each protein was added for Coomassie blue staining
3.2. Assay validation
C1‐INH concentrations were linear in the assay between 0.07 and 0.47 g/L, covering the assay measuring range (0.08‐0.44 g/L) at the standard 1/5 analyzer dilution (Figure 2; y = 0.98x + 0.01, r = 0.99). The LoB and LoD for the C1‐INH assay were 0.006 and 0.011 g/L, respectively [LoD = LoB + (1.645 SD LLS) = 0.006 + (1.645 × 0.003)]. The LoQ was 0.067 g/L (SD‐0.003 g/L, %CV‐4.6%).
Figure 2.
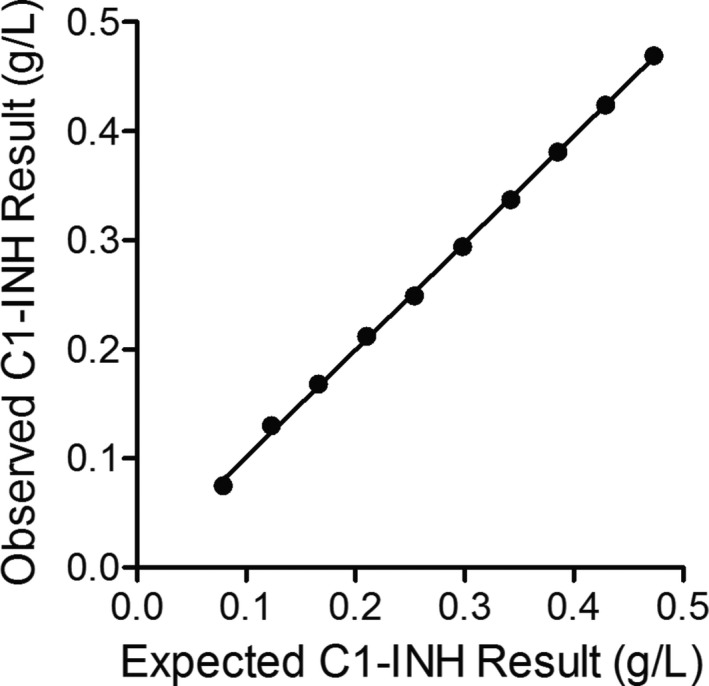
Linearity of the Optilite C1‐INH assay. Ten samples were generated by diluting a serum sample with a high C1‐INH concentration in a serum sample with a low concentration of C1‐INH. Samples were run in triplicate and the mean result for each concentration was plotted against the expected C1‐INH concentration. Identity line shown where y = x
Assay imprecision was calculated within run and between runs, days, batches, and instruments using five samples with different C1‐INH concentrations (Table 1). Percentage CVs within run, between runs, between days and between batches were all between 0.5% and 5.7%. The total assay imprecision was between 4.7% and 7.6% for all samples. The addition of chyle, hemoglobin, bilirubin, or triglyceride caused minimal interference with the measurement of C1‐INH at the concentrations tested (Table 2).
Table 1.
Imprecision of automated Optilite C1‐INH assay
| C1‐INH Concentration (g/L) | Within‐run | Between‐run | Between‐day | Between‐batch | Between‐ instrument | Total Precision | ||||||
|---|---|---|---|---|---|---|---|---|---|---|---|---|
| % CV | SD | % CV | SD | % CV | SD | % CV | SD | % CV | SD | % CV | SD | |
| 0.127 | 1.9 | 0.00 | 5.7 | 0.01 | 4.7 | 0.01 | 0.6 | 0.00 | 2.5 | 0.00 | 7.6 | 0.01 |
| 0.165 | 3.2 | 0.01 | 4.1 | 0.01 | 4.9 | 0.01 | 1.6 | 0.00 | 2.5 | 0.00 | 7.1 | 0.01 |
| 0.289 | 1.7 | 0.00 | 2.3 | 0.01 | 4.3 | 0.01 | 1.4 | 0.00 | 2.0 | 0.01 | 5.1 | 0.01 |
| 0.393 | 1.6 | 0.01 | 1.9 | 0.01 | 4.4 | 0.02 | 1.5 | 0.01 | 3.3 | 0.00 | 5.1 | 0.02 |
| 0.418 | 2.0 | 0.01 | 1.8 | 0.01 | 3.8 | 0.02 | 0.5 | 0.00 | 1.7 | 0.01 | 4.7 | 0.02 |
Precision was assessed in serum samples with five different C1‐INH concentrations. Each sample was assayed in duplicate, with two runs per day over 21 days—giving a total of 84 readings per sample. This part of the study was carried out using three reagent lots and five different analyzers.
Table 2.
Interference data for automated Optilite® C1‐INH assay
| Chyle | Bilirubin | Hemoglobin | Triglyceride | |
|---|---|---|---|---|
| Low | 1.6% | 8.9% | 4.3% | −3.5% |
| MDP | 3.1% | 0.9% | 6.2% | −1.7% |
| Normal range | 1.3% | 1.0% | 3.5% | −1.5% |
Serum samples with three different C1‐INH concentrations (one low concentration, one around the medical decision point (MDP) and one within the normal range) were spiked with one of four interferents or saline as a control. All samples were then run in the Optilite C1‐INH assay. The results represent percentage change observed in the presence of the interfering substance.
3.3. Normal adult reference interval
Serum samples from 120 healthy adult donors were used to determine a 95th percentile reference interval for the automated C1‐INH assay of 0.21‐0.38 g/L (median‐0.29 g/L, mean‐0.29 g/L). No significant difference was observed between sexes.
3.4. Assay comparison
The concentrations obtained using the Optilite C1‐INH assay were compared to the C1‐INH concentrations and C1‐INH function results obtained from the clinical laboratory. There was a strong correlation between the C1‐INH protein concentrations generated using the Optilite assay and the concentrations obtained using RID in the clinical laboratory (R 2 = 0.94, P < 0.0001, slope y = 0.83x) with a mean bias of 0.0096 g/L using the Optilite assay (95% CI −0.04 to 0.06) (Figure 3).
Figure 3.
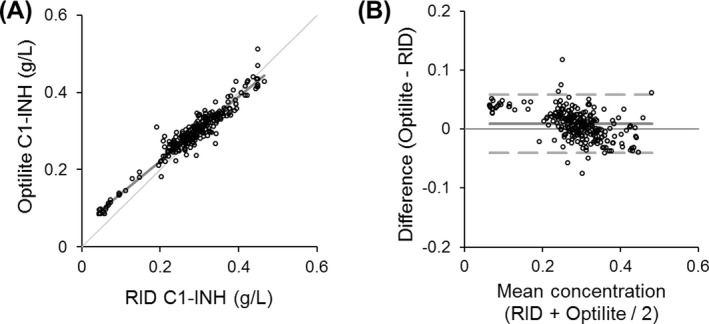
Comparison of C1‐INH concentration by Optilite and RID. The C1‐INH concentration was measured using the Optilite assay, and compared to the radial immunodiffusion (RID) method used routinely in the clinical laboratory. Two hundred and sixty serum samples from patients with, or undergoing investigation for angioedema were used. Comparison between the two assays was assessed using A, Passing‐Bablok analysis (identity line shown where y = x) and B, Bland‐Altman analysis (solid line demonstrates the mean difference and broken lines show the limits of agreement, −1.96 and +1.96 standard deviations)
3.5. Comparison of C1‐INH protein concentration with C1‐INH functional activity
There was also a significant correlation between the C1‐INH concentration obtained from the Optilite assay and the C1‐INH functional measurements (P < 0.0001, R 2 = 0.84) (Figure 4).
Figure 4.
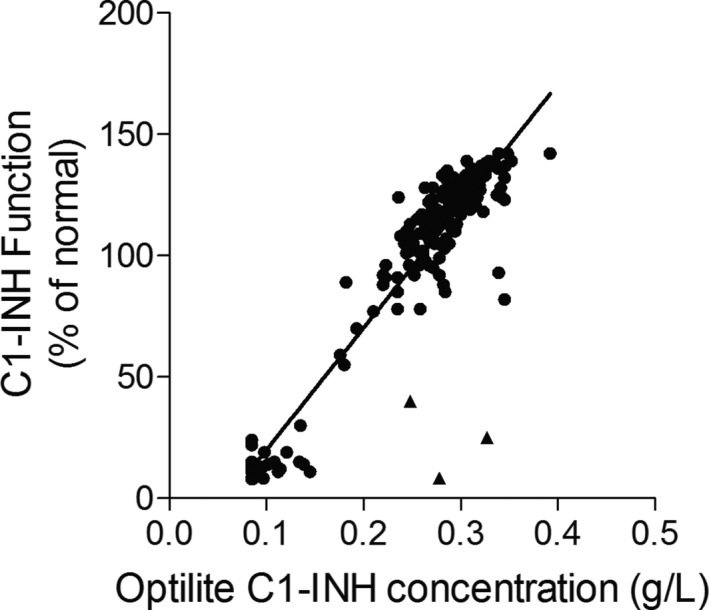
Correlation between C1‐INH concentration and C1‐INH functional activity. C1‐INH concentration and functional activity were measured in serum samples (n = 199, samples with C1‐INH function over the range of the assay (>140%) of the normal control were removed from this analysis). ▴ = 3 Type II hereditary angioedema (HAE) samples, ● = all other samples (Type I HAE, acquired angioedema (AAE), and unspecified angioedema [UAE]). Results were analyzed using linear regression analysis
3.6. Clinical utility of the C1‐INH Optilite assay
When comparing patient diagnoses, four different groups are shown (Figure 5); those with HAE Type I (n = 24), HAE Type II (n = 3), AAE (n = 3), and those with unspecified angioedema (UAE) not diagnosed as HAE or AAE (n = 76). There was 100% agreement between the two C1‐INH protein concentration assays at determining whether patients had C1‐INH concentrations below or above the lower limit of the respective reference ranges. All HAE Type I and AAE patients tested here had C1‐INH concentrations below the normal reference intervals, whereas no UAE patients did. As expected, the three Type II HAE patients were not identified using either protein concentration assay, but had C1‐INH functional measurements below the normal range of the assay, along with all HAE Type I and AAE patients tested.
Figure 5.
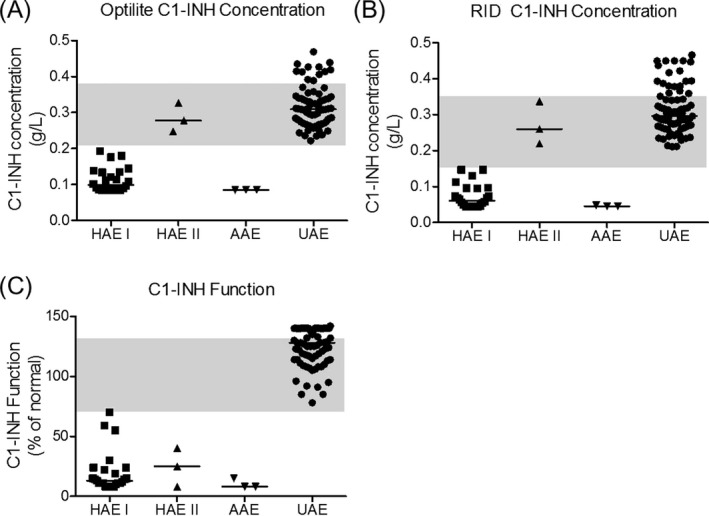
C1‐INH concentration and C1‐INH functional activity in clinical samples. The C1‐INH concentrations were measured using the Optilite assay (A) and radial immunodiffusion (RID, B). The functional activity of C1‐INH is also shown (C). Shaded areas represent the normal range of the assays
4. DISCUSSION
In this study, we have described the development and validation of an automated assay for the measurement of C1‐INH protein concentration on the Optilite turbidimetric analyzer. The assay allows the rapid, precise, and quantitative evaluation of C1‐INH over a wide measuring range, covering concentrations likely to be encountered in clinical practice. The assay was linear over the measuring range of 0.08‐0.44 g/L at the standard 1/5 analyzer dilution, and was largely unaffected by common blood constituents.
Many laboratories currently use techniques such as RID26 for the quantification of C1‐INH protein concentration. This technique may be laborious and time‐consuming, and for RID the interpretation of results is potentially subjective, requiring trained staff to carry out the analyses. The assay described here is automated, simple and has a quick time to first result. The assay has also fulfilled criteria for linearity, precision, and interference which are adpated from CLSI guidelines, making it an attractive alternative to other available methods. Using 120 healthy adult blood donors, a 95th percentile reference interval of 0.21‐0.38 g/L was established.
Here, we provide a comparison between the high‐throughput, automated assay, and an existing method used routinely in the clinical laboratory. To ensure the results obtained in the Optilite assay were comparable to those generated using the predicate assay, a comparison was performed using 260 samples sent for C1‐INH investigation. These patients were undergoing investigation into the cause of their angioedema. The Optilite assay results correlated strongly with those generated with the predicate method.
All patients tested with Type I HAE and AAE in this study were identified as having C1‐INH concentrations below this normal range. Timely diagnosis of these patients is crucial, as these disorders can be fatal. Studies suggest mortality in HAE to be approximately 30% before improvements in the diagnosis and treatment of the disease—primarily due to asphyxiation caused by laryngeal edema.21, 27, 28 Improvements in HAE therapies mean that acute attacks can be effectively treated either in hospital or at home and in those with a high attack frequency prophylactic therapy has been shown to be effective in reducing attacks. Accurate and early diagnosis is therefore key to ensuring these patients receive timely and appropriate care. C1‐INH testing and achieving a definitive diagnosis is also important for the reimbursement of specific therapies in some countries, emphasizing the requirement for laboratory tests that aid in specific diagnoses.
The three Type II HAE patients tested here had normal protein concentrations of C1‐INH by both the predicate assay and the Optilite assay. It is known that these patients have normal protein concentrations but reduced function, and functional C1‐INH testing is therefore required to identify these patients. As expected, the results provided from the clinical laboratory demonstrate these patients do indeed have greatly reduced C1‐INH function.
As a consequence of uncontrolled complement activation, serum C4 is also low in the majority of patients with HAE15, 23 and AAE,29 and due to the ease, cost and availability of this assay, it is often used to “request manage” access to C1‐INH assays in the UK.26 However, several studies have now shown that normal serum C4 does not always exclude the diagnosis of HAE.26, 30 One recent study demonstrated low serum C4 had only 71% sensitivity for HAE diagnosis, whereas low C1‐INH had 97% sensitivity for Type I HAE26—demonstrating the importance of measuring C1‐INH protein concentration to aid the diagnosis of these patients.
5. CONCLUSION
In conclusion, the Optilite C1‐INH assay provides a simple, rapid and precise method for the measurement of C1‐INH in patient serum samples, and could be used to aid in the diagnosis of angioedema caused by C1‐INH deficiencies.
Tange CE, Kaur A, Verma N, et al. Quantification of human C1 esterase inhibitor protein using an automated turbidimetric immunoassay. J Clin Lab Anal. 2019;33:e22627 10.1002/jcla.22627
REFERENCES
- 1. Bork K, Davis‐Lorton M. Overview of hereditary angioedema caused by C1‐inhibitor deficiency: assessment and clinical management. Eur Ann Allergy Clin Immunol. 2013;45(1):7‐16. [PubMed] [Google Scholar]
- 2. Bork K. Diagnosis and treatment of hereditary angioedema with normal C1 inhibitor. Allergy Asthma Clin Immunol. 2010;6(1):15. [DOI] [PMC free article] [PubMed] [Google Scholar]
- 3. Donaldson VH, Rosen FS. Action of complement in hereditary angioneurotic edema: the role of C'1‐esterase. J Clin Invest. 1964;43:2204‐2213. [DOI] [PMC free article] [PubMed] [Google Scholar]
- 4. Nussberger J, Cugno M, Amstutz C, Cicardi M, Pellacani A, Agostoni A. Plasma bradykinin in angio‐oedema. Lancet. 1998;351(9117):1693‐1697. [DOI] [PubMed] [Google Scholar]
- 5. Nussberger J, Cugno M, Cicardi M. Bradykinin‐mediated angioedema. N Engl J Med. 2002;347(8):621‐622. [DOI] [PubMed] [Google Scholar]
- 6. Craig TJ, Bernstein JA, Farkas H, Bouillet L, Boccon‐Gibod I. Diagnosis and treatment of bradykinin‐mediated angioedema: outcomes from an angioedema expert consensus meeting. Int Arch Allergy Immunol. 2014;165(2):119‐127. [DOI] [PubMed] [Google Scholar]
- 7. Bernstein JA, Cremonesi P, Hoffmann TK, Hollingsworth J. Angioedema in the emergency department: a practical guide to differential diagnosis and management. Int J Emerg Med. 2017;10(1):15. [DOI] [PMC free article] [PubMed] [Google Scholar]
- 8. Kaplan AP, Joseph K, Silverberg M. Pathways for bradykinin formation and inflammatory disease. J Allergy Clin Immunol. 2002;109(2):195‐209. [DOI] [PubMed] [Google Scholar]
- 9. Asero R. Clinical management of adult patients with a history of nonsteroidal anti‐inflammatory drug‐induced urticaria/angioedema: update. Allergy Asthma Clin Immunol. 2007;3(1):24‐30. [DOI] [PMC free article] [PubMed] [Google Scholar]
- 10. Bork K. Recurrent angioedema and the threat of asphyxiation. Dtsch Arztebl Int. 2010;107(23):408‐414. [DOI] [PMC free article] [PubMed] [Google Scholar]
- 11. Caballero T, Baeza ML, Cabanas R, et al. Consensus statement on the diagnosis, management, and treatment of angioedema mediated by bradykinin. Part I. Classification, epidemiology, pathophysiology, genetics, clinical symptoms, and diagnosis. J Investig Allergol Clin Immunol. 2011;21(5):333‐347. [PubMed] [Google Scholar]
- 12. Bork K, Staubach P, Eckardt AJ, Hardt J. Symptoms, course, and complications of abdominal attacks in hereditary angioedema due to C1 inhibitor deficiency. Am J Gastroenterol. 2006;101(3):619‐627. [DOI] [PubMed] [Google Scholar]
- 13. Nzeako UC. Diagnosis and management of angioedema with abdominal involvement: a gastroenterology perspective. World J Gastroenterol. 2010;16(39):4913‐4921. [DOI] [PMC free article] [PubMed] [Google Scholar]
- 14. Ishoo E, Shah UK, Grillone GA, Stram JR, Fuleihan NS. Predicting airway risk in angioedema: staging system based on presentation. Otolaryngol Head Neck Surg. 1999;121(3):263‐268. [DOI] [PubMed] [Google Scholar]
- 15. Gompels MM, Lock RJ, Abinun M, et al. C1 inhibitor deficiency: consensus document. Clin Exp Immunol. 2005;139(3):379‐394. [DOI] [PMC free article] [PubMed] [Google Scholar]
- 16. Lumry WR. Overview of epidemiology, pathophysiology, and disease progression in hereditary angioedema. Am J Manag Care. 2013;19(7 Suppl):s103‐s110. [PubMed] [Google Scholar]
- 17. Zuraw BL. Clinical practice. Hereditary angioedema. N Engl J Med. 2008;359(10):1027‐1036. [DOI] [PubMed] [Google Scholar]
- 18. Bygum A. Hereditary angio‐oedema in Denmark: a nationwide survey. Br J Dermatol. 2009;161(5):1153‐1158. [DOI] [PubMed] [Google Scholar]
- 19. Roche O, Blanch A, Caballero T, Sastre N, Callejo D, Lopez‐Trascasa M. Hereditary angioedema due to C1 inhibitor deficiency: patient registry and approach to the prevalence in Spain. Ann Allergy Asthma Immunol. 2005;94(4):498‐503. [DOI] [PubMed] [Google Scholar]
- 20. Jolles S, Williams P, Carne E, et al. A UK national audit of hereditary and acquired angioedema. Clin Exp Immunol. 2014;175(1):59‐67. [DOI] [PMC free article] [PubMed] [Google Scholar]
- 21. Bork K, Hardt J, Witzke G. Fatal laryngeal attacks and mortality in hereditary angioedema due to C1‐INH deficiency. J Allergy Clin Immunol. 2012;130(3):692‐697. [DOI] [PubMed] [Google Scholar]
- 22. Longhurst H, Cicardi M. Hereditary angio‐oedema. Lancet. 2012;379(9814):474‐481. [DOI] [PubMed] [Google Scholar]
- 23. Gompels MM, Lock RJ, Morgan JE, Osborne J, Brown A, Virgo PF. A multicentre evaluation of the diagnostic efficiency of serological investigations for C1 inhibitor deficiency. J Clin Pathol. 2002;55(2):145‐147. [DOI] [PMC free article] [PubMed] [Google Scholar]
- 24. Cicardi M, Aberer W, Banerji A, et al. Classification, diagnosis, and approach to treatment for angioedema: consensus report from the Hereditary Angioedema International Working Group. Allergy. 2014;69(5):602‐616. [DOI] [PubMed] [Google Scholar]
- 25. Cicardi M, Zanichelli A. Acquired angioedem. Allergy Asthma Clin Immunol. 2010;6(1):14. [DOI] [PMC free article] [PubMed] [Google Scholar]
- 26. Tarzi MD, Hickey A, Forster T, Mohammadi M, Longhurst HJ. An evaluation of tests used for the diagnosis and monitoring of C1 inhibitor deficiency: normal serum C4 does not exclude hereditary angio‐oedema. Clin Exp Immunol. 2007;149(3):513‐516. [DOI] [PMC free article] [PubMed] [Google Scholar]
- 27. Agostoni A, Cicardi M. Hereditary and acquired C1‐inhibitor deficiency: biological and clinical characteristics in 235 patients. Medicine (Baltimore). 1992;71(4):206‐215. [DOI] [PubMed] [Google Scholar]
- 28. Frank MM, Gelfand JA, Atkinson JP. Hereditary angioedema: the clinical syndrome and its management. Ann Intern Med. 1976;84(5):580‐593. [DOI] [PubMed] [Google Scholar]
- 29. Zanichelli A, Azin GM, Wu MA, et al. Diagnosis, course, and management of angioedema in patients with acquired C1‐inhibitor deficiency. J Allergy Clin Immunol Pract. 2017;5(5):1307‐1313. [DOI] [PubMed] [Google Scholar]
- 30. Karim Y, Griffiths H, Deacock S. Normal complement C4 values do not exclude hereditary angioedema. J Clin Pathol. 2004;57(2):213‐214. [DOI] [PMC free article] [PubMed] [Google Scholar]


