

Abstract
Background
The main risk factors for atherosclerosis patients are not fully explicated. The aim of this study was to analyze the levels of blood lipid and glycosylated lipoprotein in patients with coronary artery atherosclerosis and healthy individuals and to study the relationship between the glycosylated lipoprotein and atherosclerosis.
Methods
The study involved 200 patients diagnosed with myocardial infarction caused by coronary atherosclerosis as case group and 230 healthy individuals as control group. We analyzed and contrasted the levels of blood lipid and glycosylated lipoprotein between the different groups. In addition, we investigated the correlation between glycosylated low‐density lipoprotein (G‐LDL) and glucose levels.
Results
There is no statistical difference between the level of TG in case group and control group. The level of CHOL, HDL‐C, and LDL‐C in case group is significantly lower than that in control group (3.90 [3.23, 4.42] vs 5.16 [4.86, 5.77] [mmol/L]; 1.09 [0.83, 1.38] vs 1.46 [1.15, 1.80] [mmol/L]; 2.22 [1.68, 2.81] vs 2.95 [2.60, 3.27] [mmol/L]) (P < 0.05). The level of GLU, HbA1c, G‐HDL, and G‐LDL in case group is significantly higher than that in control group (7.10 [5.68, 9.27] vs 4.84 [4.68, 5.07] [mmol/L]; 6.8 [6.3, 7.4] vs 5.9 [5.6, 6.1] [%]; 30.08 [25.04, 40.17] vs 22.95 [18.14, 27.06] [ng/mL], 6.26 [4.95, 7.50] vs 3.61 [2.66, 5.15] [ng/mL]) (p < 0.05). The level of G‐LDL in patients with coronary atherosclerosis was relevant with the level of GLU and HbA1c (r = 0.625, 0.706, P < 0.05), and there was no relevance with LDL‐C (r = 0.331, P > 0.05).
Conclusion
Hyperlipidemia is not an important cause of coronary atherosclerosis. High glucose levels and glycosylated lipoprotein are of high importance in the development and progression of coronary atherosclerosis.
Keywords: coronary atherosclerosis, glycosylated lipoprotein, myocardial infarction
1. INTRODUCTION
Acute myocardial infarction (AMI) is a severe case of myocardial cell hypoxia and necrosis caused by myocardial ischemia.1 The mortality rate of AMI has increased significantly in recent years2 and has become a major public health problem.3 Coronary atherosclerosis is one of the most typical pathophysiological signs of AMI. But the formation mechanism of atherosclerosis is not fully understood. The traditional risk factors for atherosclerosis are hyperlipidemia, hypertension, smoking, diabetes, obesity, and lack of physical activity.4 In recent decades, some studies point out that modified lipoprotein plays an important role in atherosclerosis patients.5, 6
It is well‐established that diabetes mellitus is an independent risk factor for atherosclerosis.7 Several studies have demonstrated that patients with high glucose are at higher risk for atherosclerosis comparison to people with normal glucose.8, 9 The 2015 U.S. Residents’ Dietary Guidelines removed restrictions on residents’ cholesterol intake. The Dietary Guidelines Advisory Committee (DGAC) is considered that the intake of cholesterol in the human body does not need to be taken into account, and it is recommended to control the intake of sugar.10
Therefore, we tested the hypothesis that high glucose might increase glycosylated lipoprotein levels and promotes atherosclerosis. The aim of this study was to investigate the clinical characteristics and the levels of lipid, glucose, and glycosylated lipoprotein of AMI patients in newly diagnosed atherosclerosis compared with control individuals.
2. MATERIALS AND METHODS
2.1. Subjects
Between December 2016 and December 2017, 389 Chinese patients diagnosed with acute myocardial infarction at the West China Hospital of Sichuan University. We enrolled 200 patients as case group. Inclusion criteria: The patients were first‐episode acute myocardial infarction and had not been taking lipid‐lowering drugs before. Imaging examination showed that the patient had coronary plaques and met the criteria for the diagnosis of acute coronary syndrome in the European Society of Cardiology (ESC) 2015.11 Exclusion criteria: Patients with a previous history of myocardial infarction. Patients were with severe liver or kidney disease or malignancy. And incomplete medical records or patients who are unwilling to provide basic information were excluded.
At the same time, we enrolled 230 healthy people as control individuals. Inclusion criteria: People have no coronary heart disease, chronic obstructive pulmonary disease, peripheral vascular disease, and severe liver and kidney disease history. Electrocardiogram and echocardiography showed cardiac function is normal.
2.2. Laboratory measurements
We collected 5 mL of venous blood samples from participants after an overnight fast and centrifuged at 1600 g/min for 15 min. The samples were taken for measurement. Glycosylated hemoglobin (HbA1c) was measured by high‐performance liquid chromatography (Tosoh, Tokyo, Japan). Fast plasma glucose (FPG), total cholesterol (TC), triglycerides (TG), high‐density lipoprotein cholesterol (HDL‐C), and low‐density lipoprotein cholesterol (LDL‐C) were measured by hexokinase method (cobas 8000; ROCHE, Germany). Collection of samples and analysis were according to laboratory standard operating procedure and had CAP accreditation.
2.3. Glycosylated lipoprotein measurement
All serum was stored at −20°C for glycosylated lipoprotein measurement. Glycosylated high‐density lipoprotein (G‐HDL) and glycosylated low‐density lipoprotein cholesterol (G‐LDL) were measured by ELISA (Human Gly‐HDL/LDL ELISA Kit, bioTSZ, USA).
2.4. Statistical analyses
All statistical analyses were performed by SPSS 20.0. A P value less than 0.05 was considered as statistically significant. Continuous data were presented as the mean ± standard if normally distributed, and non‐normally distributed data were expressed as median and values of 25 to 75 percentiles. Categorical data were presented as percentage. To compare variables between two groups, t test was used for normally distributed continuous data and Wilcoxon test for non‐normally distributed data. Chi‐squared test was used for categorical variables. Spearman correlation test was used for the levels of glycosylated lipoprotein and glucose or lipid.
3. RESULT
3.1. Characteristics of study subjects
Among the 430 study subjects, 200 (46.5%) were AMI patients and 230 (53.5%) were control individuals. The clinical characteristics of them are presented in Table 1. Both AMI patients and control individuals had an equal sex and age distribution, whereas the AMI group had a strong predominance of hypertension and diabetes. The AMI patients had significantly higher heart rate, SBP, and DBP than control individuals (P < 0.001).
Table 1.
Characteristics of study subjects
| AMI patients | Control individuals | P‐value | |
|---|---|---|---|
| Number of subjects | 200 | 230 | |
| Male | 146 (73%) | 157 (68%) | 0.283 |
| Age (y) | 65 (53, 74) | 62 (51,69) | 0.076 |
| Heart rate (bpm) | 83 (71, 101) | 74 (64.86) | <0.001 |
| SBP (mm Hg) | 146 (130, 165) | 120 (115,133) | <0.001 |
| DBP (mm Hg) | 86 (78, 96) | 74 (69,83) | <0.001 |
| Smoking | 126 (63%) | 136 (59%) | 0.412 |
| Hypertension | 104 (52%) | 28 (12%) | <0.001 |
| Dsylipidemia | 18 (9%) | 17 (7%) | 0.543 |
| Diabetes | 60 (30%) | 19 (8%) | <0.001 |
Values are expressed as the median (interquartile range) or percentage. For group comparisons, nonparametric Mann‐Whitney tests are used for non‐normally distributed variables. Categorical variables were compared using a chi‐square test.
SBP, systolic blood pressure; DBP, diastolic blood pressure.
3.2. Comparison of lipid and glucose levels between the subjects with and without coronary atherosclerosis
The clinical and laboratory characteristics of the studied subjects with and without coronary atherosclerosis are shown in Table 2. Both the case group and control group had an equal sex and age distribution. The levels of FPG and HbA1c in AMI patients were higher than in control individuals (P < 0.001). Interestingly, there is no statistical difference between the level of TG in case group and control group. And the level of CHOL, LDL‐C in patients with coronary atherosclerosis is lower than in control individuals.
Table 2.
The levels of blood lipid and glucose in different groups
| Case group (n = 200) | Control group (n = 230) | P value | |
|---|---|---|---|
| TG (mmol/L)a | 1.36 (0.97, 2.15) | 1.21 (0.94, 1.75) | 0.235 |
| TC (mmol/L) | 4.42 ± 1.16 | 4.95 ± 0.84 | <0.001 |
| HDL‐C (mmol/L) | 1.12 ± 0.37 | 1.45 ± 0.39 | <0.001 |
| LDL‐C (mmol/L) | 2.68 ± 1.01 | 3.05 ± 0.75 | 0.004 |
| FPG (mmol/L)a | 7.85 (6.62, 10.09) | 5.15 (4.85, 5.68) | <0.001 |
| HbA1c (%)a | 6.1 (5.8, 6.8) | 5.7 (5.5, 6.0) | <0.001 |
Quantitative data of normal distribution are presented as the mean ± SD, and quantitative data of non‐normal distribution are presented as median (interquartile range). aNon‐normal distribution of continuous variables.
TG, triglyceride; TC, total cholesterol; HDL‐C, high‐density lipoprotein cholesterol; LDL‐C, low‐density lipoprotein cholesterol; FPG, fasting plasma glucose; HbA1c, glycosylated hemoglobin.
3.3. The levels of glycosylated lipoprotein in study subjects
The G‐LDL level in AMI patient was 30.08 (25.04, 40.17) (ng/mL) which was higher than that in the control individual 22.95 (18.14, 27.06) (ng/mL). The level of D‐HDL had the same result (6.26 [4.95, 7.50] vs 3.61 [2.66, 5.15] [ng/mL]) (Figure 1).
Figure 1.
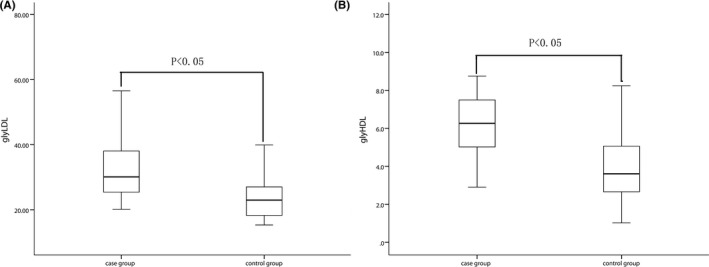
The levels of glycosylated lipoprotein in different groups. The G‐LDL level (A) and G‐HDL level (B) in AMI patients and control individuals. G‐LDL, glycosylated low‐density lipoprotein; G‐HDL, glycosylated high‐density lipoprotein; AMI, acute myocardial infarction
3.4. Analyses of G‐LDL correlation with lipid and glucose in the coronary atherosclerosis group
The Spearman correlation analyses for G‐LDL are shown in Table 3. The level of G‐LDL is correlated with FPG and HbA1c levels (P < 0.05). To the contrary, G‐LDL level is independent of the level of LDL‐C (P > 0.05).
Table 3.
The correlation analysis between G‐LDL and the blood lipid and glucosea
| r | P | |
|---|---|---|
| FPG | 0.625 | <0.05 |
| HbA1c | 0.706 | <0.05 |
| LDL‐C | 0.331 | >0.05 |
FPG, fasting plasma glucose; HbA1c, glycosylated hemoglobin; LDL‐C, low‐density lipoprotein cholesterol.
Spearman's correlation test for correlation analysis.
4. DISCUSSION
Atherosclerosis is a type of chronic progressive pathological process which lipids and blood components deposited in the arterial intima, smooth muscle cells and collagen fibrosis hypertrophied, necrosis and calcification and other degrees of lesions are involved.12 AMI caused by coronary atherosclerosis has a high rate of recurrence, disability, and mortality, which seriously threatens the physical and mental health of middle‐aged and elderly patients.3 The mechanism of AS is not fully established. The traditional view is that hyperlipidemia, especially high LDL, is a major risk factor for the development of atherosclerosis.13 However, some studies showed that blood lipid levels are not significantly related to atherosclerosis.14 At present, most studies focused on the role of modified lipoprotein especially oxidized lipoprotein in atherosclerosis.15, 16 But investigations about the glucose and glycosylated lipoprotein in atherosclerosis were scarce. Therefore, we carried out this study to access the characteristics of AMI patients with atherosclerosis and tried to explore the risk factors in the development of atherosclerosis.
In this study, AMI patients and control individuals showed no significant differences in the level of TG. The level of CHOL and LDL‐C in patients is lower than in control individuals. However, the level of FPG, HbA1c, and glycosylated lipoprotein is significantly higher in AMI patients than in control individuals. These findings are interesting and suggested that we need to fully recognize glucose level was important in the development of atherosclerosis. It is noteworthy that the G‐LDL level only has associated with FPG and HbA1c, but independent of LDL. So glucose control is very important while lowering lipids.
In recent years, the role of glucose metabolism in the development of atherosclerosis has received more and more attention.17, 18 On the one hand, hyperglycemia can directly act on vascular cells. It can promote the combination of modified lipoprotein and macrophage scavenger receptors to form foam cells which could promote the formation of atherosclerosis.19 On the other hand, hyperglycemia can cause nonenzymatic reactions of glucose with longer‐lived molecules, resulting in stable early glycosylation products. Then, they undergo a series of rearrangements, dehydration, and cleavage reactions to produce stable glycation end products, including G‐LDL, G‐HDL, and other glycosylated proteins.20 Glycosylated lipoprotein also promotes lipoprotein oxidation.16 LDL and HDL with glycosylated or oxidative modification cannot be combined with normal receptors due to structural changes.21 Modified lipoproteins can only intake cells through the scavenger receptor and cannot downregulate scavenger receptor expression.22 The modified lipoprotein can continuously ingest cells through the scavenger receptor, cause cholesterol accumulation, and eventually result in the formation of atherosclerosis.23
There were some limitations in our study, such as missing biochemical indexes, and missing information of diet and exercise. The included patients were hospitalized patients, and there might be selection bias in the study. Next, we need prospective studies to evaluate the role of glycosylated lipoprotein in the assessment and prevention of atherosclerosis.
5. CONCLUSION
In summary, the lipid level is not a major factor in the development of coronary atherosclerosis, and the level of modified lipoprotein is closely related to the development of coronary atherosclerosis. It is necessary to take action for glucose control while administering lipid‐lowering therapy.
Luo W, He Y, Ding F, et al. Study on the levels of glycosylated lipoprotein in patients with coronary artery atherosclerosis. J Clin Lab Anal. 2019;33:e22650 10.1002/jcla.22650
Funding information
Sichuan Province‐Supporting Technology Project, No. 2016SZ0044.
Luo and He contributed equally to this work.
REFERENCES
- 1. Lindahl B. Acute coronary syndrome – the present and future role of biomarkers. Clin Chem Lab Med. 2013;51(9):1699‐1706. [DOI] [PubMed] [Google Scholar]
- 2. Shiyovich A, Plakht Y, Gilutz H. Serum calcium levels independently predict in‐hospital mortality in patients with acute myocardial infarction. Nutr Metab Cardiovasc Dis. 2018;28:510‐516. [DOI] [PubMed] [Google Scholar]
- 3. Goodacre S, Cross E, Arnold J, et al. The health care burden of acute chest pain. Heart. 2005;91(2):229‐230. [DOI] [PMC free article] [PubMed] [Google Scholar]
- 4. Kaschina E, Grzesiak A, Li J, et al. Angiotensin II type 2 receptor stimulation: a novel option of therapeutic interference with the renin‐angiotensin system in myocardial infarction? Circulation. 2008;118(24):2523‐2532. [DOI] [PubMed] [Google Scholar]
- 5. Chistiakov DA, Orekhov AN, Bobryshev YV. Contribution of neovascularization and intraplaque haemorrhage to atherosclerotic plaque progression and instability. Acta Physiol. 2015;213(3):539‐553. [DOI] [PubMed] [Google Scholar]
- 6. Koulis C, Kanellakis P, Pickering RJ, et al. Role of bone‐marrow‐ and non‐bone‐marrow‐derived receptor for advanced glycation end‐products (RAGE) in a mouse model of diabetes‐associated atherosclerosis. Clin Sci. 2014;127(7):485. [DOI] [PubMed] [Google Scholar]
- 7. Colombo MG, Meisinger C, Amann U, et al. Association of obesity and long‐term mortality in patients with acute myocardial infarction with and without diabetes mellitus: results from the MONICA/KORA myocardial infarction registry. Cardiovasc Diabetol. 2015;14(1):24. [DOI] [PMC free article] [PubMed] [Google Scholar]
- 8. Yang W, Cai X, Han X, et al. Clinical characteristics of young type 2 diabetes patients with atherosclerosis. PLoS ONE. 2016;11(7):e0159055. [DOI] [PMC free article] [PubMed] [Google Scholar]
- 9. Li LX, Zhao CC, Ren Y, et al. Prevalence and clinical characteristics of carotid atherosclerosis in newly diagnosed patients with ketosis‐onset diabetes: a cross‐sectional study. Cardiovasc Diabetol. 2013;12(1):18. [DOI] [PMC free article] [PubMed] [Google Scholar]
- 10. Tagtow A, Rahavi E, Bard S, et al. Coming together to communicate the 2015‐2020 dietary guidelines for Americans. J Acad Nutr Diet. 2016;116(2):209. [DOI] [PubMed] [Google Scholar]
- 11. Damman P, Hof AWV, Berg JMT, et al. 2015 ESC guidelines for the management of acute coronary syndromes in patients presenting without persistent ST‐segment elevation: comments from the Dutch ACS working group. Neth Heart J. 2017;25(3):181‐185. [DOI] [PMC free article] [PubMed] [Google Scholar]
- 12. Tabas I, Garcíacardeña G, Owens GK. Recent insights into the cellular biology of atherosclerosis. J Cell Biol. 2015;209(1):13‐22. [DOI] [PMC free article] [PubMed] [Google Scholar]
- 13. Williams PT, Zhao XQ, Marcovina SM, et al. Levels of cholesterol in small LDL particles predict atherosclerosis progression and incident CHD in the HDL‐Atherosclerosis Treatment Study (HATS). PLoS ONE. 2013;8(2):e56782. [DOI] [PMC free article] [PubMed] [Google Scholar]
- 14. Sánchezquesada JL, Pérez A. Modified lipoproteins as biomarkers of cardiovascular risk in diabetes mellitus. Endocrinol Nutr. 2013;60(9):518. [DOI] [PubMed] [Google Scholar]
- 15. Lu H, Huang D, Yao K, et al. Insulin enhances dendritic cell maturation and scavenger receptor‐mediated uptake of oxidised low‐density lipoprotein. J Diabetes Complications. 2015;29(4):465‐471. [DOI] [PubMed] [Google Scholar]
- 16. Chistiakov DA, Melnichenko AA, Orekhov AN, et al. How do macrophages sense modified low‐density lipoproteins? Int J Cardiol. 2017;230:232‐240. [DOI] [PubMed] [Google Scholar]
- 17. Dinicolantonio JJ, Lucan SC, O'Keefe JH. The evidence for saturated fat and for sugar related to coronary heart disease. Prog Cardiovasc Dis. 2016;58(5):464‐472. [DOI] [PMC free article] [PubMed] [Google Scholar]
- 18. Li Y, Hruby A, Bernstein AM, et al. Saturated fats compared with unsaturated fats and sources of carbohydrates in relation to risk of coronary heart disease: a prospective cohort study. J Am Coll Cardiol. 2015;66(14):1538‐1548. [DOI] [PMC free article] [PubMed] [Google Scholar]
- 19. Lin Z, He Z, Feng W, et al. Immunization with advanced glycation end products modified low density lipoprotein inhibits atherosclerosis progression in diabetic apoE and LDLR null mice. Cardiovasc Diabetol. 2014;13(1):1‐12. [DOI] [PMC free article] [PubMed] [Google Scholar]
- 20. Rizwan H, Mohanta J, Si S, et al. Gold nanoparticles reduce high glucose‐induced oxidative‐nitrosative stress regulated inflammation and apoptosis via tuberin‐mTOR/NF‐κB pathways in macrophages. Int J Nanomed. 2017;12:5841‐5862. [DOI] [PMC free article] [PubMed] [Google Scholar]
- 21. Yang F, Du Y, Zhang J, et al. Low‐density lipoprotein upregulate SR‐BI through Sp1 Ser702 phosphorylation in hepatic cells. Biochem Biophys Acta. 2016;1861(9):1066‐1075. [DOI] [PubMed] [Google Scholar]
- 22. Dai Y, Condorelli G, Mehta JL. Scavenger receptors and non‐coding RNAs: relevance in atherogenesis. Cardiovasc Res. 2016;109(1):24. [DOI] [PubMed] [Google Scholar]
- 23. Rhoads JP, Lukens JR, Wilhelm AJ, et al. Oxidized low‐density lipoprotein immune complex priming of the Nlrp3 inflammasome involves TLR and FcγR cooperation and is dependent on CARD9. J Immunol. 2017;198(5):2105‐2114. [DOI] [PMC free article] [PubMed] [Google Scholar]