Abstract
Background
Lp‐PLA2 is a novel inflammation marker in cardiovascular disease. While several manufactures have registered Lp‐PLA2 activity reagents, few studies have investigated the consistency among these assays. In this study, we compared and recalibrated Lp‐PLA2 activity assays.
Methods
Serum samples from 110 patients and 140 healthy individuals were collected for method comparison and reference interval validation, respectively. Fresh human serum pools (847 and 442 U/L) were used for recalibration. Lp‐PLA2 activity was analyzed using all five assays with a Beckman AU 5800 analyzer. Passing‐Bablok regression equations and Bland‐Altman plots were used to estimate the relationship and bias among the results. A 2.5% confidence interval (CI) and 97.5% CI were used to establish a laboratory reference interval.
Results
Assay imprecision varied from 0.8%‐2.9%, while the overall coincidence rates ranged from 75.5%‐98.2%. Passing‐Bablok regression shows excellent linear correlation between Evermed and Diasys (R 2 = 0.999), while that between Diazyme and Evermed was poor (R 2 = 0.846). The R 2 and correlation coefficient r among assays were 0.846‐0.999 and 0.8947‐0.9993, respectively. The mean bias percentages ranged from −71.5%‐1.6% and −2.0%‐11.6% before and after recalibration. As Diazyme and Diasys were not comparable, the Diazyme assay was not recalibrated. The reference intervals determined for Diasys, Evermed, Hengxiao, and Zybio were 184‐605, 208‐704, 81‐328, and 273‐696 U/L, respectively.
Conclusions
Our results indicate that recalibration increased assay agreement and also highlight the need for each laboratory to establish its own reference interval for Lp‐PLA2 activity.
Keywords: atherosclerosis, Lipoprotein‐associated phospholipase A2, method comparison, recalibration, reference interval
Abbreviations
- CE
European Conformity certification
- CFDA
China Food and Drug Administration
- CI
coefficient interval
- CLSI
Clinical Laboratory and Standard Institution
- CV
coefficient variation
- CVD
cardiovascular disease
- FDA
Food and Drug Administration
- Lp‐PLA2
Lipoprotein‐associated phospholipase A2
- SD
standard deviation
1. INTRODUCTION
Cardiovascular disease (CVD) and stroke have become the most common causes of death in both developed and developing countries worldwide and represent a huge economic burden.1, 2 Both conditions are caused by atherosclerosis, which involves inflammation at various stages,3 from plaque formation to breakage.4 Therefore, numerous studies have identified and evaluated independent biomarkers, many of which are inflammatory factors, to predict the risk factors of CVD and stroke. Lipoprotein‐associated phospholipase A2 (Lp‐PLA2), for example, is a vascular inflammatory factor that has been demonstrated to be pro‐atherosclerosis and positively correlated with CVD and ischemic stroke.4, 5, 6, 7, 8, 9 These clinical studies indicate Lp‐PLA2 as an independent risk factor for these inflammation‐related conditions. In addition, another study observed that Lp‐PLA2 is associated with a higher risk of developing mild cognitive impairment in type two diabetes mellitus patients.10 Thus, this inflammatory factor can be used as an indicator of multiple diseases depending on context.
The detection of Lp‐PLA2 enzyme expression is typically performed using qualitative immunological methods, while enzyme activity is evaluated by continuous active monitoring (rate method).11 Activity monitoring, which reflects enzyme function and catalysis, is preferred over expression analysis because only a small fraction of total Lp‐PLA2, mainly HDL‐related Lp‐PLA2, is typically detected in the latter.12 The Lp‐PLA2 activity reagent PLAC (Diazyme) was the first reagent approved by the Food and Drug Administration (FDA) in December in 2014, and its performance has been verified by studies in 2016 and 2017.12, 13 Alternatively, Diasys was the first Lp‐PLA2 activity reagents registered by the China Food and Drug Administration, and several studies have shown an association between CVD and Lp‐PLA2 activity using this reagent. Furthermore, in addition to Diasys, our team has also validated the performance of Zybio, Hengxiao, and Evermed Lp‐PLA2 reagents for activity testing. We found that the performance of Diasys was superior. However, no studies to date have compared these assays in a Chinese population.
In this study, we optimized five common Lp‐PLA2 activity assays to determine the most appropriate and accurate method for detecting enzyme catalysis in CVD and healthy Chinese patients. Our analysis utilizes two different levels of Lp‐PLA2 activity to test and improve harmonization. To our knowledge, this study is the first to compare, recalibrate, and apply these assays to study the use of Lp‐PLA2 as a CVD risk factor.
2. MATERIALS AND METHODS
2.1. Patients and samples
A total of 110 blood samples were collected from patients from May to August 2017 at Peking Union Medical College Hospital (PUMCH). These samples comprised 49 males (57.9 ± 14.3 years) and 61 females (57.9 ± 14.3 years). The reference interval was also validated in 140 apparently healthy individuals undergoing medical examination from March to May 2017 at PUMCH. This included 72 males (44.3 ± 13.2 years) and 68 females (44.2 ± 13.5 years). The blood samples were collected in serum separator tubes and centrifuged at 3000 rpm/minute for 10 minutes. Two levels of mixed serum for Lp‐PLA2 activity were used to evaluate imprecision according to the Clinical Laboratory Standard Institution (CLSI).14 All of the samples were stored at −80°C to ensure stability until the analysis time. This study was reviewed and approved by the local Ethics Committee at the Peking Union Medical College Hospital. All of the experimental samples were collected from residual serum samples after routine clinical testing without informed consent.
2.2. Instrument and reagents
Five commercially available Lp‐PLA2 activity rate assays (Table 1) were analyzed in conjunction with a Beckman AU5800 automatic analyzer. Diasys Lp‐PLA2 activity reagent (Diasys Diagnostic Systems (Shanghai) Co., Ltd. Germany), Evermed Lp‐PLA2 activity reagent (Suzhou Evermed Biomedical Co., Ltd., Zhejiang, China), Hengxiao Lp‐PLA2 reagent (Chang Chun Heng Xiao Biological Science and Technology Co., Ltd., Jilin, China), Zybio Lp‐PLA2 activity reagent (Zybio Co., Ltd., Chongqing, China), and Diazyme (DiaDexus Inc, San Francisco, CA, USA, Catalog no. 10‐0135) were evaluated.
Table 1.
Performance characteristics of the five Lp‐PLA2 activity reagents analyzed in this study
| Calibration curve | Assay precision | Linearity | Reference interval | Approved by | |
|---|---|---|---|---|---|
| Diasys | 1‐point | Total CV% <3% | 50‐1600 U/L |
Female: 194‐640 U/L (18‐49 y) 208‐698 U/L (50‐88 y) Male: 230‐728 U/L |
CE & CFDA |
| Evermed | 2‐point | Intraassay CV ≤5.0% | 50‐1600 U/L | ≤670 U/L | CFDA |
| Hengxiao | 1‐point & 5‐point | Repeatability ≤5% | 10‐380 U/L | ≤220 U/L | CFDA |
| Zybio | 1‐point | Intraassay CV ≤5, interassay CV ≤10% | 10‐1500 U/L | <659 U/L | CFDA |
| Diazyme | 5‐point | Total CV% <3% | 10 nmol/min/mL ‐ 320 nmol/min/mL | <225 nmol/min/mL | FDA |
CE, European Conformity certification; CFDA, China Food and Drug Administration; CV, coefficient variation; FDA, Food and Drug Administration.
The basic principle for all of the enzymatic Lp‐PLA2 activity assays is as follows15: Lp‐PLA2 in the serum hydrolyzes the sn‐2 position of the substrate, 1‐myristoyl‐2‐(4‐nitrophenyl succinyl) phosphatidylcholine, to produce a colored reaction product, 4‐nitrophenol. The formation rate of 4‐nitrophenol is measured spectrophotometrically, and Lp‐PLA2 activity is calculated from the rate of change in the absorbance. For each assay, the supplied reagents were used, and the calibration methods and experimental assays were performed based on the manufacturer's instructions. All samples were measured only after quality control was measured and confirmed to fall in an acceptable range.
2.3. Precision
Assay precision was evaluated using two different residual serum samples with known Lp‐PLA2 activity according to the CLSI.14 A total of four replicates of each sample were measured for five consecutive days. We calculated the repeatability (CV%) and within‐laboratory precision (CV%).
2.4. Method comparison among assays
For method comparison, Lp‐PLA2 activity was measured twice using each assay within one analytical run to obtain an average value. As we previously verified the use of Diasys, we used this reagent as a comparative measurement procedure or method for comparison analysis. Analytical evaluation was performed using the Passing‐Bablok and Bland‐Altman methods to calculate the linear regression equation and bias (%) among the detection systems. We regarded the Diasys reference interval (728 U/L) as the medical threshold.
2.5. Reference interval comparison
The reference interval was validated in 140 apparently healthy individuals according to CLSI C28‐A2.16 A 2.5% confidence interval (CI) and 97.5% CI were used as the reference interval established by the laboratory.
2.6. Method comparison after recalibration
If the linear regression R 2 between assays was <0.95, then the methods were not comparable, and recalibration was unnecessary. For comparable assays, fresh serum (847 U/L, determined with Diasys) was used to recalibrate the assays. The recalibration methods were then used to re‐measure the same 110 patient serum samples. In order to ensure recalibration accuracy, fresh serum (442 U/L, determined with Diasys) was also used to recalibrate the assays. The second round of recalibrated methods was used to measure another 30 fresh serum samples, and each sample was detected twice.
2.7. Cut‐offs for Lp‐PLA2 activity and categorization
There are currently no established cut‐offs for Lp‐PLA2 activity available to determine if a patient is at risk for developing CVD or cerebrovascular disease. Only the cut‐offs provided by the manufacturers of each assay are available. Notably, the cut‐offs for Evermed, Hengxiao, Zybio, and Diazyme are 670, 220, 659, and 225 U/L, respectively. The cut‐off for Diasys varies with age and sex, with females ranging from 194‐640 U/L (18~49 years of age) and 208‐698 U/L (50~88 years of age) and males ranging from 230‐728 U/L. Values below and above the cut‐offs were considered normal and above the limit, respectively. The coincidence rate in this analysis refers to whether the results of the specified assay were evaluated in the same category as another assay.
2.8. Statistical analysis
All statistical analyses were performed using SPSS 20.0 (SPSS Inc., Chicago, IL, USA), Microsoft Excel 2016 (Microsoft Corporation, USA), and/or MedCalc statistical software (Broekstraat, Mariakerke, Belgium). Method comparison was performed using a Bland‐Altman plot with various methods. Passing‐Bablok regression was used to analyze the correlation between Diasys and the other assays. The coincidence rate was based on the Kappa coincidence test for evaluation. If the Kappa value ≥0.75, the coincidence between the two assays was considered to be excellent. Continuous data are presented as the means ± standard deviation or median (range, 95% CI), as appropriate. The Pearson r was used as a rough estimate of the correlation among assays. If the R 2 < 0.95 in the linear regression equation, the methods were not comparable. If the bias (%) between each assay and Diasys was greater than 17% at the level of medical decision, the methods were not comparable. A P < 0.05 was considered statistically significant.
3. RESULTS
3.1. Precision
The repeatability CV% and within‐laboratory CV% of the five Lp‐PLA2 assays investigated in this study were both lower than 3% (Table 2).
Table 2.
Precision of the Diasys, Evermed, Hengxiao, Diazyme, and Zybio assays
| Manufacturer | Pool‐1 | Pool‐2 | ||||
|---|---|---|---|---|---|---|
| Mean (U/L) (±SD) | Within‐laboratory CV% | Interassay CV% | Mean (U/L) (±SD) | Repeatability CV% | Within‐laboratory CV% | |
| Diasys | 512 ± 10.5 | 1.3% | 1.6% | 1068 ± 24.5 | 1.6% | 1.9% |
| Evermed | 524 ± 7.7 | 0.9% | 1.6% | 1094 ± 21.5 | 1.6% | 2.9% |
| Hengxiao | 151 ± 2.3 | 1.6% | 2.6% | 247 ± 5.0 | 2.6% | 1.9% |
| Zybio | 597 ± 10.6 | 1.1% | 1.1% | 1045 ± 24.0 | 1.1% | 1.9% |
| Diazyme | 140 ± 2.0 | 0.8% | 1.1% | 195 ± 2.1 | 1.1% | 2.0% |
Lp‐PLA2 activity is present as the means ± standard deviations using two known Lp‐PLA2 activities for residual fresh serum. Repeatability and within‐laboratory CV% are shown as the percentage of the coefficient of variation.
CV, coefficient variation.
3.2. Patients sample distribution
The Lp‐PLA2 activity of the 110 patient samples ranged from 109 to 1779 U/L when Diasys was used for detection. Figure 1 shows the distribution of Lp‐PLA2 activity for the same 110 individuals measured by five separate assays.
Figure 1.
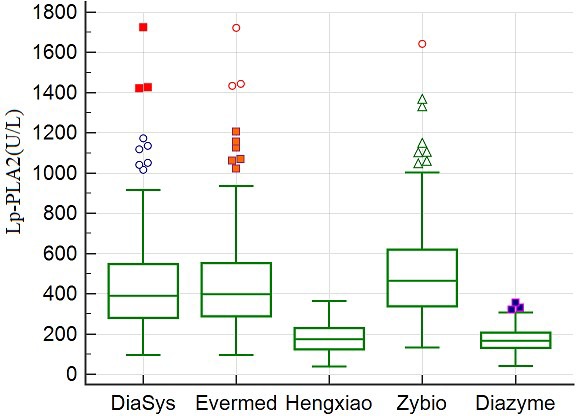
Distribution of Lp‐PLA2 activity in 110 patients measured by different assays
3.3. Coincidence rate of Lp‐PLA2 activity measured using various assays
The coincidence rates of Diasys, Hengxiao, Zybio, and Evermed are shown in Table 3. The overall coincidence rates and Kappa index of Lp‐PLA2 activity results ranged from 75.5% to 98.2% and 0.441 to 0.936 (all P < 0.001), respectively.
Table 3.
Coincidence rate of Lp‐PLA2 activity of 110 samples measured by various assays
| Diasys | Evermed | Hengxiao | Diazyme | Zybio | ||||||||
|---|---|---|---|---|---|---|---|---|---|---|---|---|
| AL | Normal | Total | AL | Normal | Total | AL | Normal | Total | AL | Normal | Total | |
| AL (n) | 18 | 0 | 18 | 18 | 0 | 18 | 18 | 0 | 18 | 16 | 2 | 18 |
| Normal (n) | 2 | 90 | 92 | 27 | 65 | 92 | 5 | 87 | 92 | 3 | 89 | 92 |
| Total (n) | 20 | 90 | 110 | 45 | 65 | 110 | 23 | 87 | 110 | 20 | 91 | 110 |
| Kappa | 0.936a | 0.441a | 0.851a | 0.838a | ||||||||
| Coincidence rate (%) | 98.2% | 75.5% | 95.5% | 95.5% | ||||||||
AL, above the limit.
P < 0.001.
3.4. Reference interval and method comparison
Lp‐PLA2 activity of 140 apparently healthy individuals was measured using Diasys, Evermed, Hengxiao, and Zybio to compare the reference intervals stated by the manufacturers (Table 1) and those established in the laboratory (Table 4). The reference intervals established by the laboratory for Diasys, Evermed, Hengxiao, and Zybio, were 184‐605, 208‐704, 81‐328, and 273‐696 U/L, respectively.
Table 4.
Reference interval established by our laboratory
| Gender | Age (y) | Diasys (U/L) (±15%) | Evermed (U/L) (±15%) | Hengxiao (U/L) (±15%) | Zybio (U/L) (±15%) | |
|---|---|---|---|---|---|---|
| Male | All | N | 68 | 68 | 68 | 68 |
| 2.5% CI | 192 (163, 220) | 218 (185, 250) | 84 (71, 97) | 318 (270, 48) | ||
| 97.5% CI | 636 (540, 731) | 736 (626, 846) | 334 (284, 384) | 714 (607, 821) | ||
| Female | ≤49 | N | 43 | 43 | 43 | 43 |
| 2.5% CI | 41 (35, 47) | 39 (33, 45) | 4 (3, 5) | 184 (156, 212) | ||
| 97.5% CI | 537 (456, 618) | 611 (519, 703) | 279 (237, 321) | 624 (531, 719) | ||
| >50 | N | 29 | 29 | 29 | 29 | |
| 2.5% CI | 217 (184, 250) | 245 (208, 282) | 93 (79, 107) | 265 (225, 305) | ||
| 97.5% CI | — | — | — | — | ||
| All | N | 140 | 140 | 140 | 140 | |
| 2.5% CI | 184 (156, 212) | 208 (177, 239) | 81 (69, 93) | 273 (232, 313) | ||
| 97.5% CI | 605 (514, 696) | 704 (598, 810) | 328 (279, 377) | 696 (591, 800) |
—, No result due to missing data.
Measurement correlation between different assays was analyzed for each sample using a Passing Bablok plot. The regression equation, determination coefficients, and R 2 for the assay comparisons are shown in Figure 2. Notably, the assays were correlated at various levels, with correlation coefficients ranging from 0.895 to 0.999. In comparison Diasys, we observed linear relationships between this assay and all of the other assays (R 2 > 0.988), with the exception of Diazyme (R 2 = 0.846). This discrepancy may be due to the different reagent composition or traceability.
Figure 2.
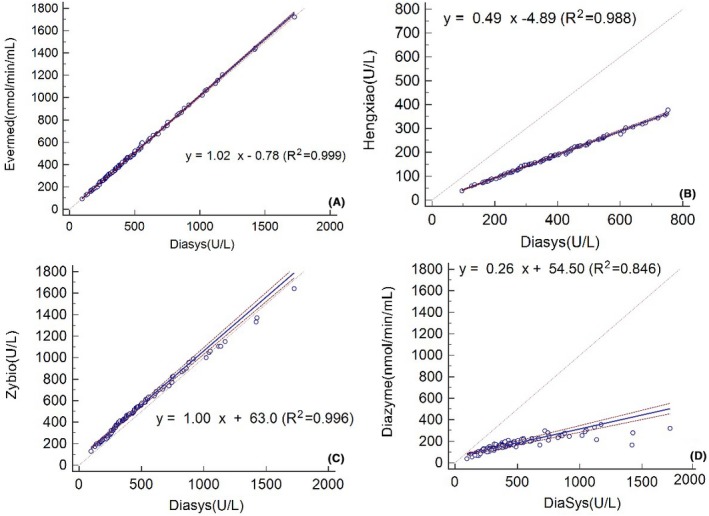
Passing‐Bablok regression between various Lp‐PLA2 assays. The dashed lines indicate the 95% confidence interval (CI), while the dotted line represents identity (X = Y)
The Bland‐Altman method was also used to compare the methods (Figure 3), and significant variability was observed among the assays. The mean bias (%) for each assay compared to Diasys varied from −85.8% to 14.5%. Furthermore, at the level of medical decision, the bias (%) varied from −484.22 U/L (−66.51%) to 13.78 U/L (1.89%) (Table 5).
Figure 3.
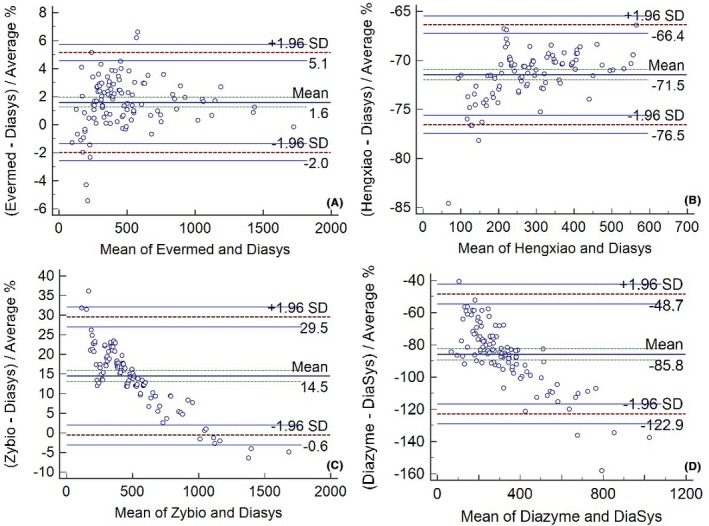
Bland‐Altman plot of the Lp‐PLA2 levels measured by various assays
Table 5.
Bias and bias percentage (%) among assays at the level of medical decision
| Supporting calibrator | Bias | Bias (%) | Using 847 U/L recalibration | Bias | Bias (%) | |
|---|---|---|---|---|---|---|
| A | y = 1.02x − 0.78 (R² = 0.999) | 13.78 | 1.89 | y = 0.95x + 25.08 (R² = 0.991) | −11 | 1.55 |
| B | y = 0.49x − 4.89 (R² = 0.988) | −376 | −51.67 | y = 0.98x + 0.93 (R² = 0.993) | −14 | −1.87 |
| C | y = 1.00x + 63.0 (R² = 0.996) | 63 | 8.65 | y = 0.79x + 84.08 (R² = 0.953) | −69 | −9.45 |
| Supporting calibrator | Bias | Bias (%) | Using 442 U/L recalibration | Bias | Bias (%) | |
|---|---|---|---|---|---|---|
| A | y = 1.11x − 5.27 (R 2 = 0.999) | 75 | 10.28 | y = 0.999x + 3.26 (R² = 0.999) | −3 | −0.35 |
| B | y = 0.48x + 6.5 (R² = 0.998) | −372 | −51.11 | y = 0.98x + 15.92 (R² = 0.998) | −1.36 | −0.19 |
| C | y = 0.88x + 127.03 (R 2 = 0.996) | 40 | 5.50 | y = 0.85x + 130.87 (R² = 0.996) | 22 | 2.97 |
A, B, and C represent comparisons between Evermed and Diasys, Evermed and Hengxiao, and Evermed and Zybio, respectively.
3.5. Harmonization through recalibration
After recalibration (847 U/L), the Passing‐Bablok and Bland‐Altman analyses were performed once again (Figure 4). The correlation coefficient r values for the assays ranged from 0.953 to 0.993 after recalibration. Notably, the Bland‐Altman analysis of Lp‐PLA2 activity measured with Hengxiao indicates an improvement, with a mean bias of 2.0%. After additional recalibration at the level of medical decision, the bias (%) varied from −69 U/L (−9.45%) to −11.0 U/L (−1.55%) (Table 5).
Figure 4.
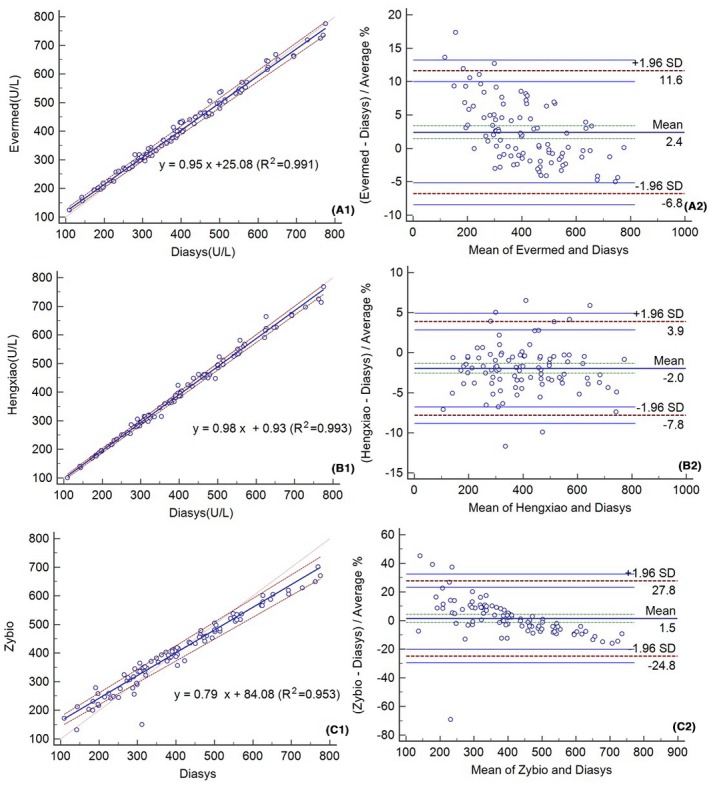
Passing‐Bablok regressions (A1‐C1) and Bland‐Altman plots (A2‐C2) after recalibration using 847 U/L fresh serum
Moreover, we also tested the linear relationship between assays before (Figure 5) and after recalibration using 442 U/L Lp‐PLA2 fresh serum (Figure 6). The correlation between assays was good (R 2 > 0.996). The mean bias (±1.96 SD) before and after this recalibration was 9.3% (2.2%, 16.5%) and 0.5% (−2.6%, 3.5%) for Evermed compared to the mean of Evermed and Diasys, −69.6% (−83.8%, 55.3%) and 0.1% (−5.7%, 6.0%) for Hengxiao compared to the mean of Hengxiao and Diasys, and 16.5% (−34.4%, 67.5%) and 14.2% (−41.3%, 69.6%) for Zybio compared to the mean of Zybio and Diasys (Figures 5 and 6). The Bland‐Altman analysis of Lp‐PLA2 measured by Evermed and Hengxiao showed improvement after this recalibration. Compared to Diasys, the bias (%) before and after recalibration using 442 U/L fresh serum were 75 U/L (10.28%) and −3 U/L (−0.35%) for Evermed, −372 U/L (−51.11%) and −1.36 (−0.19%) for Hengxiao, and 40 U/L (5.5%) and 22 U/L (2.97%) for Zybio at the level of medical decision (728 U/L) (Table 5).
Figure 5.
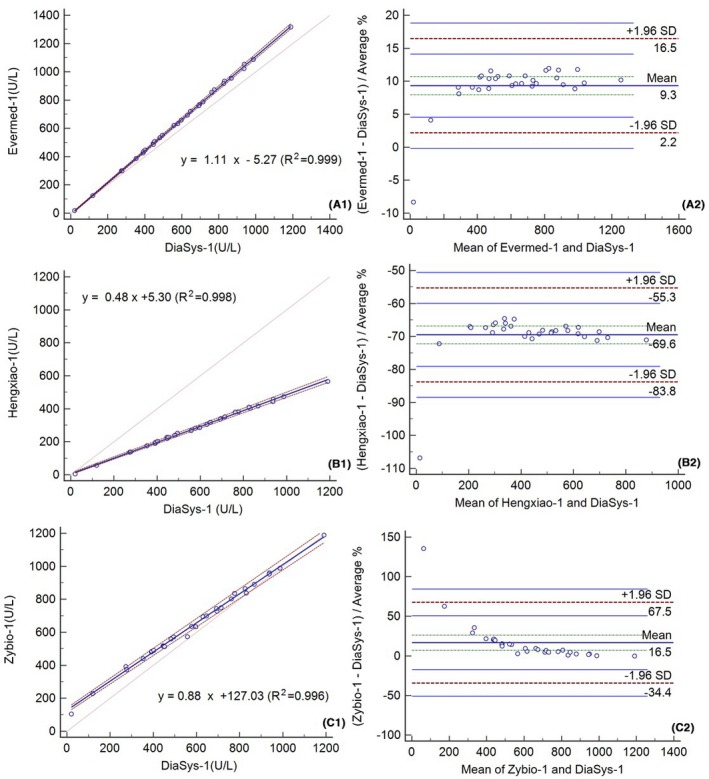
Passing‐Bablok regressions (A1‐C1) and Bland‐Altman plots (A2‐C2) for 30 specimens after recalibration
Figure 6.
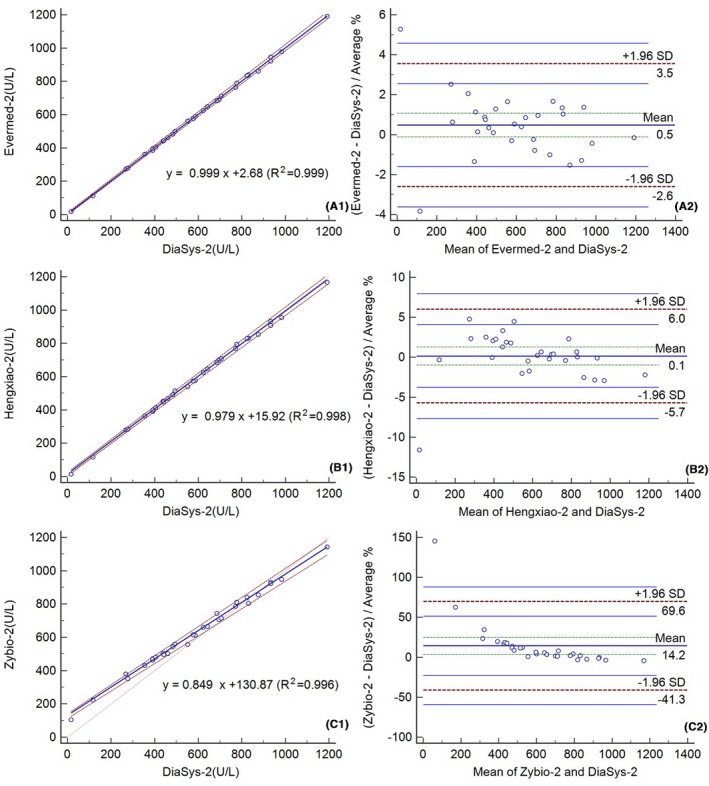
Passing‐Bablok regressions (A1‐C1) and Bland‐Altman plots (A2‐C2) after recalibration with 442 U/L fresh serum
4. DISCUSSION
There are many published studies showing the relationship between Lp‐PLA2 activity and disease, but fewer on the performance or coincidence of the assays used to measure Lp‐PLA2 activity. The studies that have evaluated performance have mainly utilized Diazyme‐based assays. However, in order to compare data across studies, it is vital to unify the detection method, and if possible, optimize the reagents used to provide the most accurate measurement of Lp‐PLA2 activity. Thus, in this study, we compared five Lp‐PLA2 assays and recalibrated the comparable assays using two different known Lp‐PLA2 activities (847 U/L and 442 U/L) in fresh serum. To our knowledge, this study is the first to try to improve Lp‐PLA2 activity harmonization using fresh serum.
Our results show that the upper limit of the reference interval for Hengxiao established in our laboratory was higher than that stated by the manufacturer. In fact, the manufacturer claims that the linear range of Hengxiao is 10 to 380 U/L, which is lower than that of other assays because it utilizes a different assignment method. Because of these differences, we removed samples with values above 380 U/L from the Hengxiao assay before recalibration. Therefore, only 96 samples were used for comparison between Hengxiao and Diasys. These differences in linear range were not altogether surprising as several studies have demonstrated that the reference interval of Lp‐PLA2 activity may be influenced by race, sex, age, and menopause.17 Thus, we recommend that each laboratory develops their own reference interval and diagnostic cut‐off value according to their own treatment population. During clinical evaluation, method‐specific reference intervals are also problematic, particularly for patients who visit different hospitals and/or are seen by different doctors. Furthermore, although measuring Lp‐PLA2 activity can help provide guidance for early disease care and prevention,6 it can only be used as a reliable risk factor if is monitored accurately and consistently. It is also important to note that there is currently no published reference medical decision level that can be used as an indicator for CVD or stroke. Therefore, in the present study, it was necessary to use the reference interval stated by the assay manufacturers to evaluate the risk compared to the coincidence rate.
Notably, Lp‐PLA2 is not a novel index, but the enzyme method for Lp‐PLA2 activity was only approved by FDA in 2015,12 and less research has focused on the medical decision level. Diasys was previously approved in China and was used as a reference assay in this study. The reference interval of Diasys was classified according to sex and age (menopausal), and we selected the higher reference interval as the medical decision level to compare the bias and observe the clinical acceptance. The biological variation of Lp‐PLA2 activity has been studied in 2017.18 Thus, 17% was used as the biological variation to determine the acceptance bias at the medical decision level.18
Our results indicate that the consistency between Diazyme‐ and Diasys‐based assays is poor. One reason for this might be the different traceability levels of the reagents. As they were inconsistent, it was not useful to recalibrate the Diazyme methods with fresh serum. As the other assays were more comparable to Diasys, they were used for recalibration using two fresh serum samples containing Lp‐PLA2 activity equal to 847 U/L and 442 U/L. As there are currently no standard materials and methods available for these procedures, we analyzed the assays that were recalibrated using fresh serum pools. After recalibration, a good relationship was observed among the Lp‐PLA2 activity levels measured by different assays (R 2 > 0.95). Recalibration also helped improve the differences in bias between the Hengxiao‐ and Diasys‐based assays. However, the differences in bias did not improve between Zybio and Diasys during either of the two recalibration procedures. This is likely because the calibrator value for Zybio is below 800 U/L. Moreover, while the differences in bias between Evermed and Diasys did not improve using 847 U/L to recalibrate, they were improved when using 442 U/L. Although the results of recalibration varied, they highlight an important issue during this procedure, namely that when using fresh serum to recalibrate different assays, the calibrator value should be selected carefully to ensure that the results are reliable. The bias among all assays was lower than 17% at the medical level of 728 U/L.
The quality of the measured materials is also important when assaying for Lp‐PLA2 activity. The most commutable materials are serum pools prepared according to the C37‐A guidelines.19 Another commutable material, while lower in quality, is residual clinical samples, which are more easily obtained for research purposes. Thus, in the present study, serum pools were prepared as commutable materials for harmonization. In fact, fresh serum without mixing was shown to be the better commutable material among the different assays.
Although our research has reached its aims of comparing and optimizing commonly used Lp‐PLA2 assays, this study does have some limitations. For instance, all analyses were performed on the same instrument. This could introduce instrument‐based biases or inconsistencies. In other studies, researchers typically use two different automatic analyzers to test the same samples to verify the accuracy for a single Lp‐PLA2 reagent. This is the optimal method when no gold‐standard material or method is available. Thus, in the future, it would be best to explore the comparisons made in the present study with a different analyzer. Furthermore, our primary conclusions are based on the use of Diasys as a standard method to which all of the other assays were compared. As there is currently no recognized medical decision level or threshold for Lp‐PLA2 activity, the only way to compare the methods was to designate one assay as the standard level. Although this study does have limitations, it still improves our current protocols for measuring Lp‐PLA2 activity using fresh serum samples.
In conclusion, we optimized five common assays to determine the most appropriate, accurate, and comparable methods for detecting Lp‐PLA2 activity in patients and healthy Chinese individuals. Our results indicate that using fresh serum improved the comparability among assays, and it is vital to establish secondary materials to improve assay consistency. Taken together, our data emphasize the importance of establishing a reference method, extracting pure material, and using a unified traceability approach. While limitations exist and additional work is necessary, this study does provide essential information concerning the optimal assay conditions to measure Lp‐PLA2 activity and highlights potential issues when comparing data across studies.
ETHICS APPROVAL AND CONSENT TO PARTICIPATE
This study was reviewed and approved by the local Ethics Committee of Peking Union Medical College Hospital (S‐k336). All samples were collected from residual serum samples after clinical routine testing without informed consent.
AVAILABILITY OF DATA AND MATERIALS
The data supporting our findings can be obtained on request to the corresponding author.
AUTHORS’ CONTRIBUTIONS
LQ, DCW, LAH, XZG, TTY, HLL, and SLY conceived and designed the experiments. DCW, LAH, YCY, TTY, HLL, and XQC participated in the acquisition of data. DCW, XZG, XQC, LYX, and LQ analyzed and interpreted the data. DCW, LQ, LAH, TTY, HLL, XZG, YYC, and SLY contributed reagents/materials/analysis tools. DCW, LAH, XZG, LQ, and XQC wrote the manuscript. All authors have read and approved the final manuscript.
ACKNOWLEDGMENTS
We are grateful to the participants in the survey.
Wang D, Guo X, Hou L, et al. Measuring lipoprotein‐associated phospholipase A2 activity in China: Protocol comparison and recalibration. J Clin Lab Anal. 2019;33:e22628 10.1002/jcla.22628
Wang, Guo and Hou contributed equally to this study.
REFERENCES
- 1. He J, Gu D, Wu X, et al. Major causes of death among men and women in China. N Engl J Med. 2005;353:1124‐1134. [DOI] [PubMed] [Google Scholar]
- 2. Lloyd‐Jones D, Adams R, Carnethon M, et al., . Heart disease and stroke statistics–2009 update: a report from the American Heart Association Statistics Committee and Stroke Statistics Subcommittee. Circulation. 2009;119:480‐486. [DOI] [PubMed] [Google Scholar]
- 3. Weissberg PL, Bennett MR. Atherosclerosis–an inflammatory disease. N Engl J Med. 1999;340:1928‐1929. [PubMed] [Google Scholar]
- 4. Cai A, Zheng D, Qiu R, Mai W, Zhou Y. Lipoprotein‐associated phospholipase A2 (Lp‐PLA(2)): a novel and promising biomarker for cardiovascular risks assessment. Dis Markers. 2013;34:323‐331. [DOI] [PMC free article] [PubMed] [Google Scholar]
- 5. Ait‐Oufella H, Mallat Z, Tedgui A. Lp‐PLA2 and sPLA2: cardiovascular biomarkers. Med Sci (Paris). 2014;30:526‐531. [DOI] [PubMed] [Google Scholar]
- 6. Kocak S, Ertekin B, Girisgin AS, et al. Lipoprotein‐associated phospholipase‐A2 activity and its diagnostic potential in patients with acute coronary syndrome and acute ischemic stroke. Turk J Emerg Med. 2016;17:56‐60. [DOI] [PMC free article] [PubMed] [Google Scholar]
- 7. Li D, Wei W, Ran X, et al. Lipoprotein‐associated phospholipase A2 and risks of coronary heart disease and ischemic stroke in the general population: a systematic review and meta‐analysis. Clin Chim Acta. 2017;471:38‐45. [DOI] [PubMed] [Google Scholar]
- 8. Yang L, Liu Y, Wang S, Liu T, Cong H. Association between Lp‐PLA2 and coronary heart disease in Chinese patients. J Int Med Res. 2017;45:159‐169. [DOI] [PMC free article] [PubMed] [Google Scholar]
- 9. Younus A, Humayun C, Ahmad R, et al. Lipoprotein‐associated phospholipase A2 and its relationship with markers of subclinical cardiovascular disease: a systematic review. J Clin Lipidol. 2017;11:328‐337. [DOI] [PubMed] [Google Scholar]
- 10. Cai R, Huang R, Han J, et al. Lipoprotein‐associated phospholipase A2 is associated with risk of mild cognitive impairment in Chinese patients with type 2 diabetes. Sci Rep. 2017;7:12311. [DOI] [PMC free article] [PubMed] [Google Scholar]
- 11. Zhuo S, Wolfert RL, Yuan C. Biochemical differences in the mass and activity tests of lipoprotein‐associated phospholipase A2 explain the discordance in results between the two assay methods. Clin Biochem. 2017;50:1209‐1215. [DOI] [PubMed] [Google Scholar]
- 12. Donato LJ, Meeusen JW, Callanan H, Saenger AK, Jaffe AS. Advantages of the lipoprotein‐associated phospholipase A2 activity assay. Clin Biochem. 2016;49:172‐175. [DOI] [PubMed] [Google Scholar]
- 13. De Stefano A, Mannucci L, Massoud R, Bernardini S, Cortese C. Performance characteristics of lipoprotein‐associated phospholipase A2 activity assay on the Dimension Vista analyser and preliminary study of a healthy Italian population. Biochem Med (Zagreb). 2017;27:030701. [DOI] [PMC free article] [PubMed] [Google Scholar]
- 14. Carey RN, George H, Hartmann AE, et al., . User Demonstration of Performance for Precision and Accuracy: Approved Guideline (EP15‐A), 21, No 25. Wayne, PA: CLSI; 2001. [Google Scholar]
- 15. PDmsp . Enzyme assay for the quantitative determination of lp‐pla2 activity in human plasma or serum 2015.
- 16. Krouwer JS, Tholen DW, Garber CC, et al., . Method Comparison and Bias Estimation Using Patient Samples; Approved Guideline, Second Edition (EP9‐A2), 22 No 19. Wayne, PA: CLSI; 2002. [Google Scholar]
- 17. Brilakis ES, Khera A, McGuire DK, et al. Influence of race and sex on lipoprotein‐associated phospholipase A2 levels: observations from the Dallas Heart Study. Atherosclerosis. 2008;199:110‐115. [DOI] [PMC free article] [PubMed] [Google Scholar]
- 18. Donato LJ, Meeusen JW, Jenkins SM, et al. Biological variability of lipoprotein‐associated phospholipase A2 activity in healthy individuals. Clin Biochem. 2017;50:347‐349. [DOI] [PubMed] [Google Scholar]
- 19. Myers GL, Eckfeldt JH, Greenberg N, Levine JB, Miller WG, Wiebe DA, CLSI . Preparation and Validation of Commutable Frozen Human Serum Pools as Secondary Reference Materials for Cholesterol Measurement Procedures; Approved Guideline (C37‐A), 19 No 25. Wayne, PA: CLSI; 1999. [Google Scholar]
Associated Data
This section collects any data citations, data availability statements, or supplementary materials included in this article.
Data Availability Statement
The data supporting our findings can be obtained on request to the corresponding author.


