Abstract
Objective
The aim of this study was to investigate the spatiotemporal expression and potential role of p75NTR in tooth morphogenesis and tissue mineralization.
Materials and methods
The dynamic morphology of the four stages (from the beginning of E12.5 d, then E13.5 d and E15.5 d, to the end of E18.5 d) was observed, and the expressions of p75NTR and Runx2 were traced. The ectomesenchymal stem cells (EMSCs) were harvested in vitro, and the biological characteristics were observed. Moreover, the mineralization capability of EMSCs was evaluated. The relations between p75NTR and ALP, Col‐1 and Runx2 were investigated.
Results
The morphologic results showed that the dental lamina appeared at E12.5 d, the bud stage at E13.5 d, the cap stage at E15.5 d and the bell stage at E18.5 d. p75NTR and Runx2 showed the similar expression pattern. EMSCs from the four stages showed no significant difference in proliferation. But the positive rate of p75NTR in the E12.5 d cells was significantly lower than that in the other three stages (P < 0.05). Moreover, the higher positive rate of p75NTR the cells were, the stronger mineralization capability they showed. p75NTR was well positively correlated with the mineralization‐related markers ALP, Col‐1 and Runx2, which increased gradually with the mature of dental germs.
Conclusion
p75NTR might play an important role in the regulation of tooth morphogenesis, especially dental hard tissue formation.
Keywords: ectomesenchymal stem cells, epithelial, mesenchymal interaction, mineralization, p75 neurotrophin receptor, tooth morphogenesis
1. INTRODUCTION
p75 neurotrophin receptor (p75NTR), a well‐conserved transmembrane proneurotrophin/neurotrophin receptor, plays critical roles in morphogenetic processes in many embryonic and adult tissues.1, 2 It was well reported to bind to all the neurotrophins (NTs) with low affinity. NTs are a family of growth factors which include nerve growth factor (NGF), brain‐derived neurotrophic factor (BDNF), neurotrophin‐3 (NT‐3) and neurotrophin‐4 (NT‐4). Evidence shows that p75NTR bonding pro‐NTs associated with sortilin could directly activate signalling cascades regulating cell apoptosis.3 In contrast, bonding to mature NTs, the association of p75NTR to tyrosine receptor kinases (Trk) (another neurotrophin receptor) promotes neuronal cell survival.4 The role of p75NTR is not limited to the nervous system, however, as it may have various biological functions in non‐neuronal tissues during development, especially tooth morphogenesis.5, 6
Various experimental observations show that the epithelial–mesenchymal interaction triggers tooth morphogenesis during embryonic development. In developing tooth, the ectomesenchymal stem cells (EMSCs), originating from the cranial neural crest (CNC), differentiate into various mesenchymal cell lines such as pre‐odontoblasts, dental papilla cells and dental follicle cells, subsequently giving rise to dentine, pulp, cementum and periodontal ligaments.7, 8, 9 And the interacted dental epithelial cells differentiate into ameloblast, forming enamel. Then, the whole tooth is generated. p75NTR is highly expressed in CNC cells and reported to be a reliable marker for EMSCs from CNC.10 Moreover, evidence showed that p75NTR is not only used to select the cells originating from CNC,11 but also to participate in the regulation of tooth morphogenesis.6, 12 In our previous studies, both histological and molecular biological evidence suggested that p75NTR plays an important role in the initiation of tooth morphogenesis.13, 14 However, its definite effects and molecular mechanism are not clear yet. Recent studies reported that p75NTR enhanced the expression of the mineralization‐related markers Osteric, BSP, OCN and promote the mineralization of mesenchymal stem cells.15, 16 There was also an adverse study by Mikami et al17 that the expression of p75NTR in dental pulp stem cells was negatively correlated with that of Runx2, OSX, ALP, and BSP, implying an inhibition of mineralization. Taken together, results from previous studies imply diverse roles of p75NTR in regulation of cellular processes during tooth development and further studies are needed.
The available data suggest that the p75NTR plays more roles than it has been until recently assigned. The present study was conducted to investigate the spatiotemporal expression of p75NTR in the early tooth development. Furthermore, we examined the potential effect of p75NTR in tooth morphogenesis and tissue mineralization, which would contribute to reveal the molecular mechanism of tooth development and promote dental tissue engineering.
2. MATERIALS AND METHODS
2.1. Experimental animals
Sprague Dawley (SD) rats were provided by the Third Military Medical University Animal Laboratory. The presence of a vaginal plug is considered embryonic day 0.5 (E 0.5 d). All procedures were approved by the Medical Ethics Committee of the Third Military Medical University.
2.2. Immunohistochemistry
The embryonic maxillofacial processes were dissected from the E12.5 d, E13.5 d, E15.5 d and E18.5 d rats and fixed in 4% paraformaldehyde. The 6‐μm sections of tissue specimens were obtained for haematoxylin and eosin (HE) staining and immunostaining. The primary antibodies were used as follows: rabbit anti‐rat monoclonal p75NTR (1:1500; Abcam, Cambridge, MA, USA), rabbit anti‐rat polyclonal Runx2 antibody (1:1500; Abcam, Cambridge, MA, USA) and rabbit anti‐rat polyclonal GAPDH antibody (1:2000; Immunoway, Plano, TX, USA). Then, the specimens were treated with the DAB Detection Kit Streptavidin‐Biotin (ZSGB, Beijing, China) according to the manufacturer's protocols, followed by visualization under phase contrast microscopy.
2.3. Isolation and culture of EMSCs
The embryonic maxillofacial processes were dissected from the total 20 embryos of the four rats for each development stage (E12.5 d, E13.5 d, E15.5 d and E18.5 d). The molar area tissue was minced and digested with 1% trypsin/1 mmol/L EDTA solution (Sigma, St. Louis, MO, USA) at 37°C for 10 minutes and neutralized with Dulbecco's modified Eagle's medium/Ham's F12 (DMEM/F12) (Gibco, Waltham, MA, USA) containing 10% foetal bovine serum (FBS) (Gibco Waltham, MA USA). Cell suspension was filtered through a 75‐μm mesh filter (BD Biosciences, Franklin Lakes, NJ, USA) to remove tissue debris. The suspension was then centrifuged at 800 rpm for 5 minutes. The cell pellet was resuspended in DMEM/F12 supplemented with 10% FBS and antibiotics (100 μg/mL penicillin and 100 μg/mL streptomycin) and then cultured at 37°C in a 5% CO2 humidified incubator.
2.4. CCK‐8 proliferation assay
The proliferation rate of E12.5 d, E13.5 d, E15.5 d and E18.5 d EMSCs was assayed by Cell Counting Kit‐8 (CCK‐8; Dojindo Kagaku Co., Kumamoto, Japan) according to the manufacturer's protocols. Briefly, the cells were seeded at 2 × 10³ cells/well in 96‐well plates (Corning Inc Shanghai, China) and then cultured overnight. Subsequently, the medium was replaced daily with 10% FBS DMEM/F12. After culturing cells for 7 days, they were counted using the cell counting kit. Absorbance was measured using a microplate reader at 450 nm to determine the number of viable cells in each well. A well containing the medium and CCK‐ 8 solution, but without cells, was used as the blank control. Cell proliferation was represented as mean ± SD of absorbance for five wells from each group.
2.5. Immunofluorescence staining and confocal laser scanning microscopy
The cells at the third passage were harvested and seeded onto coverslips overnight. Then, the specimens were fixed with 4% polyoxymethylene and incubated with rabbit anti‐rat p75NTR (1:200). To detect primary antibodies, goat anti‐rabbit IgG‐TRITC (for red fluorescence) secondary antibody was added and incubated for 30 min at room temperature. The cells were counterstained with DAPI (40,6‐diamidino‐2‐phenylindole) (Sigma) and observed under a confocal laser scanning microscope (TCS SP2; Leica Microsystems, Heidelberg, Germany).
2.6. Flow cytometry analysis
The approximately 5×10⁵ cells of each group were harvested, and the cell surface markers (CD14, CD29, CD90, CD146, CD45, p75NTR) were tested by flow cytometry as previously described.18 Briefly, the cells were fixed with 4% polyoxymethylene for 30 min followed by incubation at 4°C overnight with primary antibodies: anti‐rat p75NTR‐FITC (1:100; Abcam, Cambridge, UK), mouse anti‐rat CD14, CD29, CD44, CD45, CD90, CD105 and CD146 (1:100; Santa Cruz Biotechnology, Santa Cruz, CA, USA) according to the manufacturer's protocol. The corresponding secondary antibodies including anti‐mouse IgG‐FITC (1:1000) were added. Cells were then analysed with a FACS Calibur flow cytometer (BD Biosciences).
2.7. ALP staining and alizarin staining
E12.5d, E13.5d, E15.5d and E18.5d EMSCs (5×10⁴ ) at P3 were cultured with the osteogenic induction medium, which is 10% FBS α‐MEM containing 50 mg/mL ascorbic acid, 10 mmol/L b‐glycerol phosphate and 100 nmol/L dexamethasone. The osteogenic induction medium was changed every three days. The capacity of differential mineralization was assessed by ALP staining and alizarin red staining. Briefly, the cells were incubated with the mineralized medium for 7 days (changed every three days), washed twice by PBS and then fixed with 4% paraformaldehyde for 30 minutes. ALP staining kit (Beyotime, Shanghai, China) was exerted according to the manufacturer's protocols. After 21 days of incubation in the mineralized induction medium, the specimens were fixed and stained with alizarin red (Sangon, Shanghai, China). All cells were washed three times in distilled water and visualized under phase contrast microscopy. Cells at the third passage were used for experiments.
2.8. RT‐PCR assay
RT‐PCR was performed as previously described19 to investigate the potential role of p75NTR in EMSC mineralization. The total amount RNA used for RT was 1 μg, and 25 ng cDNA was used for each PCR. The primers were used as follows: p75NTR, ALP, Col‐1, Runx2, which are also detailed in Table 1.
Table 1.
Specific primers used for RT‐PCR
| Gene | Primer sequences |
|---|---|
| GAPDH | Forward: 5’‐ACAGCAACAGGGTGGTGGAC‐3’ |
| Reverse: 5’‐TTTGAGGGTGCAGCGAACTT‐3’ | |
| Runx2 | Forward: 5’‐CTGCCACCTCTGACTTCTGC‐3’ |
| Reverse: 5’‐GATGAAATGCCTGGGAACTG−3’ | |
| Col I | Forward: 5’‐GGTCCTTCTGGTCCTCGTG‐3’ |
| Reverse: 5’‐TCTCCGTTCTTGCCAGGA‐3’ | |
| ALP | Forward: 5’‐GGCTCTGCCGTTGTTTCTCT‐3’ |
| Reverse: 5’‐AAGGTGCTTTGGGAATCTGC‐3’ | |
| p75NTR | Forward: 5’‐GAGGGCACATACTCAGACGA‐3’ |
| Reverse: 5′‐CTCTTCGCATTCAGCATCAG‐3’ |
2.9. Western blotting assay
Cells were washed twice with ice‐cold PBS, and proteins were extracted from the cells with ice‐cold RIPA lysis buffer (Beyotime, Shanghai, China). Following centrifugation at 13 400 g for 10 minutes at 4°C, the cell debris was removed and the protein was obtained. The concentration was determined using a bicinchoninic acid (BCA) assay kit (Beyotime, Shanghai, China). Equal amounts of proteins were separated by 10% SDS‐polyacrylamide gel electrophoresis (SDS‐PAGE), transferred to a polyvinylidene difluoride membrane, blocked with 5% skim milk in 0.05 mol/L Tris‐buffered saline containing 0.1% Tween 20 (TBS) and probed with the following primary antibodies: rabbit polyclonal GAPDH antibody (1:2000; Immunoway, Plano, TX, USA), rabbit polyclonal Runx2 antibody (1:1000; Abcam), rabbit monoclonal P75NTR (1:1000; Cell Signaling, Danvers, MA, USA) and mouse monoclonal Col‐1 antibody (1:1500; Abcam Cambridge, MA, USA), respectively. GAPDH on the same membrane was used as a loading control. Signals were revealed after incubation with anti‐rabbit (1:2000) or anti‐mouse IgG secondary antibody (1:2000) coupled to peroxidase using ECL.
2.10. Statistical analysis
The data for CCK‐8 proliferation, RT‐PCR and Western blotting assay were presented as mean ± standard deviation (SD). Statistical significance was assessed using Prism 5 software (GraphPad Software, San Diego, CA, USA). Comparisons were made using a t‐test or one‐way ANOVA (Tukey's test) for experiments involving more than three groups. All experiments were repeated three times, and differences were considered significant at P < 0.05.
3. RESULTS
3.1. HE staining for rat tooth germs and immunohistochemistry staining for p75NTR and Runx2
HE staining shows that the rat original oral epithelium invaginated to form dental lamina at E12.5 d (Figure 1A). Then, the dental germs turned up and entered the bud stage at E13.5 d, the cap stage at E15.5 d and the bell stage at E18.5 d (Figure 1B‐D). Immunohistochemistry staining shows that p75NTR immunoreactivity was little expressed at E12.5 d in some subjacent mesenchyme area under the oral pit epithelium (Figure 1E). p75NTR immunoreactivity was enhanced at E13.5 d, but not detected around the tooth buds (Figure 1F). At the cap stage, p75NTR began to express in the mesenchyme of dental papilla, which seemed to be that p75NTR‐positive ectomesenchymal cells might migrate to dental papilla from the oral pit (Figure 1G). At the bell stage (Figure 1H), the p75NTR expression became weak in dental papilla and strong in dental follicle. It is worth noting that p75NTR was the first highly expressed in the inner enamel epithelium. Runx2, one of the mineralization‐related markers, showed the similar pattern to p75NTR but weaker in immunohistochemistry staining. It was hardly detected at E12.5 d (Figure 1I) and became weakly positive in the mesenchyme around the tooth buds at E13.5 d (Figure 1J). With the tooth germ reaching the cap stage, Runx2 was positive in mesenchyme area and became significantly enhanced under epithelial–mesenchymal interaction of the tooth germs at E15.5 d, but not positive in the mesenchyme area under the oral pit epithelium (Figure 1K). At the bell stage of E18.5 d, Runx2 was positive in the inner enamel epithelium and dental follicle area but little in the dental papilla (Figure 1L).
Figure 1.
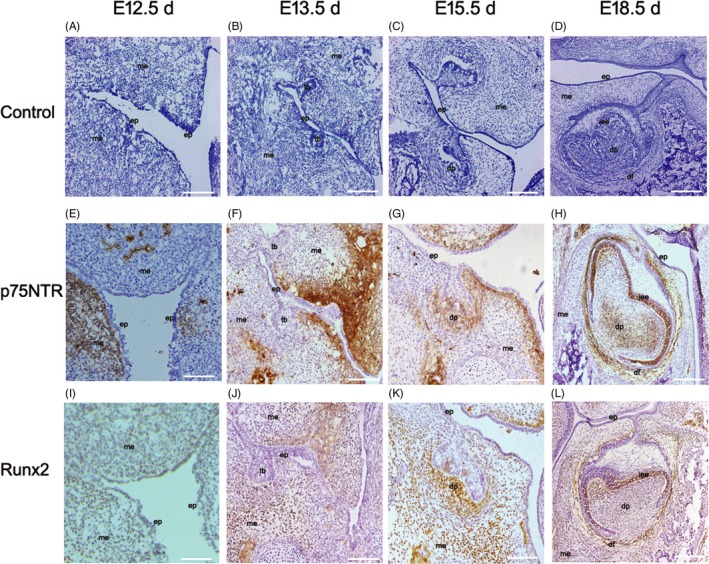
The results of HE staining (A‐D) and immunohistochemistry staining (E‐L). The rat original oral epithelium(ep) invaginated to form dental lamina at E12.5 d (A). The dental germs turned up and entered the bud stage at E13.5 d, the cap stage at E15.5 d and the bell stage at E18.5 d (B‐D). p75NTR immunoreactivity was little expressed at E12.5 d in some subjacent mesenchyme area under the oral pit epithelium (E). p75NTR immunoreactivity was enhanced at E13.5 d, but not detected around the tooth buds(tb) (F). At the cap stage, p75NTR began to express in the mesenchyme(me) of dental papilla(dp), liking that p75NTR‐positive ectomesenchymal cells migrate to dental papilla from the oral pit (G). At the bell stage (H), the p75NTR expression became weak in dental papilla and strong in dental follicle(df), but firstly expressed in the inner enamel epithelium(iee). Runx2 was hardly detected at E12.5 d (I) and became weakly positive in the mesenchyme around the tooth buds at E13.5 d (J). It was positive in mesenchyme area and became significantly enhanced under epithelial–mesenchymal interaction of the tooth germs at E15.5 d, but not positive in the mesenchyme area under the oral pit epithelium (K). At the bell stage of E18.5 d, Runx2 was positive in the inner enamel epithelium and dental follicle area but little in the dental papilla (L). Scale bar represents 100 μm
3.2. The in vitro culture and proliferation comparison of EMSCs from the four tooth development stages
The primary EMSCs of E12.5 d, E13.5 d, E15.5 d and E18.5 d were isolated and cultured, respectively, in vitro. All of them exhibited a fibroblast‐like morphology, and no difference was observed between the cells from different tooth development stages (Figure 2A‐D). The results of CCK‐8 assay showed that the higher proliferation capacity the cells were of, the earlier stages they were from (Figure 2E). But there was also no significant difference (P > 0.05).
Figure 2.
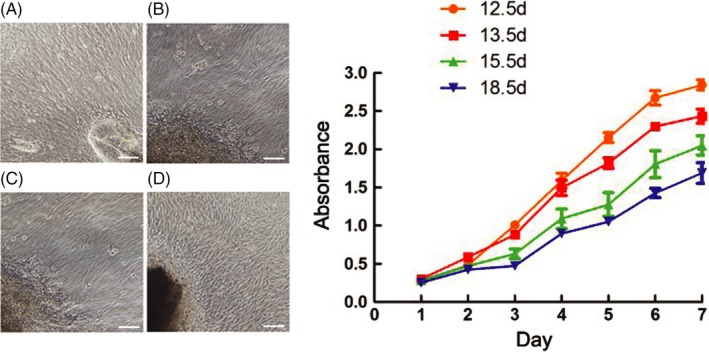
The cell culture and proliferation assay in vitro. All the cells exhibited a fibroblast‐like morphology, and no difference was observed between the cells from different tooth development stages (A‐D). The CCK‐8 assay showed that the cell proliferation capacity decreased during the development proceeding (E). But there was also no significant difference (P > 0.05). Scale bar represents 100 μm
3.3. The cell phenotype analysis to determine the origin of EMSCs
The confocal laser scanning microscopy assay showed that p75NTR was detected at different levels in the cells from the four tooth development stages (Figure 3). p75NTR was weakly expressed in the cells of E12.5 d, whereas it was significantly enhanced in the cells of E13.5 d, E15.5 d and E18.5 d. This result coincided with the following flow cytometry detection that the expression rates of p75NTR were 27.40% at E12.5 d, while 80.68% at E13.5 d, 88.66% at E15.5 d and 90.85% (Figure 4). The expression rates of the mesenchymal stem cell surface markers CD14, CD29, CD90 and CD146 were, respectively, 88.27%, 95.31%, 91.00% and 89.51% in the EMSCs of E12.5 d; 86.14%, 97.56%, 97.21% and 98.46% in the EMSCs of E13.5 d; 97.02%, 93.74%, 95.58% and 95.03% in the EMSCs of E15.5 d; and 93.43%, 93.15%, 95.27% and 96.93% in the EMSCs of E15.5 d. In contrast, the hemopoietic stem cell surface marker CD45 was little expressed in the cells of the four tooth development stages. The results of cell phenotype analysis confirmed that the EMSCs isolated in this paper were characteristic of neural crest origin and mesenchymal stem cells. Moreover, the expression rate of p75NTR dramatically increased when the tooth morphogenesis was triggered, implying a potential role of p75NTR in the early tooth development.
Figure 3.
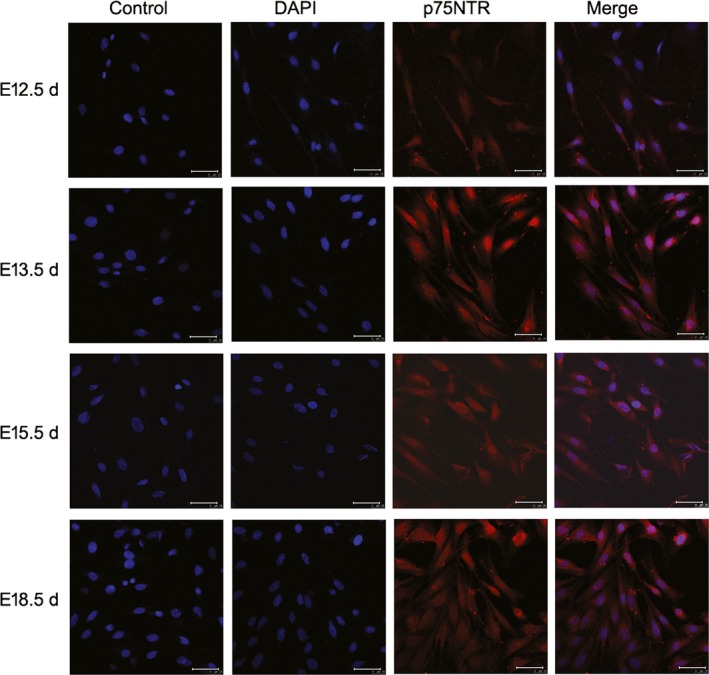
The confocal laser scanning microscopy results showed that p75NTR was detected at different levels in the cells from the four tooth development stages. p75NTR was weakly expressed in the cells of E12.5 d, whereas it was significantly enhanced in the cells of E13.5 d, E15.5 d and E18.5 d. Scale bar represents 50 μm
Figure 4.
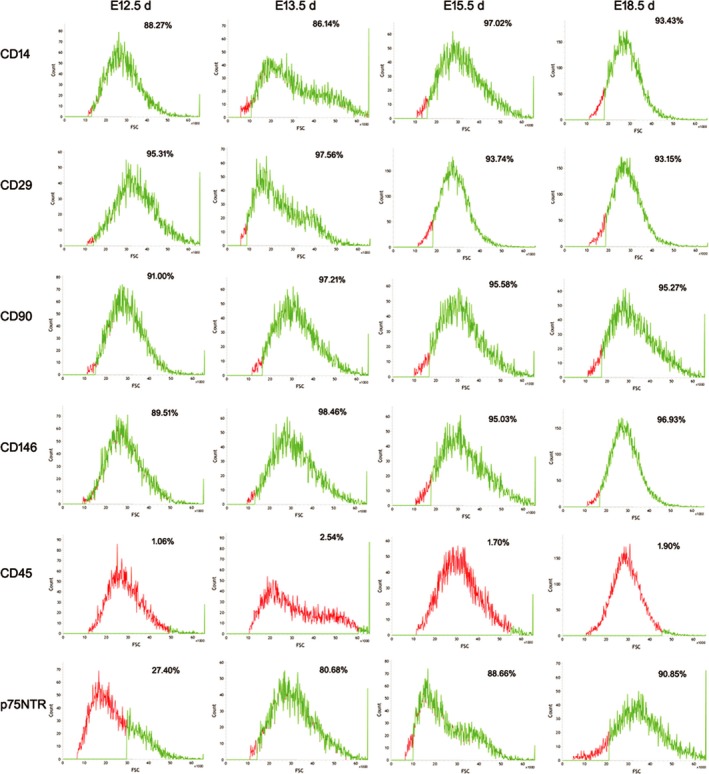
This results of the following flow cytometry detection showed that the mesenchymal stem cell surface markers CD14, CD29, CD90 and CD146 were highly expressed, while the hemopoietic stem cell surface marker CD45 was little expressed in the cells of the four tooth development stages. p75NTR was lowly expressed at E12.5 d, but significantly increased at E13.5 d and stably expressed at a high level during the 13.5 d‐18.5 d
3.4. Comparing the mineralization capability of EMSCs
Alkaline phosphatase staining showed that the colour of EMSCs gradually becomes deeper with the increase in development days (Figure 5). The colour of E18.5 d EMSCs was the deepest after a 7‐day mineralized induction. This result was confirmed in the following alizarin red staining. There were more and bigger mineralized nodules (Figure 5) in the E18.5 d and E15.5 d EMSCs than that in the E13.5 d and E12.5 d EMSCs after a 21‐day mineralized induction. The comparing experiment indicated that the mineralization capability of EMSCs in the early tooth morphogenesis was weak. With the mature of dental germs, especially at the bell stage when the dental hard tissue began to be formed, the mineralization capability of EMSCs became significantly enhanced.
Figure 5.
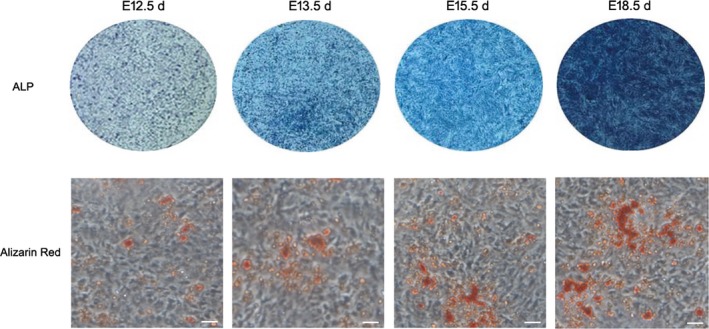
The results of Alkaline phosphatase staining and alizarin red staining. The colour of EMSCs in ALP assay was gradually deeper with the increase in development days and becomes the deepest at E18.5 d after a 7‐day mineralized induction. The alizarin red staining also showed that there were more and bigger mineralized nodules in the E18.5 d and E15.5 d EMSCs than that in the E13.5 d and E12.5 d EMSCs after a 21‐day mineralized induction. Scale bar represents 50 μm
3.5. The role of p75NTR in the mineralization of EMSCs
The results of RT‐PCR assay were shown in Figure 6. p75NTR mRNA in the control groups was on the slight increase with the mature of dental germs, and there was no significant difference between the four development stages (P > 0.05). After mineralization induction, p75NTR mRNA in all the experimental groups was significantly increased in comparison with each control group (P < 0.05), especially for the E18.5 d EMSC groups in which the increase was the highest (Figure 6D). The patterns of the mRNA changes for the mineralization‐related markers ALP, Col‐1 and Runx2 were similar to that of p75NTR (Figure 6A‐C). Their mRNAs were significantly increased after mineralization induction, and the highest increase was found in E18.5 d EMSC groups (P < 0.05). Western blot assay showed that the expressions of Col‐1 and Runx2 increased gradually with the mature of dental germs (Figure 7A, C, D), which was similar to the RT‐PCR result for p75NTR. These results indicated that p75NTR was well positively correlated with the mineralization‐related markers ALP, Col‐1 and Runx2 during the early tooth development, implying that p75NTR might participate in the regulation of the dental hard tissue formation. This speculation was further confirmed by the Western blot result that p75NTR was significantly increased after mineralization induction (Figure 7B,E).
Figure 6.
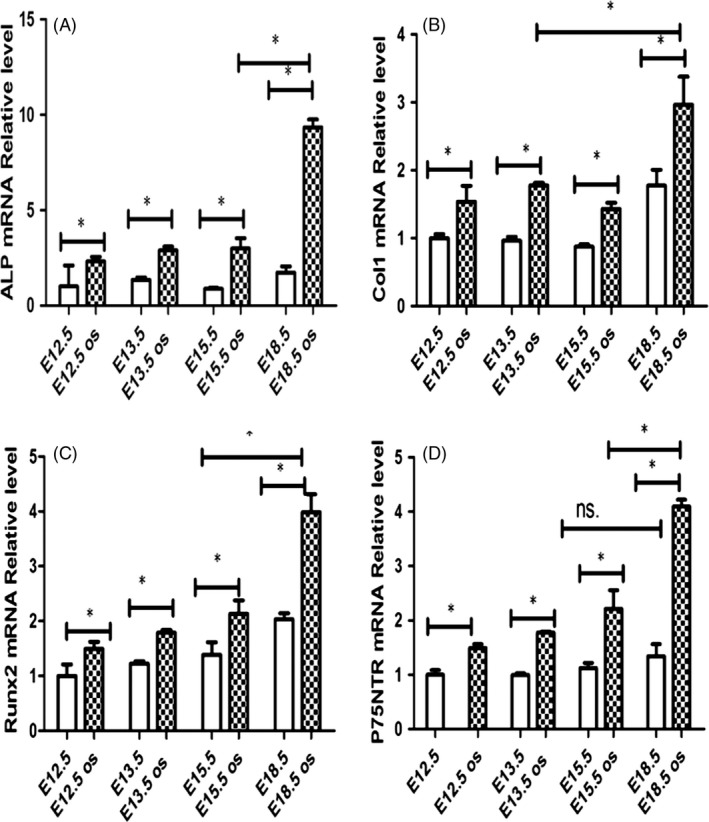
The RT‐PCR assay showed that p75NTR mRNA was on the slight increase with the mature of dental germs in the four control groups, but no significant difference between them (P > 0.05). After mineralization induction, p75NTR mRNA in all the experimental groups was significantly increased in comparison with each control group (P < 0.05), especially for the E18.5 d EMSC groups in which the increase was the highest (D).The mineralization‐related markers ALP, Col‐1 and Runx2 mRNA showed the similar changes to p75NTR (A‐C). They changed slightly in the four control groups, while significantly increased after mineralization induction. Moreover, all the three markers were detected to be highest in the E18.5 d EMSC groups (*P < 0.05, ns.=no significant difference)
Figure 7.
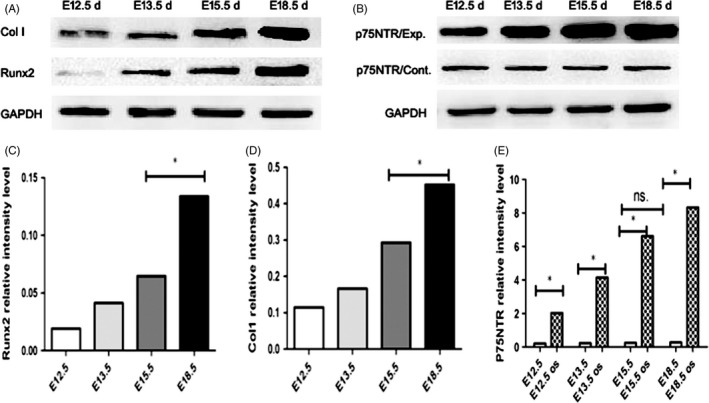
Western blot assay showed that the expressions of Col‐1 and Runx2 increased gradually with the mature of dental germs (A, C, D). p75NTR was on the slight increase with the mature of dental germs and significantly increased after mineralization induction (B, E). p75NTR/Exp means p75NTR experiment group, and p75NTR/Cont means p75NTR control group (*P < 0.05, ns.=no significant difference)
4. DISCUSSION
It is well established that sequential and reciprocal interactions between oral epithelium and cranial neural crest‐derived mesenchyme result in tooth morphogenesis.20, 21 The first sign of tooth development is the formation of the dental lamina. The tooth morphogenesis begins with the invagination of dental lamina epithelium which forms dental bud. The cranial neural crest‐derived mesenchyme condenses around the bud and becomes specified as the dental mesenchyme giving rise to all the dental tissues except enamel. The epithelial bud invaginates at its tip and acquires cap and bell shapes called enamel organ which subsequently form the tooth enamel. The mesenchyme encompassed by the enamel organ is called the dental papilla which forms the dental pulp and the dentin. The mesenchyme surrounding the epithelium and dental papilla becomes the dental follicle and gives rise to the periodontal tissues including the cementum. All these aspects of tooth morphogenesis are regulated by epithelial–mesenchymal interactions which are mediated by the signalling networks.22 But most of the molecular signatures on the odontogenic tissues remain to be uncovered.
In order to reveal the role of p75NTR in the signalling networks, its dynamic expression was investigated during the tooth morphogenesis in this study. The histology data showed that the tooth morphogenesis in rats began with the dental epithelium bud formed at E13.5 d, which was equal to the 7th week of dental germs in humans.23 The rat dental germs entered the cap stage at E15.5 d and the bell stage at E18.5 d, which were, respectively, equal to the 15th week and 23rd week of human dental germ. The stage (E12.5d) was the initiation stage of tooth germ development, at which the tooth germ not yet differentiated and was in the morphogenesis; the tooth morphogenesis in rats began with the dental epithelium bud formed at E13.5 d. The rat dental germs entered the cap stage at E15.5d. The bell stage (E18.5d) was the maturation stage of tooth germ development, at which the tooth germ was undergoing tissue differentiation and morphological differentiation. The similar results were reported by Obara et al24 in the mouse: the bud stage at E13.5 d, the cap stage at E14.5 d, the early bell stage at E16.5 d and the late bell stage at E18.5 d. These data indicated that there was no obvious difference in the tooth morphogenesis process between the rat and the mouse.
In the present study, p75NTR was not detected around the tooth buds, while began to be highly expressed in the mesenchyme of dental papilla at the cap stage. This pattern of p75NTR expression is similar to the reports in the previous literature.23, 25 There were two speculations for the mesenchyme cell with the high expression of p75NTR: one is the epithelial–mesenchymal interaction that triggers the subjacent mesenchyme cells to express p75NTR; the other is the mesenchyme cells with the high p75NTR expression that migrate to dental papilla from the oral pit. When tooth germ entered the bell stage, the p75NTR expression became weak in dental papilla while was firstly detected strong in the inner enamel epithelium. The transition of p75NTR expression indicated that the role of p75NTR in tooth morphogenesis might shift from the mesenchymal to epithelial component at E18.5 d. It is the right time that the dental hard tissues (enamel and dentine) begin to form. Additionally, the mineralization‐related marker Runx2 was also detected to be strongly expressed around enamelo‐dentinal junction at this stage. These data implied that p75NTR was likely to participate in the regulation of tooth mineralization. This phenomenon further confirms that the exchange of odontogenic signals between the dental epithelium and the dental mesenchyme during the tooth morphogenesis.9, 14, 20
p75NTR, a 75‐kDa cell surface receptor glycoprotein, is a member of the tumour necrosis factor receptor superfamily and involved in diverse cellular response including cell proliferation, cell survival and apoptosis in neural and non‐neural tissues.26, 27 p75NTR acts both as a TrkA coreceptor and as an autonomous signalling molecule. It has been reported that the costimulation of TrkA and p75NTR results in cell survival, whereas when p75NTR is expressed alone, binding of the ligands, including NGF, NT‐3, NT‐4 and BDNF, induces apoptosis.1, 28, 29 In the present study, p75NTR was weakly expressed in the cells of E12.5 d, whereas it was significantly enhanced in the cells of E13.5 d, E15.5 d and E18.5 d, which were consistent with the above histology data. But the enhanced expression of p75NTR did not result in the increase in cell proliferation, indicating that p75NTR was not involved in the regulation of the proliferation in EMSCs harvested in the present study. In our previous study,13 TrkA was expressed neither in the embryonic phases of EMSCs nor during the mineralized induction. Luukko et al30 also reported that TrkA mRNAs failed to be detected by in situ hybridization in rat first molars at any developmental stage except the trigeminal ganglia. This finding was different from the reports in the most previous literature that p75NTR and TrkA were co‐expressed in cells and have a positive cooperation.15, 31, 32 Since the EMSCs in the present study differ from the cells used in other literature, p75NTR probably plays a different role in tooth development.
Most literature focuses on the role of p75NTR in soft tissue morphogenesis, especially nervous system,5, 6, 33 while its effect on hard tissue morphogenesis was little discussed. There was evidence that p75NTR upregulated the mineralization‐related markers (Runx2, Osteric, BSP, OCN, etc) and promote the osteoblastic differentiation.13, 34 The similar results were found in the present study. Runx2 showed the same expression pattern as p75NTR in immunohistochemistry staining, implying a positive correlation of them in the mineralization during the tooth development. To confirm this finding, EMSCs were harvested at the four stages of dental germ and its mineralization capability was further investigated. EMSCs with low expression of p75NTR (E12.5 d) showed weak colour and small mineralized nodules in alkaline phosphatase staining and alizarin red staining. But the colour became deeper and mineralized nodules bigger in the EMSCs with high expression of p75NTR E13.5 d, E15.5 d and E18.5 d. In particular, at the late bell stage when the dental hard tissues of enamel and dentin begin to form, p75NTR was the first highly expressed in the inner enamel epithelium. Moreover, the EMSCs harvested from this stage (E18.5 d) also showed the highest mineralization capability. Therefore, p75NTR was speculated to upregulate mineralization in the early tooth development. The results of RT‐PCR assay and Western blotting assay further confirmed this conclusion.
In conclusion, our data showed that p75NTR was not detected at the dental bud stage, while began to be highly expressed at the cap and bell stages. p75NTR showed the similar expression pattern to the mineralization‐related marker Runx2 during the tooth development. The in vitro investigation of cell mineralization capability indicated that the higher the p75NTR expression was, the stronger the cells mineralization capability became. Moreover, p75NTR showed a positive correlation with the mineralization‐related makers investigated in this study. All the data showed that p75NTR might participate in the regulation of tooth morphogenesis, especially dental hard tissue formation. But the exact mechanism is unclear. Yang et al13 speculated in their study that p75NTR and Mage‐D1 might co‐operate to enhance the potential of differential mineralization of EMSCs as TrkA was not expressed in them. A recent study reported that nuclear β‐catenin was upregulated by the overexpression of the low‐affinity nerve growth factor receptor (LNGFR) during EMSC osteogenic differentiation, implying that the Wnt/β‐catenin pathway may be involved in the mineralization regulation of LNGFR in early tooth development.35 The current achievements are consistent in the p75NTR regulation of tooth mineralization. Some speculations, such as p75NTR–Mage‐D1–Dlx/Msx, have been also put forward. Further studies are still needed in future.
CONFLICT OF INTEREST
The authors declare that they have no competing interests.
ACKNOWLEDGEMENTS
This study was supported by the National Natural Science Foundation of China (Grant No. 81470032), the Program for Innovation Team Building at Institutions of Higher Education in Chongqing in 2016 (Grant No. CXTDG201602006), the Key Project of Medical Research Program of Chongqing Municipal Health Bureau (Grant No. 2017ZDXM018) and Chongqing Science and Technology Commission (Grant No. cstc2016jcyjA0202). All experiments were performed in the Laboratories of Oral Diseases and Biomedicine at Chongqing Medical University.
Zhao M, Wen X, Li G, et al. The spatiotemporal expression and mineralization regulation of p75 neurotrophin receptor in the early tooth development. Cell Prolif. 2019;52:e12523 10.1111/cpr.12523
Zhao and Wen equally contributed to this work.
Contributor Information
Zhi Zhou, Email: 2727533620@qq.com.
Jinlin Song, Email: soongjl@163.com.
REFERENCES
- 1. Moscatelli I, Pierantozzi E, Camaioni A, Siracusa G, Campagnolo L. p75 neurotrophin receptor is involved in proliferation of undifferentiated mouse embryonic stem cells. Exp Cell Res. 2009;315(18):3220‐3232. [DOI] [PubMed] [Google Scholar]
- 2. Crane JF, Trainor PA. Neural crest stem and progenitor cells. Annu Rev Cell Dev Biol. 2006;22:267‐286. [DOI] [PubMed] [Google Scholar]
- 3. Charalampopoulos I, Vicario A, Pediaditakis I, Gravanis A, Simi A, Ibáñez CF. Genetic dissection of neurotrophin signaling through the p75 neurotrophin receptor. Cell Rep. 2012;2(6):1563‐1570. [DOI] [PubMed] [Google Scholar]
- 4. Truzzi F, Marconi A, Atzei P et al. p75 neurotrophin receptor mediates apoptosis in transit‐amplifying cells and its overexpression restores cell death in psoriatic keratinocytes. Cell Death Differ. 2011;18(6):948‐958. [DOI] [PMC free article] [PubMed] [Google Scholar]
- 5. Gentry JJ, Barker PA, Carter BD. The p75 neurotrophin receptor: multiple interactors and numerous functions. Prog Brain Res. 2004;146:25‐39. [DOI] [PubMed] [Google Scholar]
- 6. Dai JW, Yuan H, Shen SY, et al. p75 neurotrophin receptor positive dental pulp stem cells: new hope for patients with neurodegenerative disease and neural injury. Shanghai kou qiang yi xue. 2013;22(4):469‐472. [PubMed] [Google Scholar]
- 7. Mantesso A, Sharpe P. Dental stem cells for tooth regeneration and repair. Expert Opin Biol Ther. 2009;9(9):1143‐1154. [DOI] [PubMed] [Google Scholar]
- 8. Chai Y, Jiang X, Ito Y, et al. Fate of the mammalian cranial neural crest during tooth and mandibular morphogenesis. Development. 2000;127:1671‐1679. [DOI] [PubMed] [Google Scholar]
- 9. Kapadia H, Mues G, D’Souza R. Genes affecting tooth morphogenesis. Orthod Craniofac Res. 2007;10:237‐244. [DOI] [PubMed] [Google Scholar]
- 10. Hauser S, Widera D, Qunneis F et al. Isolation of novel multipotent neural crest‐derived stem cells from adult human inferior turbinate. Stem Cells Dev. 2012;21(5):742‐756. [DOI] [PMC free article] [PubMed] [Google Scholar]
- 11. Wen X, Liu L, Deng M et al. Characterization of p75(+) ectomesenchymal stem cells from rat embryonic facial process tissue. Biochem Biophys Res Commun. 2012;427(1):5‐10. [DOI] [PubMed] [Google Scholar]
- 12. Pan W, Kremer KL, Kaidonis X et al. Characterization of p75 neurotrophin receptor expression in human dental pulp stem cells. Int J Dev Neurosci. 2016;53:90‐98. [DOI] [PubMed] [Google Scholar]
- 13. Yang K, Wang Y, Ju Y et al. p75 neurotrophin receptor regulates differential mineralization of rat ectomesenchymal stem cells. Cell Prolif. 2017;50(1):e12290. [DOI] [PMC free article] [PubMed] [Google Scholar]
- 14. Xing Y, Nie X, Chen G et al. Comparison of P75 NTR‐positive and ‐negative etcomesenchymal stem cell odontogenic differentiation through epithelial‐mesenchymal interaction. Cell Prolif. 2016;49(2):185‐194. [DOI] [PMC free article] [PubMed] [Google Scholar]
- 15. Matusica D, Skeldal S, Sykes AM, Palstra N, Sharma A, Coulson EJ. An intracellular domain fragment of the p75 neurotrophin receptor (p75(NTR)) enhances tropomyosin receptor kinase A (TrkA) receptor function. J Biol Chem. 2013;288(16):11144‐11154. [DOI] [PMC free article] [PubMed] [Google Scholar]
- 16. Colombo E, Romaggi S, Medico E et al. Human neurotrophin receptor p75NTR defines differentiation‐oriented skeletal muscle precursor cells: implications for muscle regeneration. J Neuropathol Exp Neurol. 2011;70(2):133‐142. [DOI] [PubMed] [Google Scholar]
- 17. Mikami Y, Ishii Y, Watanabe N et al. CD271/p75(NTR) inhibits the differentiation of mesenchymal stem cells into osteogenic, adipogenic, chondrogenic, and myogenic lineages. Stem Cells Dev. 2011;20(5):901‐913. [DOI] [PubMed] [Google Scholar]
- 18. Li Y, Li J, Zhu S, et al. Effects of strontium on proliferation and differentiation of rat bone marrow mesenchymal stem cells. Biochem Biophys Res Commun. 2012;418:725‐730. [DOI] [PubMed] [Google Scholar]
- 19. Wen X, Nie X, Zhang L, Liu L, Deng M. Adipose tissue‐ deprived stem cells acquire cementoblast features treated with dental follicle cell conditioned medium containing dentin non‐collagenous proteins in vitro. Biochem Biophys Res Commun. 2011;409:583‐589. [DOI] [PubMed] [Google Scholar]
- 20. Jussila M, Thesleff I. Signaling networks regulating tooth organogenesis and regeneration, and the specification of dental mesenchymal and epithelial cell lineages. Cold Spring Harb Perspect Biol. 2012;4:a008425. [DOI] [PMC free article] [PubMed] [Google Scholar]
- 21. Mitsiadis TA, Graf D. Cell fate determination during tooth development and regeneration. Birth Defects Res C Embryo Today. 2009;87:199‐211. [DOI] [PubMed] [Google Scholar]
- 22. Kettunen P, Laurikkala J, Itäranta P, Vainio S, Itoh N, Thesleff I. Associations of FGF‐3 and FGF‐10 with signaling networks regulating tooth morphogenesis. Dev Dyn. 2000;219:322‐332. [DOI] [PubMed] [Google Scholar]
- 23. Mitsiadis TA, Pagella P. Expression of nerve growth factor (NGF), TrkA, and p75(NTR) in developing human fetal teeth. Front Physiol. 2016;3(7):338. [DOI] [PMC free article] [PubMed] [Google Scholar]
- 24. Obara N, Suzuki Y, Irie K, Shibata S. Expression of planar cell polarity genes during mouse tooth development. Arch Oral Biol. 2017;83:85‐91. [DOI] [PubMed] [Google Scholar]
- 25. Mitsiadis TA, Luukko K. Neurotrophins in odontogenesis. Int J Dev Biol. 1995;39:195‐202. [PubMed] [Google Scholar]
- 26. Wang X, Bauer JH, Li Y, et al. Characterization of a p75(NTR) apoptotic signaling pathway using a novel cellular model. J Biol Chem. 2001;276:33812‐33820. [DOI] [PubMed] [Google Scholar]
- 27. Rodriguez‐Tebar A, Dechant G, Gotz R, et al. Binding of neurotrophin‐3 to its neuronal receptors and interactions with nerve growth factor and brain‐derived neurotrophic factor. EMBO J. 1992;11:917‐922. [DOI] [PMC free article] [PubMed] [Google Scholar]
- 28. Barker P, Shooter E. Disruption of NGF binding to the low affinity neurotrophin receptor p75NTR reduces NGF binding to TrkA on PC12 cells. Neuron. 1994;13:203‐215. [DOI] [PubMed] [Google Scholar]
- 29. Kiyosue T, Kawano S, Matsubara R et al. Immunohistochemical location of the p75 neurotrophin receptor (p75NTR) in oral leukoplakia and oral squamous cell carcinoma. Int J Clin Oncol. 2013;18(1):154‐163. [DOI] [PubMed] [Google Scholar]
- 30. Luukko K, Moshnyakov M, Sainio K, Saarma M, Sariola H, Thesleff I. Expression of neurotrophin receptors during rat tooth development is developmentally regulated, independent of innervation, and suggests functions in the regulation of morphogenesis and innervation. Dev Dyn. 1996;206:87‐99. [DOI] [PubMed] [Google Scholar]
- 31. Minnone G, DeBenedetti F, Bracci‐Laudiero L. NGF and its receptors in the regulation of inflammatory response. Int J Mol Sci. 2017;18(5). pii:E1028. [DOI] [PMC free article] [PubMed] [Google Scholar]
- 32. Liu M, Chen F, Sha L et al. (‐)‐Epigallocatechin‐3‐gallate ameliorates learning and memory deficits by adjusting the balance of TrkA/p75NTR signaling in APP/PS1 transgenic mice. Mol Neurobiol. 2014;49(3):1350‐1363. [DOI] [PMC free article] [PubMed] [Google Scholar]
- 33. Edalat H, Hajebrahimi Z, Movahedin M, Tavallaei M, Amiri S, Mowla SJ. p75NTR suppression in rat bone marrow stromal stem cells significantly reduced their rate of apoptosis during neural differentiation. Neurosci Lett. 2011;498(1):15‐19. [DOI] [PubMed] [Google Scholar]
- 34. Mikami Y, Suzuki S, Ishii Y et al. The p75 neurotrophin receptor regulates MC3T3‐E1 osteoblastic differentiation. Differentiation. 2012;84(5):392‐399. [DOI] [PubMed] [Google Scholar]
- 35. Li G, Liu J, Wang Y et al. LNGFR targets the Wnt/β‐catenin pathway and promotes the osteogenic differentiation in rat ectomesenchymal stem cells. Sci Rep. 2017;7(1):11021. [DOI] [PMC free article] [PubMed] [Google Scholar]


