

Abstract
Objectives
Soluble IL‐33 (interleukin (IL)‐1‐like cytokine) acts as endogenous alarm signal (alarmin). Since alarmins, besides activating immune system, act to restore tissue homeostasis, we investigated whether IL‐33 exerts beneficial effects on oral stem cell pull.
Materials and Methods
Clonogenicity, proliferation, differentiation and senescence of stem cells derived from human periodontal ligament (PDLSCs) and dental pulp (DPSCs) were determined after in vitro exposure to IL‐33. Cellular changes were detected by flow cytometry, Western blot, immunocytochemistry and semiquantitative RT‐PCR.
Results
IL‐33 stimulated proliferation, clonogenicity and expression of pluripotency markers, OCT‐4, SOX‐2 and NANOG, but it inhibited ALP activity and mineralization in both PDLSCs and DPSCs. Higher Ki67 expression and reduced β‐galactosidase activity in IL‐33‐treated cells were demonstrated, whereas these trends were more conspicuous in osteogenic medium. However, after 7‐day IL‐33 pretreatment, differentiation capacity of IL‐33‐pretreated cells was retained, and increased ALP activity was observed in both cell types. Results showed that IL‐33 regulates NF‐κB and β‐catenin signalling, indicating the association of these molecules with changes observed in IL‐33‐treated PDLSCs and DPSCs, particularly their proliferation, pluripotency‐associated marker expression and osteogenesis.
Conclusions
IL‐33 treatment impairs osteogenesis of PDLSCs and DPSCs, while increases their clonogenicity, proliferation and pluripotency marker expression. After exposure to IL‐33, osteogenic capacity of cells stayed intact. NF‐κB and β‐catenin are implicated in the effects achieved by IL‐33 in PDLSCs and DPSCs.
Keywords: dental pulp, interleukin‐33, osteogenesis, periodontal ligament, pluripotency, stem cell
1. INTRODUCTION
Soluble IL‐33 (interleukin (IL)‐1‐like cytokine) acts as endogenous alarm signal (alarmin) exhibiting pleiotropic effects on surrounding cells and tissues. Damaged stromal cells, such as epithelial and endothelial cells, release IL‐33 from the nucleus. Besides the activation of Th2 immunity, soluble IL‐33 plays crucial role in barrier defence, and its disrupted signalling axis has been associated with asthma, rheumatoid arthritis, central nervous diseases and cancer.1, 2, 3 Also, alarmins act to restore tissue homeostasis 4 and it might be assumed that IL‐33 could be involved in promotion of damaged tissue repair.
Oral cavity is frequently exposed to the growth factors and cytokines produced at the inflammation site, which coordinately act to restore tissue morphology and function after injury.5 The presence of IL‐33 within the oral tissues was recently demonstrated. While periodontal pathogenic bacteria Porphyromonas gingivalis strongly stimulated IL‐33 mRNA expression in gingival epithelial cells,6 IL‐33 expression is elevated in the inflamed gingival crevicular fluid7 and gingival epithelium of chronic periodontitis patients.8 Association of increased IL‐33 level with periodontitis and alveolar bone resorption and loss was also reported.8, 9 Recent findings indicated that IL‐33 expression in cells of periapical lesion and radicular cyst may be involved in periapical inflammation10, 11 which is caused by the pulpal infection.12 Since the root apex and dental pulp are tightly interconnected tissues, communicating through periodontal pocket and apical foramen,12, 13 during periodontal disease IL‐33 within crevicular fluid may influence dental pulp cells. However, despite the findings that indicate correlation of IL‐33 expression and periodontal inflammatory diseases, the involvement IL‐33 in regeneration and repair of oral tissues is not fully understood, particularly since there are still no data regarding the influence of IL‐33 on oral stem cells nor mode of its action.
Oral and maxillofacial tissues present highly accessible sources of adult progenitor/stem cells which possess features assigned to in vitro‐observed mesenchymal stem/stromal cell (MSC) properties, such as self‐renewal and multilineage differentiation.14, 15 Regarding the heterogeneity within (craniofacial) oral stem cells populations, functional differences in vivo are reported. Dental MSCs, including exfoliated deciduous teeth stem cells (SCs), apical papilla SCs and dental pulp SCs (DPSCs), form dentine‐like structures when transplanted in immunocompromised mice, in contrast to periodontal ligament (PDL) SCs and gingival SCs that in vivo form PDL‐like structures.16
Dental pulp (DP) forms dentin, whereas PDL is tooth‐supportive connective tissue that ensures gently tooth anchorage to the alveolar bone, both providing tooth nutrition, protection and sensory perception, together contributing to the tooth longevity.17, 18, 19, 20 Since PDL and DP are soft, connective tissues surrounded by hard, mineralized tissues, regulation of mineralization level is the main physiological demand within these tissues in order to adapt functional changes.18, 21, 22 While DPSCs contribute to replacement of damaged tissue and repair of complete tooth, PDLSCs have predominant role in tooth functions and development.23 Resident DPSCs and PDLSCs respond to activation stimuli of dynamic microenvironment, governing tissue homeostasis, differentiation and regeneration.18, 21, 22 Detailed understanding of functional behaviour of oral MSCs, both in vitro and in vivo, is still necessary regarding their potential use in cellular therapy and maxillofacial reconstruction.
As previous reports indicated different protein and gene expression patterns in human DPSCs and PDLSCs,24, 25 in this study, we evaluated the response of PDLSCs and DPSCs to IL‐33, through the analysis of their proliferation and differentiation potential. Since regulatory proteins NF‐κB and β‐catenin are implicated in tissue immune homeostasis, osteogenesis and stemness maintaining,26 we also analysed the role of NF‐κB and β‐catenin in IL‐33‐mediated effects in PDLSCs and DPSCs.
2. MATERIALS AND METHODS
2.1. Isolation and cell culture of PDLSCs and DPSCs
Human PDLSCs and DPSCs were isolated from healthy patients using recently described primary tissue explant techniques.27, 28 Tissue sample collections of PDL and DP from adult teeth were assessed at the Department of Oral Surgery of the Faculty of Dental Medicine, University of Belgrade, after getting the approval of the local ethical committee and informed consent of patients. PDL and DP were sliced into small pieces and cultured in growth medium (GM) containing Dulbecco's modified Eagle's medium (DMEM, Sigma‐Aldrich, St. Louis, MO, USA) with 10% foetal bovine serum (FBS, Capricorn‐Scientific, Ebsdorfergrund, Germany), 100 U/mL penicillin and 100 µg/mL streptomycin (Gibco, Thermo Fisher Scientific). Standard cultivation conditions were as follows: 37°C in humidified atmosphere containing 5% CO2 with twice a week medium exchange. The outgrown cells were detached using 0.25% trypsin/EDTA (Gibco). All experiments were performed using PDLSCs and DPSCs subcultured into passage 2 up to passage 6.
2.2. Surface marker expression
Following the treatment with IL‐33 (100 ng/mL) during 72 hours in GM, cells were detached with 1 mM EDTA and washed in cold 0.5% bovine serum albumin (BSA; Sigma‐Aldrich) in phosphate‐buffered saline (PBS, Capricorn, Germany). Then, cells were incubated with fluorescein isothiocyanate (FITC)‐ or phycoerythrin (PE)‐conjugated antibodies against antigens CD44H, CD73, CD90 (R&D Systems, Minneapolis, MN, USA), CD105, HLA‐DR (Invitrogen, Carlsbad, CA, USA) and CD34 (DakoCytomation, Denmark) during 30 minutes in the dark at 4°C. Flow cytometry was performed using Cytomics FC 500 (Beckman Coulter, Brea, CA, USA) cytometer, while data were analysed using WinMDI 2.9 software (J. Trotter, The Scripps Research Institute, La Jolla, CA).
2.3. Cellular viability
Cells were seeded in 96‐well plates (5 × 10³ cells/well) and grown for 24 hours in GM in standard conditions and afterwards treated with different concentration of IL‐33 (5, 10, 20, 50 and 100 ng/mL) (R&D Systems). Following the treatment, MTT solution (5 mg/mL) (Sigma‐Aldrich) was added. Optical density of formazan crystals dissolved with isopropanol was detected at 540 nm by microtitre plate reader (LabSystems Multiskan PLUS, Finland).
2.4. In vitro osteogenic differentiation
Cells were seeded in 96‐well plates (5000 cells/well) and grown in GM in standard conditions until the confluency. Then, the osteogenic differentiation medium (OM) was added with or without IL‐33 (100 ng/mL). For analysis of effect of IL‐33 pretreatment, PDLSCs and DPSCs were cultivated in GM with or without IL‐33 (100 ng/mL) during 7 days, and subsequently only in OM for appropriate time. Osteogenesis was detected after 7 (alkaline phosphatase‐ALP staining assay) and 14 days of cultivation (Alizarin red staining) in OM that contained GM with 5% FBS, 50 μM ascorbic acid‐2‐phosphate (Sigma‐Aldrich) and 10 mM β‐glycerophosphate (Sigma‐Aldrich). Enzyme activity and histochemical staining of ALP and extracellular matrix mineralization by Alizarin red staining were estimated as previously described.29 Light microscope (Olympus, Japan) was used to capture cells, while the mineralization level was quantified by densitometry in NIH—ImageJ software (LOCI, University of Wisconsin, Madison, WI, USA).
2.5. Cellular clonogenicity, proliferation and senescence in osteogenic differentiation settings
Colony‐forming unit‐fibroblast (CFU‐F) assay was performed as we previously described for PDLSCs and DPSCs.27, 28 CFU efficiency was determined as the percentage of colonies relative to total number of seeded cells in each well.
To determine ALP+ CFU‐Fs, termed as CFU‐osteoblasts (CFU‐O), cells were seeded in 24‐well plates at concentration 100 cells/well and cultivated in GM in standard conditions during 7 days.30 Then, the OM was added and incubation was continued for the next 7 days with or without IL‐33 (100 ng/mL) when the colonies were stained for ALP activity. Percentage of CFU‐O was expressed as ratio of ALP‐positive CFUs/total CFUs*100.
Following the IL‐33 (100 ng/mL) during 7‐day osteogenic induction cell number, expression of intracellular proliferation marker Ki67 and β‐galactosidase activity were estimated. Cell number was determined by Trypan blue exclusion test.
Percentage of Ki67‐positive cells was determined by flow cytometry equipment (as for surface marker detection). Cells were washed with PBS, fixed in 5% formaldehyde and permeabilized in 0.5% BSA/PBS containing 0.1% Triton X‐100. Following the nonspecific blocking (15 minutes in 0.5% BSA/PBS), cells were labelled with rabbit anti‐Ki67 antibody (Abcam, UK) and secondary anti‐rabbit antibody FITC (Sigma‐Aldrich). Level of nonspecific binding was determined by FITC‐conjugated isotype control antibodies.
For single‐cell β‐galactosidase staining, cells were seeded at concentration 2 × 10³ cells/well in 96‐well plates, adhered during 6 hours, and stained using Senescence Cells Histochemical Kit (Sigma‐Aldrich). The single‐stained cells were captured and counted under light microscope, and the percentage of stained cells was determined for several separated visual fields.
2.6. Western blot
After cultivation with IL‐33 (100 ng/mL) at different time points, total protein extracts were isolated using lysis buffer. Same amounts of protein samples (concentration determined by BCA assay, Serva, Germany) were separated by SDS‐PAGE and electrotransfered onto nitrocellulose membrane Hybond ECL (AppliChem, Germany). Next, membranes were blocked in 4% nonfat milk (Serva) in TBST for 1 hour and subsequently incubated with primary antibodies: mouse anti‐GAPDH, anti‐NF‐κB and anti‐β‐catenin (Santa Cruz Biotechnology) overnight at 4°C. Protein bands were visualized using ECL reagent (Serva, Germany) after membrane incubation with anti‐mouse HRP‐conjugated antibody (Sigma‐Aldrich) during 1 hour at room temperature.
2.7. Immunofluorescence
Cells were seeded in 24‐well plates over coverslips (1 × 10³ cells/well) and treated as described in Figure legend. Then, cells were fixed in 4% paraformaldehyde, permeabilized in 0.1% Triton X‐100 in PBS, blocked with 3% BSA/PBS and stained with primary antibodies: rabbit anti‐Ki67 (Abcam), mouse anti‐NF‐κB (Santa Cruz Biotechnology), mouse anti‐β‐catenin (Santa Cruz Biotechnology), mouse anti‐NANOG, rabbit anti‐Oct‐4 and mouse anti‐SOX‐2 (Cell Signaling Technology, Danvers, MA, USA). Samples incubated in 3% BSA/PBS only represented negative controls (Supplementary Figure S3). The corresponding FITC‐coupled secondary antibodies (Sigma‐Aldrich) and 1 ng/mL of nuclear dye DAPI (Sigma‐Aldrich) were added during 2 hours. Samples were examined using an epi‐fluorescent microscope (Olympus, Japan).
2.8. Semiquantitative RT‐PCR
After 24 hours of IL‐33 (100 ng/mL) treatment, total RNA was extracted using TRIzol Reagent (Invitrogen) and cDNA was synthesized from 200 ng of total RNA by RevertAidTM H Minus First Strand cDNA Synthesis Kit (Thermo Scientific, Waltham, MA). Template PCRs were performed after 33 cycles of amplification with adjusted annealing temperature. Primer NIH sequences, corresponding annealing temperatures and the amplified product lengths are provided in Table 1.
Table 1.
PCR primer sets used in experiments
| Gene | NCBI reference sequence |
Forward 5'‐3' |
Reverse 3'‐5' |
Amplicon (bp) | Annealing temperature (°C) | Cycle number | ||
|---|---|---|---|---|---|---|---|---|
| Runx2 | NM_001015051.3 | ATGCTTCATTCGCCTCACAAAC | CCAAAAGAAGTTTTGCTGACATGG | 261 | 54 | 35 | ||
| ALP | NM_000478.5 | CCCAAAGGCTTCTTCTTG | CTGGTAGTTGTTGTGAGC | 356 | 49 | 33 | ||
| Oct4A | NM_002701.5 | AGTGAGAGGCAACCTGGAGA | GTGAAGTGAGGGCTCCCATA | 270 | 54 | 35 | ||
| Oct4B | NM_002701.5 | TATGGGAGCCCTCACTTCAC | CAAAAACCCTGGCACAAACT | 194 | 54 | 35 | ||
| SOX‐2 | NM_003106.3 | ATGGGTTCGGTGGTCAAGT | GGCGCCGTGGGAGATACATG | 126 | 50 | 35 | ||
| NANOG | NM_024865.3 | CTCCATGAACATGCAACCTG | CTCGCTGATTAGGCTCCAAC | 209 | 54 | 35 | ||
| GAPDH | NM_001289746.1 | ACCACAGTCCATGCCATCAC | TCCACCACCCTGTTGCTGTA | 452 | 52 | 33 | ||
2.9. Statistical analysis
Intensities of immunoblots and RT‐PCR bands were determined by ImageMaster TotalLab v1.11 software (Amersham Biotech). Statistical significances (* P < 0.05) were determined by Student's t test. Data were analysed and graphed using GraphPad Prism 6 Software (San Diego, CA).
3. RESULTS
3.1. Mesenchymal stem/stromal cell features of PDLSCs and DPSCs: Effects of IL‐33
By using MTT test, we examined viability of PDLSCs and DPSCs in the presence of increasing concentrations of IL‐33 at different time points. The results demonstrated unaltered viability of both treated cell types compared to untreated cells (Figure 1A), although DPSCs expressed lower growth rate compared to PDLSCs (Supplementary Figure S1). As shown on Figure 1B, PDLSCs and DPSCs demonstrated similar, fibroblast‐like shape, while IL‐33 (100 ng/mL) did not alter cellular morphology after 72 hours of treatment. Analysis of PDLSCs and DPSCs immunophenotype demonstrated positive expression of mesenchymal stromal cell (MSC) markers, CD44, CD73, CD90 and CD105, and low expression or absence of HLA‐DR and CD34, while IL‐33 treatment for 72 hours did not change these expression patterns (Figure 1C). Both PDLSCs and DPSCs expressed OCT‐4, SOX‐2 and NANOG, while 7‐day IL‐33 treatment increased the expression, without changing subcellular localization of these transcriptional factors, in both cell types. In PDLSCs and DPSCs, OCT‐4 localized in cytoplasm and nuclear region, while IL‐33 increased its expression in both compartments. In contrary to PDLSCs, where SOX‐2 was predominantly in nuclear region, in DPSCs SOX‐2 was mostly distributed in cytoplasm region and IL‐33 increased expression of SOX‐2 in nucleus of PDLSCs and cytoplasm of DPSCs. In both cell types, NANOG mostly localized in cytoplasm and IL‐33 increased its expression (Figure 1D).
Figure 1.
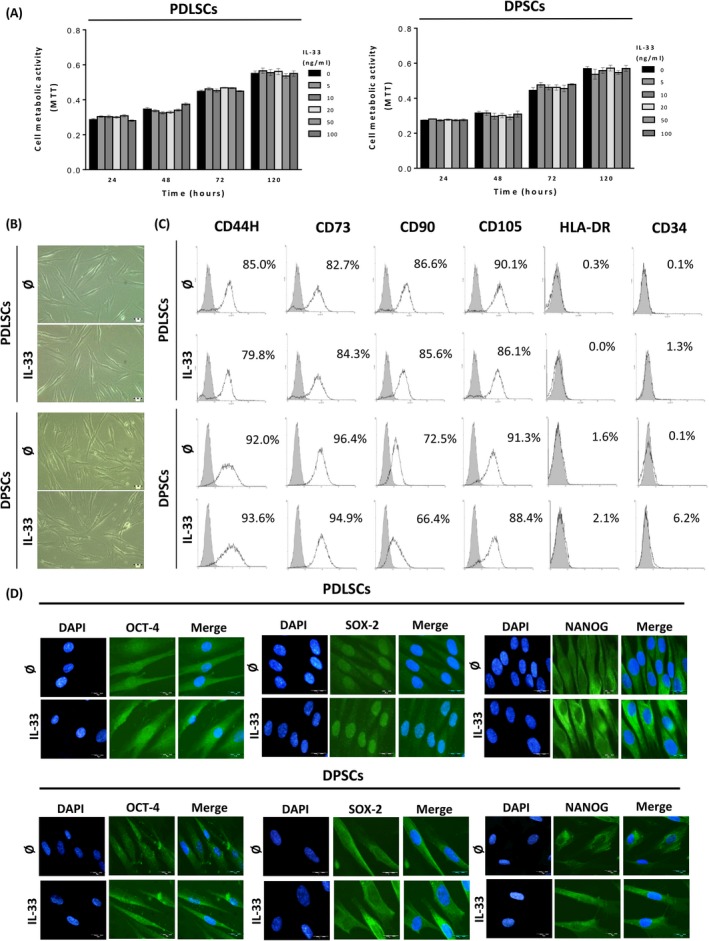
Viability, morphology and phenotype of cultivated PDLSCs and DPSCs in the presence of IL‐33. A, Metabolic activity of cells treated with IL‐33 (5, 10, 20, 50 and 100 ng/mL) during 24, 48, 72 and 120 h estimated by using MTT assay. B, Fibroblast‐like morphology of PDLSCs and DPSCs. Cells were grown in GM in the presence or absence of IL‐33 (100 ng/mL) for 72 h. Scale bars: 50 μm. C, Immunophenotype of cells determined by flow cytometry. Representative histograms show the percentage of positive cells (empty peaks) versus isotype controls (shaded peaks). D, Expression of pluripotency‐related transcription factors: Oct4, SOX‐2 and NANOG detected by indirect immunofluorescence staining with FITC‐conjugated corresponding secondary antibodies (Scale bars: 20 μm). DNA was stained with DAPI. Results are presented as mean ± SEM of three different samples (n = 3) from at least three independent experiments
3.2. IL‐33 modulates colony‐forming efficiency and early osteogenesis in PDLSCs and DPSCs
IL‐33 significantly increased CFU‐F efficiency in both cell types in basal media (GM). The presence of OM increased CFU‐F efficiency in PDLSCs and DPSCs when compared to CFU‐F in basal conditions, while addition of IL‐33 slightly reduced the percentage of CFU‐F for both cell populations achieved in OM only (Figure 2A). PDLSCs possess slightly higher CFU‐F efficiency then DPSCs in all tested groups and compared to DPSCs, PDLSCs showed higher capacity to form ALP+ CFU‐Fs (CFU‐O), significantly in GM. OM did not affect CFU‐O efficiency of PDLSCs, but it significantly increased CFU‐O efficiency in DPSCs. While IL‐33 only moderately modified CFU‐O efficiency in GM in PDLSC and DPSCs, this cytokine significantly decreased ALP+ colony percentage in PDLSCs. On the other hand, IL‐33 abolished enhanced CFU‐O efficiency in DPSCs (Figure 2B).
Figure 2.
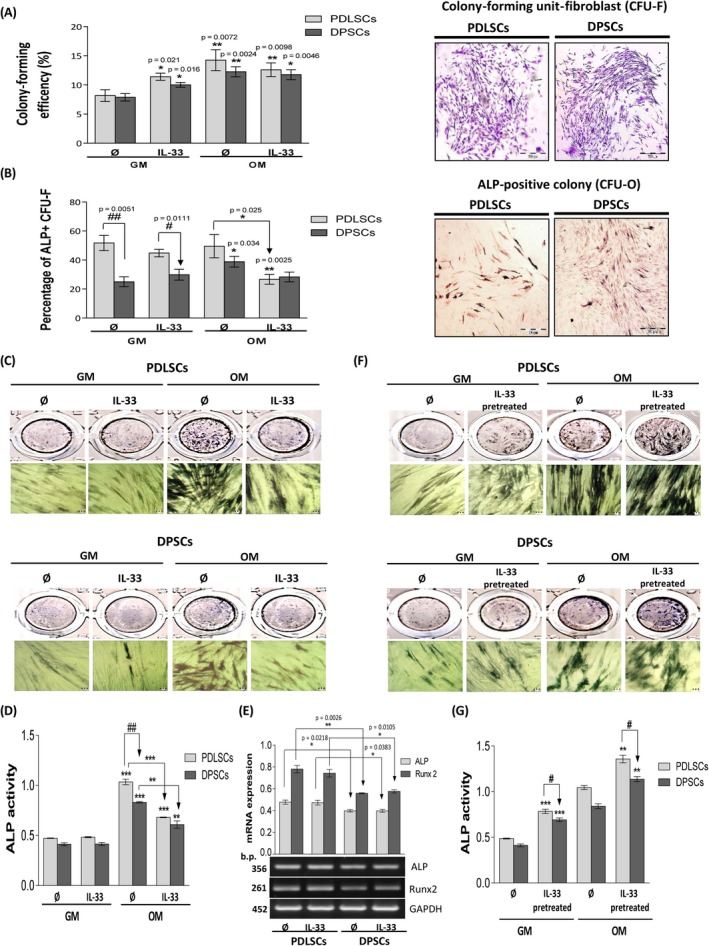
Cellular clonogenicity and ALP activity of cultivated PDLSCs and DPSCs in the presence of IL‐33 in osteogenic differentiation settings. Cells were seeded in 24‐well plates (100 cells/well) and grown in standard conditions during 14 d with or without IL‐33 (100 ng/mL) in GM or OM. A, Colony‐forming unit‐fibroblast (CFU‐F) efficiency of PDLSCs and DPSCs. Representative images of CFU‐F stained with Crystal violet are shown (Scale bars: 500 µm). For CFU‐osteoblasts (CFU‐O), capacity cells were seeded in 24‐well plate (100 cells/well) and cultivated in GM in standard conditions during 7 d when the osteogenic medium (OM) was added and incubation was continued for the next 7 d with or without IL‐33 (100 ng/mL). B, CFU‐osteoblast (CFU‐O) capacity of PDLSCs and DPSCs determined based on number of ALP‐positive colonies. Representative images of CFU‐O stained for ALP activity are shown (Scale bars: 500 µm). Results in graphs are presented as means of percentages ± SEM from at least three independent experiments. Statistically significant difference in comparison with GM in the absence of IL‐33 by t test: *P < 0.05; **P < 0.01; or in comparison with OM in the absence of IL33: *P < 0.05 or between PDLSCs and DPSCs: ## P < 0.01; ### P < 0.001. (C,D), For osteogenic differentiation, detected by using ALP staining, cells were cultivated in GM or OM in the presence of IL‐33 (100 ng/mL) during 7 d; or (F,G), pretreated with IL‐33 (100 ng/mL) during 7 d and then induced for osteogenesis. (C,F), Representative images of osteogenic differentiation are shown (Scale bars: 20 µm). (F,G), Quantification of ALP staining. Results in graphs are presented as means ± SEM of four different samples (n = 4) from at least three independent experiments. Statistically significant difference in comparison with GM in the absence of IL‐33 by t test: **P < 0.01; ***P < 0.01; or in comparison with OM in the absence of IL33: **P < 0.01; ***P < 0.01; or between PDLSCs and DPSCs: # P < 0.05; ## P < 0.01. E, For mRNA analysis, cells were cultivated in GM in the presence or absence of IL‐33 (100 ng/mL) 24 h. As a gel loading control, GAPDH was used. Representative gels from three different samples (n = 3) are shown. Molecular weight standards are indicated in bp for PCR products. Results in graphs are presented as mean ± SEM from at least three independent experiments. Statistically significant differences between PDLSCs and DPSCs by t test: *P < 0.05; **P < 0.01
The obtained results demonstrated that IL‐33 decreased ALP activity in PDLSCs and DPSCs during treatment in OM, without changing their basal ALP activity in GM. Compared to DPSCs, PDLSCs showed significantly higher ALP activity (Figure 2C and 2D). IL‐33 did not alter Runx2 and ALP gene expression level in PDLSCs and DPSCs, while, compared to DPSCs, PDLSCs showed significantly higher expression of both molecules in the absence or presence of IL‐33 (Figure 2E). On contrary, both IL‐33‐pretreated cell types possessed significantly increased ALP activity in GM as well as in OM, while the level of ALP activity was significantly higher in PDLSCs than in DPSCs (Figure 2F and 2G).
3.3. Effects of IL‐33 treatment and pretreatment on the late osteogenesis
Alizarin red staining of deposited mineralized matrix in the differentiating cultures revealed that IL‐33 treatment significantly reduces the calcification level achieved in OM in both cell types, while no sign of mineralization was detected in the cells cultivated in GM (Figure 3A and B). Unlike the inhibition of mineralization during IL‐33 treatment, IL‐33‐pretreated cells achieved mineralization, at the similar level as observed in untreated cells (Figure 3C and D). IL‐33 treatment, as well as IL‐33 pretreatment, did not affect chondrogenic nor adipogenic differentiation potential of both cell types (Supplementary Figure S2, Data S1).
Figure 3.
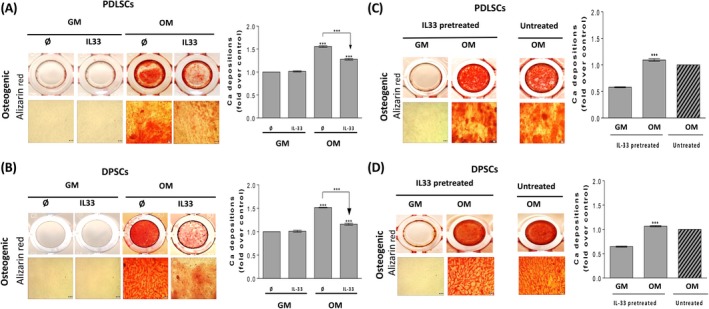
Effect of IL‐33 treatment and pretreatment on osteogenic differentiation capacity of PDLSCs and DPSCs. Osteogenic differentiation detected after 14 d using Alizarin red (Scale bars: 50 µm), quantification of Ca depositions. Representative photographs are shown. (A,B), Cells were cultured in GM and OM with or without IL‐33 (100 ng/mL). Results in graphs are presented as mean ± SEM from at least three independent experiment. Statistically significant differences in comparison with GM in the absence of IL‐33 (set as 1) by t test or in comparison with OM in the absence of IL‐33 according to t test: ***P < 0.001. (C,D), Cells were pretreated with IL‐33 (100 ng/mL) in GM during 7 d when the medium was replaced with OM and further grown for the appropriate time. Results in graphs are presented as means ± SEM of three different samples (n = 3) from at least three independent experiments, while as a control untreated OM (set as 1) was used. Statistically significant difference in comparison with IL‐33 pretreated GM according to t test: ***P < 0.001
These results indicated a complex role of IL‐33 in the regulation of PDLSCs and DPSCs differentiation. Although IL‐33 can inhibit early and late osteogenesis when present simultaneously with the specific differentiation stimuli, pre‐exposure of PDLSCs and DPSCs to this cytokine does not affect their osteogenic differentiation potential.
3.4. Effects of IL‐33 on cell proliferation and β‐galactosidase activity in osteogenic settings
IL‐33 significantly increased only the proliferation of PDLSCs in GM. OM itself significantly increased the proliferation of both cell types after 7 days, whereas the presence of IL‐33 did not alter this stimulatory trend. PDLSCs showed significantly higher proliferation capacity in comparison with DPSCs (Figure 4A). FACS analysis of proliferation marker Ki67 expression within IL‐33‐treated PDLSCs and DPSCs in GM, as well as in OM, showed high percentage of Ki67‐positive cells (over 92% per cent) in all examined groups (Figure 4B). Cellular localization of Ki67 as examined by immunofluorescence staining confirmed that majority of PDLSC and DPSC population was Ki67‐positive, suggesting that low frequency of these cells was in G0 phase of cell cycle (Ki67 negative). Data indicated the presence of Ki67 in cell cytoplasm in basal conditions, while IL‐33 stimulated expression of Ki67 in perinuclear and cytoplasmic region in both cell types in the presence or absence of OM. In PDLSCs, the OM itself elevated Ki67 cytoplasmic staining, while IL‐33 increased Ki67 expression in both GM and OM. IL‐33 induced nuclear localization of Ki67 in PDLSCs in OM. Although IL‐33 stimulated nuclear distribution of Ki67 in DPSCs in GM, this effect was not observed in OM (Figure 4C).
Figure 4.
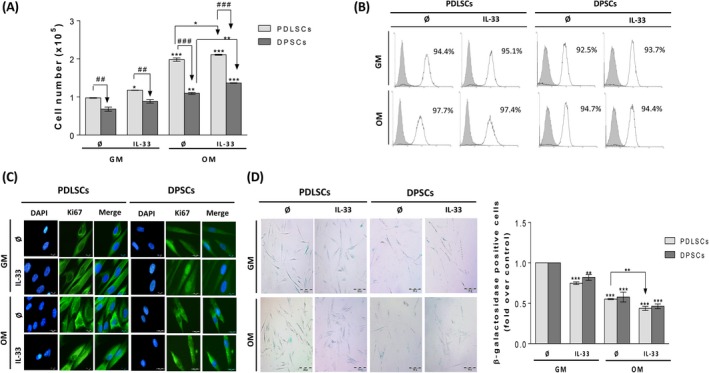
Proliferation, Ki67 expression and β‐galactosidase staining in PDLSCs and DPSCs cultivated in GM and OM in the presence of IL‐33. Cells were grown until confluency and afterwards in GM or OM during 7 d in the presence or absence of IL‐33 (100 ng/mL). A, Proliferation of PDLSCs and DPSCs determined by Trypan blue. Results in graphs are presented as means ± SEM of four different samples (n = 4) from at least three independent experiments. Statistically significant differences in comparison with GM in the absence of IL‐33 by t test: *P < 0.05; **P < 0.01; ***P < 0.001; or in comparison with OM in the absence of IL33: *P < 0.05; **P < 0.01; or between PDLSCs and DPSCs: ## P < 0.01; ### P < 0.001 B, Flow cytometric detection of proliferation‐associated protein Ki67. Representative histograms showing the percentage of Ki67‐positive cells (empty peaks) in comparison with unstained cells as negative control (grey peaks) C, Cellular localization of Ki67 determined by immunofluorescence (Scale bars: 20 µm). DNA was stained with DAPI. D, Detection of single β‐galactosidase‐positive cells. Representative photographs are shown (Scale bars: 200 μm). E, Number of single β‐galactosidase‐positive cells counted per 2000 cells/well in 96‐well plate. Results in graphs are presented as mean ± SEM of three different samples (n = 3) from at least three independent experiments. Statistically significant differences in comparison with GM in the absence of IL‐33 control (set as 1) by t test: **P < 0.01; ***P < 0.001; or in comparison with OM in the absence of IL‐33: **P < 0.01.
The presence of IL‐33 significantly decreased number of β‐galactosidase‐positive PDLSCs and DPSCs in GM. Also, OM significantly reduced β‐galactosidase positivity in both cell types, while IL‐33 additionally significantly supported this effect in PDLSCs and slightly in DPSCs (Figure 4D).
These results indicate that both cell types are highly proliferative in in vitro conditions and that minor part of their populations persists in resting cell state G0. OM increased cell proliferation and Ki67 expression and reduced β‐galactosidase activity, while IL‐33 additionally supported these effects. We supposed that the effects observed in early osteogenesis, the decreased ALP activity, did not occur due to inhibition of proliferation nor senescence induction by IL‐33 in PDLSCs and DPSCs.
3.5. IL‐33‐affected NF‐κB and β‐catenin expression in PDLSCs and DPSCs
Western blot analysis demonstrated that IL‐33 significantly elevated NF‐κB expression in PDLSCs after 30 and 60 minutes, while this effect was ceased after 24 hours. In DPSCs, IL‐33 significantly stimulated NF‐κB expression at all tested time points (Figure 5A). The results showed that IL‐33 significantly inhibited β‐catenin expression after 24 hours in PDLSCs, while in DPSCs, IL‐33 significantly elevated β‐catenin expression after 30 minutes, 60 minutes and 24 hours (Figure 5B).
Figure 5.
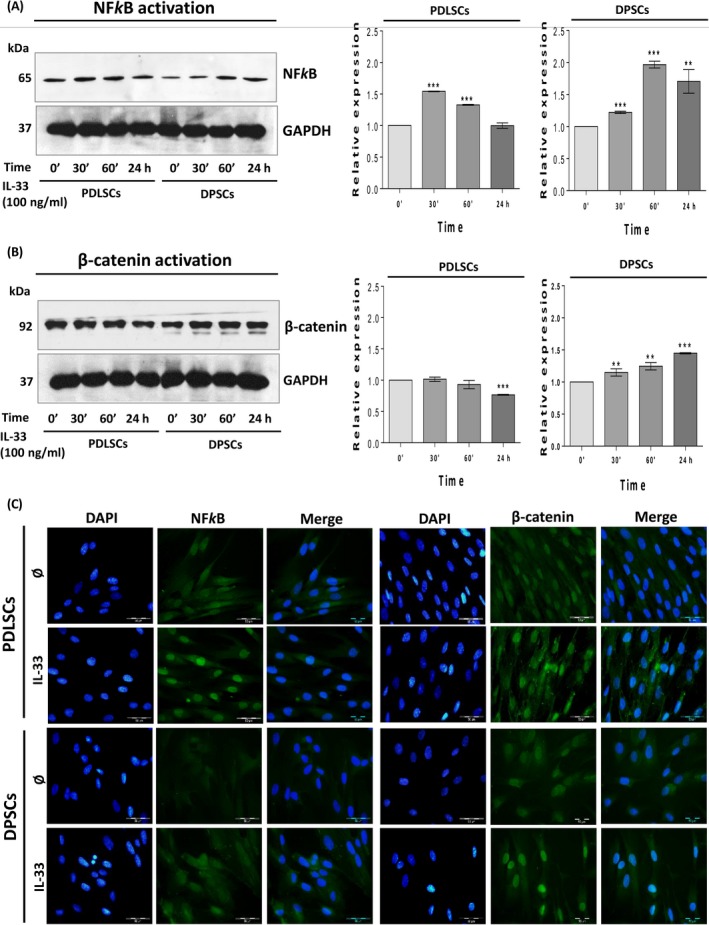
IL‐33‐modified NF‐κB and β‐catenin signalization in PDLSCs and DPSCs. Cells were cultivated in GM with IL‐33 (100 ng/mL). Western blot analysis of total cell proteins was performed to detect A, NF‐κB and B, β‐catenin expression after indicated time of the treatment. Representative photographs of immunoblots are shown. Molecular weights of bands are expressed in kDa. Graphs represent densitometry analysis of NF‐κB and β‐catenin data normalized to GAPDH. Results are presented as mean ± SEM of two different samples (n = 2) from at least three independent experiments. Statistically significant difference versus control (0’ time point, set as 1) by t test: **P < 0.01; ***P < 0.001. C, Cellular localization of NF‐κB and β‐catenin after 72 h of treatment with IL‐33 (100 ng/mL) determined by immunofluorescence staining with FITC‐conjugated corresponding secondary antibodies (Scale bars: 50 µm). DAPI was used to stain DNA. Representative images of three experiments are shown
The analysis of NF‐κB and β‐catenin localization showed that after 72 hours of stimulation with IL‐33, in PDLSCs NF‐κB expression was increased in the nuclear region. Nuclear localization of NF‐κB was also observed in DPSCs after IL‐33 treatment, but in lesser extent than in PDLSCs (Figure 5C). On the other side, the presence of IL‐33 stimulated expression of β‐catenin in nucleus of both PDLSCs and DPSCs (Figure 5C). Obtained data imply that IL‐33 regulates total protein expression level and importantly, subcellular localization of NF‐κB and β‐catenin in PDLSCs and DPSCs.
3.6. Roles of NF‐κB and β‐catenin in IL‐33‐mediated PDLSCs and DPSCs proliferation
To evaluate involvement of NF‐κB and β‐catenin in IL‐33‐elevated proliferation of PDLSCs and DPSCs, in both basal and osteogenic conditions (Figure 3A) we included two chemical inhibitors, ammonium pyrrolidinedithiocarbamate (PDTC, 2 µM, Tocris) as NF‐κB inhibitor and 2‐phenoxybenzoic acid‐[(5‐methyl‐2‐furanyl)methylene] hydrazide (PNU 74654, 5 µM, Sigma‐Aldrich) which binds β‐catenin and inhibits Wnt signalling. The presence of PDTC slightly increased basal proliferation, while not changing IL‐33 increased proliferation in PDLSCs in GM. PNU inhibitor increased proliferation of PDLSCs in GM, while abolished IL‐33‐stimulated PDLSCs’ proliferation (Figure 6A). In OM, with or without IL‐33, PDTC only slightly increased PDLSCs’ proliferation while PNU significantly inhibited IL‐33‐increased proliferation of PDLSCs, without affecting the PDLSCs proliferation in the absence of IL‐33 (Figure 6A). In GM, the presence of both inhibitors did not affect proliferation of DPSCs, while in the presence of IL‐33, only PDTC slightly stimulated proliferation of DPSCs (Figure 6B). In OM, PDTC significantly reduced IL‐33‐increased DPSCs’ proliferation, without effect when applied alone. On the other side, PNU itself supported proliferation of DPSCs, but not altering IL‐33‐stimulated proliferation of DPSCs (Figure 6B).
Figure 6.
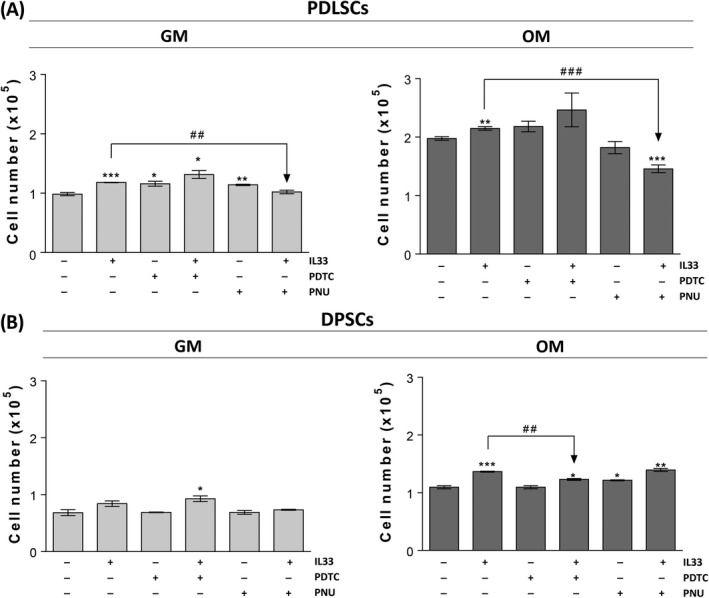
Effects of IL‐33‐modified NF‐κB and β‐catenin signalization on proliferation of PDLSCs and DPSCs. Cells were grown until confluency and afterwards in GM or OM during 7 d in the presence or absence of IL‐33 (100 ng/mL) with or w/o 2 µM NF‐κB inhibitor (PDTC, Tocris) and 5 µM β‐catenin inhibitor (PNU, Sigma‐Aldrich). Inhibitors were added in cell culture 30 min prior to IL‐33. Cell number was determined by Trypan blue. Results in graphs are presented as means ± SEM of three different samples (n = 3) from at least three independent experiments. Statistically significant difference in comparison with GM in the absence of IL‐33 by t test: *P < 0.05; **P < 0.01; ***P < 0.001; or in comparison with IL‐33 treatment: ## P < 0.01; ### P < 0.001
3.7. Involvement of NF‐κB and β‐catenin in IL‐33‐stimulated pluripotency‐associated marker expression
Results obtained for PDLSCs showed that PDTC inhibitor abolished OCT‐4A protein expression in the absence and presence of IL‐33, while PNU abrogated IL‐33‐stimulated OCT‐4A protein expression without affecting basal OCT‐4A expression in these cells. However, IL‐33 significantly stimulated Oct‐4A and Oct‐4B mRNA expression, while the presence of PDTC and PNU, although not affecting basal OCT‐4A and Oct‐4B mRNA expression, failed to alter IL‐33‐stimulated OCT‐4A. On the other side, PDTC abolished IL‐33‐stimulated Oct‐4B mRNA expression in PDLSCs. As for the SOX‐2 expression in PDLSCs, PDTC inhibitor did not change either basal or IL‐33‐stimulated SOX‐2 protein and mRNA. On contrary, PNU supported basal and IL‐33‐stimulated SOX‐2 protein and mRNA expression in these cells. The basal NANOG protein and mRNA expression were not affected by PDTC inhibitor, while in the presence of IL‐33 this inhibitor slightly decreased NANOG protein expression, leading to NANOG localization to nucleus, whereas IL‐33‐stimulated NANOG mRNA expression was reduced. PNU inhibitor, also favoured nuclear localization of NANOG protein in the presence of IL‐33, slightly stimulating basal NANOG protein expression. The basal NANOG mRNA expression in PDLSCs was not changed by PNU, although PNU slightly reduced the IL‐33‐enhancing effect (Figure 7A). Taken together, PDTC attenuated IL‐33‐stimulated OCT‐4A and NANOG protein expression, while PNU inhibited IL‐33‐supported OCT‐4A protein expression in PDLSCs. mRNA analysis indicated that only PDTC decreased IL‐33‐stimulated mRNA expression of Oct‐4B.
Figure 7.
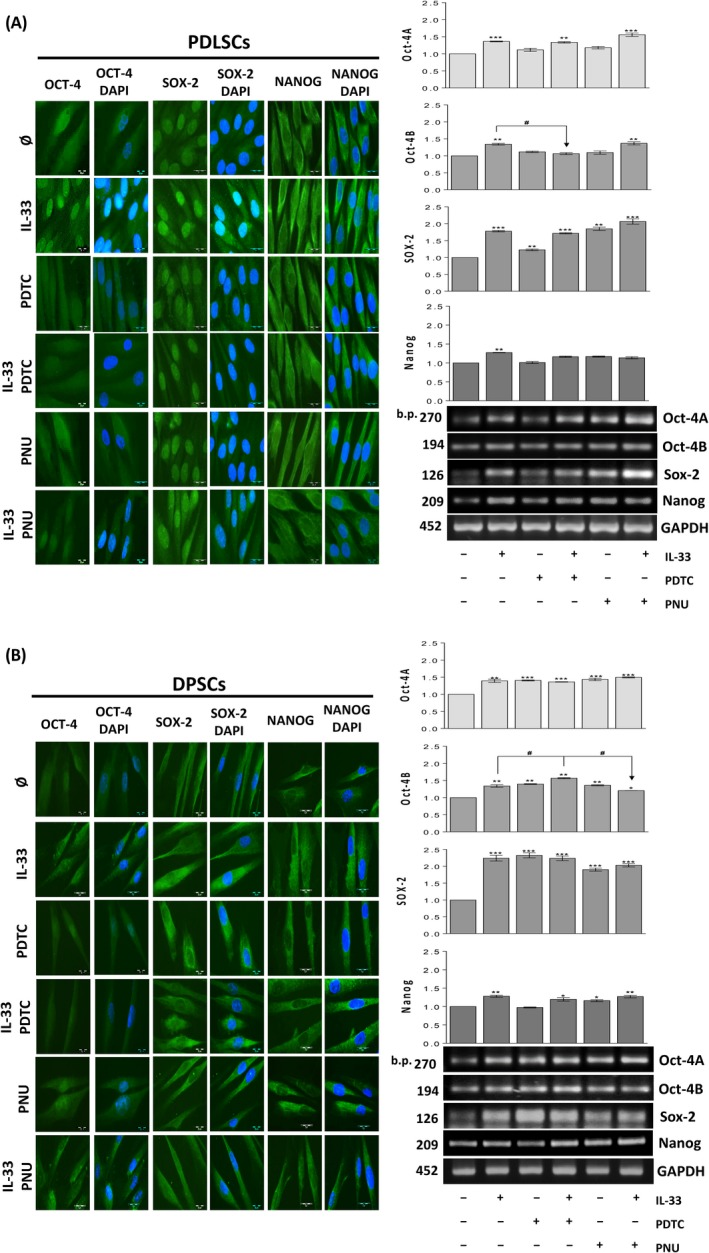
Involvement of IL‐33‐modified NF‐κB and β‐catenin signalization in pluripotency marker expression. (A,B), cells were grown in GM during 7 d in the presence or absence of IL‐33 (100 ng/mL) with or w/o 2 µM PDTC and 5 µM PNU. Inhibitors were added in cell culture 30 min prior to IL‐33. Expression of pluripotency‐related transcription factors: Oct4, SOX‐2 and NANOG detected by indirect immunofluorescence staining with FITC‐conjugated corresponding secondary antibodies (Scale bars: 20 µm). DNA was stained with DAPI. For mRNA analysis, and cells were cultivated in GM in the presence or absence of IL‐33 (100 ng/mL) with or w/o 5 µM PDTC and 2 µM PNU during 24 h. As a gel loading control, GAPDH was used. Representative gels are shown. Molecular weight standards are indicated in bp for PCR products. Results in graphs represent relative gene expression of indicated gene and are shown as mean ± SEM of three different samples (n = 3) from at least three independent experiments. Statistically significant differences in comparison with control (untreated cells, set as 1) by t test: *P < 0.05; **P < 0.01; ***P < 0.001; or in comparison with IL‐33 treatment: # P < 0.05
The same analysis performed for DPSCs demonstrated that IL‐33 increased OCT‐4 protein expression in cytoplasm and nuclear region. The PDTC inhibitor itself only slightly stimulated OCT‐4 protein expression, but diminished its IL‐33‐increased expression. PNU inhibitor stimulated basal, without affecting the IL‐33‐stimulated OCT‐4 protein expression. These effects were partly followed with the RT‐PCR analysis, in which PDTC and PNU stimulated basal, without altering IL‐33‐stimulated, OCT‐4A mRNA expression in DPSCs. On the other side, PDTC inhibitor increased, while PNU inhibitor slightly inhibited IL‐33‐stimulated Oct‐4B mRNA expression. As for the SOX‐2, the presence of PDTC and PNU inhibitors increased the basal, but inhibited the IL‐33‐stimulated SOX‐2 protein expression mostly in cytoplasm. Both inhibitors, PDTC and PNU, also increased the basal, SOX‐2 mRNA expression, however, not altering the stimulated expression by IL‐33. The basal NANOG protein expression was also increased by the presence of both inhibitors in the culture. However, PDTC and PNU inhibited the IL‐33‐stimulated NANOG protein expression mostly in cytoplasm. At the mRNA level, although both inhibitors did not change IL‐33‐increased NANOG mRNA expression, PDTC did not alter, while PNU inhibitor increased basal NANOG mRNA expression in DPSCs (Figure 7B). In general, PDTC diminished IL‐33‐increased protein expression of OCT‐4A, SOX‐2 and NANOG, while PNU attenuated IL‐33‐stimulated SOX‐2 and NANOG protein expression. Except Oct4B mRNA which was decreased by PNU, inhibitors did not alter IL‐33‐increased pluripotency marker gene expression.
3.8. Roles of NF‐κB and β‐catenin in IL‐33‐affected osteogenesis
Our results showed that inhibitors’ presence accomplished similar effects in PDLSCs (Figure 8A, B) and DPSCs (Figure 8D, E). Namely, PDTC and PNU inhibitors restored IL‐33‐reduced ALP activity and Ca deposition levels in both cell types, without affecting the basal osteogenic differentiation (Figure 8A, B, D, E). Surprisingly, RT‐PCR results did not reveal any significant effect of the presence of PDTC and PNU on Runx2 and ALP gene expression which stayed unaffected after IL‐33 treatment in both cell type (Figure 8C, F).
Figure 8.
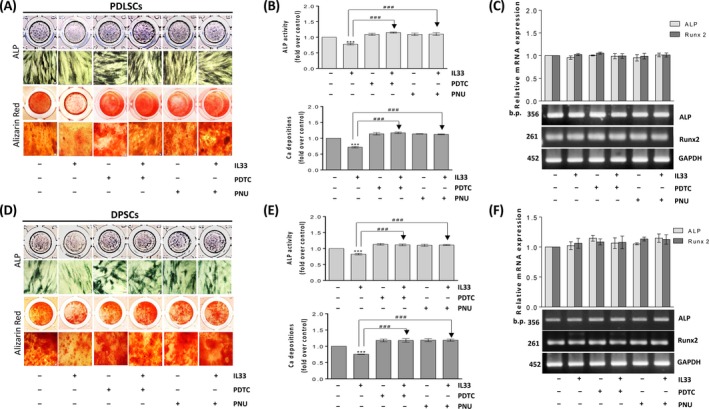
Effects of IL‐33‐modified NF‐κB and β‐catenin signalization in osteogenesis of PDLSCs and DPSCs. Cells were grown until confluency and afterwards in OM in the presence or absence of IL‐33 (100 ng/mL) during 7 or 14 d with or w/o 2 µM PDTC and 5 µM PNU. Inhibitors were added in cell culture 30 min prior to IL‐33. (A,D), Osteogenic differentiation detected based on ALP activity and Alizarin red (Scale bars: 50 µm). (B,E), Quantification of ALP activity and Ca depositions. (C,F), For mRNA analysis, cells were cultivated in GM in the presence or absence of IL‐33 (100 ng/mL) with or w/o 2 µM PDTC and 5 µM PNU during 24 h. Inhibitors were added in cell culture 30 min prior to IL‐33. As a gel loading control, GAPDH was used. Representative gels are shown. Molecular weight standards are indicated in bp for PCR products. Results in graphs are presented as means ± SEM of three different samples (n = 3) from at least three independent experiments. Statistically significant differences in comparison with control (untreated cells, set as 1) by t test: ***P < 0.001; or in comparison with IL‐33 treatment: ### P < 0.001
4. DISCUSSION
The goal of this study was to evaluate the in vitro effects of IL‐33 on main functional properties of PDLSCs and DPSCs, by addressing their basal stemness‐related features, such as colony‐forming capacity, proliferation, expression of pluripotency‐associated markers and differentiation, especially referring to osteogenesis.
The PDLSCs and DPSCs used in our study, as resident population of progenitor cells of periodontal ligament and dental pulp, share characteristics with the bone marrow mesenchymal stem/stromal cells (BM‐MSC), such as their colony‐forming capacity,in vitro trilineage differentiation and surface markers expression.31 Although PDLSCs and DPSCs share close anatomical location, differences between these cells were observed in mineral composition generation,32 stability after ectopic transplantation,33 hard tissue formation and alkaline phosphatase activity,34 proteome24 and gene expression.35 As PDLSCs and DPSCs respond to specific stimuli triggered by inflammation or injury, which affect cell recruitment and proliferation in dental regions,36 it is probable that their responsiveness to the microenvironment stimuli may be different. Release of IL‐33 in periodontal ligament caused by tooth movement in mice model regulates alveolar bone remodelling, inhibiting differentiation of osteoclasts and stimulating osteoblast accumulation.37 Although IL‐33 is recognized as important cytokine in bone physiology, its effects on human dental stem cells functionality are still unknown.
Our results demonstrated that IL‐33 cytokine did not alter the viability nor the immunophenotype of both PDLSCs and DPSCs, while DPSCs expressed lower growth rate in comparison with PDLSCs in all passages, as it was also reported.24 Both investigated cell types maintained their growth rate during prolonged in vitro culture, as it has previously been revealed.38 Since PDL and DP inhabit in soft connective tissues surrounded by hard, mineralized tissues, the regulation of cell mineralization/osteogenesis level is the main physiological demand within these tissues. To evaluate effects of IL‐33 on PDLSCs and DPSCs proliferation and osteogenic differentiation, we adjusted our experimental settings to quantify the cell number and the efficiency of CFU‐Fs, as well as the efficiency of ALP+ CFUs, called CFU‐Os, colonies containing osteoblast lineage progenitors. We found that IL‐33 stimulates CFU‐F clonogenicity of dental stem cells in GM, while PDLSCs possess higher CFU‐F efficiency than DPSCs. When the percentage of ALP+ CFU‐F (CFU‐O) was determined, PDLSCs showed significantly higher CFU‐O capacity in GM in comparison with DPSCs. The effect of IL‐33 in GM was not so evident, but in OM, significant reduction in CFU‐O was demonstrated for both PDLSCs and DPSCs. However, OM significantly increased CFU‐O efficiency in DPSCs. These results imply that PDLSCs population contains higher frequency of osteoblast lineage progenitors than DPSCs, while the significantly higher number of the total CFU‐Fs may be related to higher proliferation rate of PDLSCs. Since the size of osteoblastic precursor pool in mouse BM‐MSC plays important role in regulating bone formation and resorption,39 our results point to possible differences in osteogenic commitment between PDLSCs and DPSCs. In our study, IL‐33 presence impaired ALP activity and mineralization levels in PDLSCs and DPSCs, while 7‐day IL‐33‐pretreated cells showed increased basal, as well as induced ALP activity and restored mineralization. Even we detected differences in ALP activity, we did not found any significant change in Runx2 and ALP mRNA expression after IL‐33 stimulation in PDLSCs and DPSCs. Osteogenesis‐related effects of Runx2 and ALP are time and concentration dependent.40 The actions of the Runx2 gene may be mediated by upregulation of protein levels and/or activation of the Runx2 transcript, while osteogenesis is predominantly associated with increased Runx2 activity, without a change in mRNA or protein levels.41, 42 As IL‐33 can stimulate activation of mitogen‐activated protein kinases in dental stem cells (our unpublished data), it is possible that Runx2 phosphorylation might be involved in regulation of its activity instead of gene expression.41, 43 We anticipate that additional analysis of IL‐33 effects on osteogenic markers is necessary, to reveal protein and genes expression/activities in a wider time range.
Stimulatory effect of IL‐33 on the proliferation of PDLSCs and DPSCs was accompanied by sustained high Ki67 positivity in both cell types. PDLSCs population exhibited higher proliferation rate than DPSCs and the OM per se increased proliferation of untreated and treated PDLSCs and DPSCs. The percentages of Ki67‐positive cells detected in our study for both cell types were different but comparable to those reported for rat BM‐MSC44 or adipose tissue stem cells,45 where >80% or >70% of Ki67‐positive were found, respectively. As Ki67 is expressed in all cell cycle phases except G0, it can be concluded that majority of PDLSCs and DPSCs (≥90%) are actively dividing cells, indicating their function as immature osteoprogenitors, where their proliferation significantly contributes to bone tissue remodelling phase.46 Our study revealed predominantly Ki67 cytoplasmic staining in dental stem cells and similar was found in ASCs.45 Since there are few evidences regarding Ki67 expression in dental stem cells, it would be reasonable to find out precise biological role of nuclear and cytoplasmic Ki67.
Activation of NF‐κB by IL‐33 has been shown in different cell types, such as fibroblast‐like synoviocytes,47 endothelial cells48 and human HEK293RI cells.49 Here, for the first time, we showed that IL‐33 stimulated activation of NF‐κB in PDLSCs and DPSCs. The observed IL‐33 increased proliferation of DPSCs, achieved via NF‐κB activation, when cultivated in the presence of osteogenic stimuli, is in agreement with previous report demonstrating that inflammatory cytokine IFN‐γ‐promoted DPSC proliferation via NF‐κB.50 Observed involvement of NF‐κB activation in the inhibition of ALP activity and matrix mineralization achieved by IL‐33 treatment were also in accordance with previously reported data for PDLSCs51 and DPSCs.50 The β‐catenin, as part of canonical Wnt signalling, controls neural stem cell proliferation52 and has important role in tooth biology.53 Here, IL‐33‐elevated proliferation of PDLSCs was achieved by β‐catenin activation, but also the inhibitory effects of IL‐33 on PDLSC and DPSC osteogenesis. Previous contradictory reports regarding β‐catenin‐mediated promotion of osteogenic differentiation of PDLSCs53, 54 on one side and suppression of DPSC osteogenesis55 on the other imply that the role of β‐catenin signalling in osteogenesis is not fully comprehended. However, inhibition of osteogenic differentiation is mediated through NF‐κB activation, which further on promoted β‐catenin ubiquitination and degradation in human and mouse MSCs.56 Therefore, it can be assumed that cooperation of NF‐κB and β‐catenin may exist and be involved in regulation of dental stem cell functions, too.
We found that IL‐33 decreased β‐galactosidase activity in PDLSCs and DPSCs simultaneously with stimulation of their proliferation capacity. The inhibition of β‐galactosidase activity was additionally strengthened in OM, which can independently reduce β‐galactosidase activity in both cell types. Important stimulator of osteogenesis in OM, ascorbic acid‐2‐phosphate increases proliferative capacity by attenuating senescence and expression of reactive oxygen species in human osteoarthritic osteoblast.57 Whether the antioxidative effect is also mechanism of the action of IL‐33 needs to be further investigated. Promotion of cell divisions and increased ALP activity in human and mouse BM‐MSCs could be the mechanism through which reduction in senescence can be achieved.58 However, our data indicated that the inhibitory effect of IL‐33 treatment on osteogenesis was not achieved through antiproliferative or pro‐ageing mechanism.
Important outcome from our study is the observation that IL‐33 stimulated protein and gene expression of pluripotency‐associated markers, OCT4, SOX‐2 and NANOG in both cell populations investigated. Much of the research up to now has been descriptive in nature of significance of these markers expression in MSC biology. For our knowledge, there is no evidence about the influence of IL‐33 on stemness genes in primary progenitors. However, studies showed that IL‐33 supported stemness in breast59 and colorectal60 cancer cell types, through stimulation of pluripotency marker expression. Human PDLSCs and DPSCs retain stemness genes and proliferation for prolonged time during in vitro cultivation, 38 and expression of stemness markers was often associated with their origin from neural crest (stem) cells which migrate and establish stem cell pools through the anatomical sites such as dental region or even bone marrow.61, 62 Our previous study demonstrated that DPSCs and PDLSCs express pluripotency markers in higher extent than other adult stem cells, such as adipose tissue progenitors.63 The elevated pluripotency marker expression accompanied with IL‐33‐stimulated proliferation and clonogenicity of PDLSCs and DPSCs is in accordance with previous studies demonstrating overexpression of OCT4A,64 SOX‐265 and NANOG66 associated with increased proliferation of DPSCs or clonogenic capacity of human BM‐MSCs.67 Liu et al also reported that OCT‐4A overexpression in DPSCs leads to upregulation of other pluripotency genes, such as Oct4B1, SOX‐2, NANOG, Klf4 and c‐Myc, thus indicating possible close mutual cooperation of these transcriptional factors.64 Contrary to OCT‐4A, the role of OCT4B in pluripotency is not clear. However, it may be assumed that OCT4B actually governs self‐renewal and maintenance of tissue homeostasis within adult tissues.68 Previous studies indicated that OCT4B might be involved in cellular stress response69 and antiapoptotic activity in cancer cells.70, 71 Importantly, OCT4B may indirectly be increased in dental pulp tissues and dental pulp cells exposed to proinflammatory factors, where it has been suggested that OCT4B represents a antiapoptotic mediator and subsequently may be the important factor in dental regeneration.72 Our results indicate that IL‐33 increases expression of OCT4B mRNA expression in both PDLSCs and DPSCs. Whether IL‐33‐stimulated OCT4B has some regulatory role in dental stem cell phenotype and behaviour needs to be additionally investigated. Previously, the role of NF‐κB signalling in maintenance of pluripotency of human iPSC was shown, as the augmented NF‐κB activity correlated with increased expression of OCT‐4A and NANOG, sustaining human iPSC in undifferentiated state.73 Our analysis also showed that the activation of NF‐κB is involved in IL‐33‐upregulated Oct4 and NANOG expression in PDLSCs and Oct4, SOX‐2 and NANOG in DPSCs. Additionally, IL‐33‐mediated β‐catenin activity stimulated Oct4A, Oct4B and NANOG expression in PDLSCs, and Oct4B, SOX‐2 and NANOG in DPSCs. The important role of β‐catenin in regulating expression of stemness markers in embryonic stem cells74 and human BM‐MSCs75 was also shown. Although SOX‐2 is involved in the suppression of osteogenic differentiation of human osteoblast cell line via β‐catenin activity,76 the roles of pluripotency markers beside self‐renewal regulation are still not clarified.
In summary, our study brings new evidence about the effects of IL‐33 on dental stem cell functions. It can be concluded that IL‐33 treatment impairs PDLSC and DPSC osteogenesis, favouring their proliferation and clonogenicity, but not diminishing their differentiation potential. These findings suggest that IL‐33 might delay dental stem cell pool exhaustion caused by activation stimuli, triggered by inflammation or stress, which initiate their functional response.
CONFLICT OF INTEREST
There are no conflicts to declare.
Supporting information
ACKNOWLEDGEMENTS
This work is funded by Ministry of Education, Science and Technological Development, Republic of Serbia, Grant #175062. Work of Dr. J. Krstić was additionally supported by the fellowship ‘Start up for Science, Serbia' 2015/2016 (Company Philip Morris). The Authors are grateful to Dr. Maja Miletić, Department of Pathophysiology, School of Dental Medicine, University of Belgrade, for scientific collaboration. Also, we are thankful to Dr. Srdja Janković, MD at the University Children's Hospital, Belgrade, Serbia. The authors are grateful to Mrs Snežana Marković for the excellent technical assistance.
Kukolj T, Trivanović D, Mojsilović S, et al. IL‐33 guides osteogenesis and increases proliferation and pluripotency marker expression in dental stem cells. Cell Prolif. 2019;52:e12533 10.1111/cpr.12533
REFERENCES
- 1. Miler AM, Liew FY. The IL‐33/ST2 pathway‐A new therapeutic target in cardiovascular disease. Pharmacol Ther. 2011;131:179‐186. [DOI] [PubMed] [Google Scholar]
- 2. Liew FY, Girard JP, Turnquist HR. Interleukin‐33 in health and disease. Nat Rev Immunol. 2016;16:676‐689. [DOI] [PubMed] [Google Scholar]
- 3. Cayrol C, Girard JP. IL‐33: an alarmin cytokine with crucial roles in innate immunity, inflammation and allergy. Curr Opin Immunol. 2014;31:31‐37. [DOI] [PubMed] [Google Scholar]
- 4. Chan JK, Roth J, Oppenheim JJ et al. Alarmins: awaiting a clinical response. J Clin Invest. 2012;122:2711‐2719. [DOI] [PMC free article] [PubMed] [Google Scholar]
- 5. Yang R, Yu T, Zhou Y. Interplay between craniofacial stem cells and immune stimulus. Stem Cell Res Ther. 2017;8:147 10.1186/s13287-017-0607-1 [DOI] [PMC free article] [PubMed] [Google Scholar]
- 6. Tada H, Shimauchi H, Takada H, Matsushita K. Possible Roles of IL‐33 in Periodontal Diseases: Porphyromonas gingivalis Induced IL‐33 in human gingival epithelial cells In: Sasaki K, Suzuki O, Takahashi N, eds. Interface Oral Health Science 2014. Tokyo: Springer; 2015. 293–303. [Google Scholar]
- 7. Sağlam M, Köseoğlu S, Aral CA, Savran L, Pekbağrıyanık T, Çetinkaya A. Increased levels of interleukin‐33 in gingival crevicular fluids of patients with chronic periodontitis. Odontology. 2017;105:184–190. [DOI] [PubMed] [Google Scholar]
- 8. Lapérine O, Cloitre A, Caillon J, et al. Interleukin‐33 and RANK‐L interplay in the alveolar bone loss associated to periodontitis. PLoS One. 2016;11:e0168080. eCollection 2016. [DOI] [PMC free article] [PubMed] [Google Scholar]
- 9. Malcolm J, Awang RA, Oliver‐Bell J et al. IL‐33 exacerbates periodontal disease through induction of RANKL. J Dent Res. 2015;94:968–975. [DOI] [PubMed] [Google Scholar]
- 10. Velickovic M, Pejnovic N, Petrovic R et al. Expression of interleukin‐33 and its receptor ST2 in periapical granulomas and radicular cysts. J Oral Pathol Med. 2016;45:70–76. [DOI] [PubMed] [Google Scholar]
- 11. Santos S, Couto LA, Fonseca JM et al. Participation of osteoclastogenic factors in immunopathogenesis of human chronic periapical lesions. J Oral Pathol Med. 2017;46:846–852. [DOI] [PubMed] [Google Scholar]
- 12. Zehnder M, Belibasakis GN. On the dynamics of root canal infections‐what we understand and what we don't. Virulence. 2015;6:216–222. [DOI] [PMC free article] [PubMed] [Google Scholar]
- 13. Sasaki H, Hirai K, Martins CM, Furusho H, Battaglino R, Hashimoto K. Interrelationship between periapical lesion and systemic metabolic disorders. Curr Pharm Des. 2016;22:2204–2215. [DOI] [PMC free article] [PubMed] [Google Scholar]
- 14. Sedgley CM, Botero TM. Dental stem cells and their sources. Dent Clin North Am. 2012;56:549–561. 10.1016/j.cden.2012.05.004 [DOI] [PubMed] [Google Scholar]
- 15. Lee SM, Zhang Q, Le AD. Dental stem cells: sources and potential applications. Curr Oral Health Rep. 2014;1:34–42. [Google Scholar]
- 16. Xiao L, Nasu M. From regenerative dentistry to regenerative medicine: progress, challenges, and potential applications of oral stem cells. Stem Cells Cloning. 2014;7:89–99. eCollection 2014. 10.2147/SCCAA.S51009 [DOI] [PMC free article] [PubMed] [Google Scholar]
- 17. Yu C, Abbott PV. An overview of the dental pulp: its functions and responses to injury. Aust Dent J. 2007;52:S4–S16. [DOI] [PubMed] [Google Scholar]
- 18. Tatullo M, Marrelli M, Shakesheff KM, White LJ. Dental pulp stem cells: function, isolation and applications in regenerative medicine. J Tissue Eng Regen Med. 2015;9:1205–1216. [DOI] [PubMed] [Google Scholar]
- 19. Demarco FF, Conde M, Cavalcanti B, Casagrande L, Sakai V, Nör JE. Dental pulp tissue engineering. Braz Dent J. 2011;22:3–13. [DOI] [PMC free article] [PubMed] [Google Scholar]
- 20. Maeda H, Wada N, Fujii S, Tomokiyo A, Akamine A. Periodontal ligament stem cells In: Ali G, eds. Stem Cells in Clinic and Research. London: InTech; ISBN 978‐953‐307‐797‐0; 619‐636. [Google Scholar]
- 21. Lekic P, McCulloch C. Periodontal ligament cell populations: the central role of fibroblasts in creating a unique tissue. Anat Rec. 1996;245:327–341. [DOI] [PubMed] [Google Scholar]
- 22. Nanci A, Bosshardt DD. Structure of periodontal tissues in health and disease. Periodontol 2000. 2006;40:11–28. [DOI] [PubMed] [Google Scholar]
- 23. Volponi AA, Pang Y, Sharpe PT. Stem cell‐based biological tooth repair and regeneration. Trends Cell Biol. 2010;20:715–722. [DOI] [PMC free article] [PubMed] [Google Scholar]
- 24. Eleuterio E, Trubiani O, Sulpizio M et al. Proteome of human stem cells from periodontal ligament and dental pulp. PLoS One. 2013;8:e71101. [DOI] [PMC free article] [PubMed] [Google Scholar]
- 25. Hakki SS, Kayis SA, Hakki EE et al. Comparison of mesenchymal stem cells isolated from pulp and periodontal ligament. J Periodontol. 2015;86:283–291. [DOI] [PubMed] [Google Scholar]
- 26. Han N, Zheng Y, Li R, et al. β‐catenin enhances odontoblastic differentiation of dental pulp cells through activation of Runx2. PLos One. 2014;9:e88890 eCollection 2014. [DOI] [PMC free article] [PubMed] [Google Scholar]
- 27. Miletić M, Mojsilović S, Okić Đorđević I et al. Mesenchymal stem cells isolated from human periodontal ligament. Arch Biol Sci. 2014;66:261–271. [Google Scholar]
- 28. Nikolić N, Krstić A, Trivanović D et al. Mesenchymal stem cell properties of dental pulp cells from deciduous teeth. Arch Biol Sci. 2011;63:933–942. [Google Scholar]
- 29. Kukolj T, Trivanoviċ D, Okić Djordjević I et al. Lipopolysaccharide can modify differentiation and immunomodulatory potential of periodontal ligament stem cells via ERK1,2 signaling. J Cell Physiol. 2018;233:447–462. [DOI] [PubMed] [Google Scholar]
- 30. Dmitrieva RI, Minullina IR, Bilibina AA, Tarasova OV, Anisimov SV, Zaritskey AY. Bone marrow‐and subcutaneous adipose tissue‐derived mesenchymal stem cells: differences and similarities. Cell Cycle. 2012;11:377–383. [DOI] [PubMed] [Google Scholar]
- 31. Sacchetti B, Funari A, Remoli C et al. No Identical "mesenchymal stem cells" at different times and sites: human committed progenitors of distinct origin and differentiation potential are incorporated as adventitial cells in microvessels. Stem Cell Reports. 2016;6:897–913. [DOI] [PMC free article] [PubMed] [Google Scholar]
- 32. Volponi AA, Gentleman E, Fatscher R, Pang YW, Gentleman MM, Sharpe PT. Composition of mineral produced by dental mesenchymal stem cells. J Dent Res. 2015;94:1568–1574. [DOI] [PMC free article] [PubMed] [Google Scholar]
- 33. Lei M, Li K, Li B, Gao LN, Chen FM, Jin Y. Mesenchymal stem cell characteristics of dental pulp and periodontal ligament stem cells after in vivo transplantation. Biomaterials. 2014;35:6332–6343. [DOI] [PubMed] [Google Scholar]
- 34. Cha Y, Jeon M, Lee HS et al. Effects of in vitro osteogenic induction on in vivo tissue regeneration by dental pulp and periodontal ligament stem cells. J Endod. 2015;41:1462–1468. [DOI] [PubMed] [Google Scholar]
- 35. Ponnaiyan D, Bhat KM, Bhat GS. Comparison of immuno‐phenotypes of stem cells from human dental pulp and periodontal ligament. Int J Immunopathol Pharmacol. 2012;25:127–134. [DOI] [PubMed] [Google Scholar]
- 36. Abdel Meguid E, Ke Y, Ji J, El‐Hashash A. Stem cells applications in bone and tooth repair and regeneration: new insights, tools, and hopes. J Cell Physiol. 2018;233:1825–1835. [DOI] [PubMed] [Google Scholar]
- 37. Lima IL, Macari S, Madeira MF et al. Osteoprotective effects of IL‐33/ST2 link to osteoclast apoptosis. Am J Pathol. 2015;185:3338–3348. [DOI] [PubMed] [Google Scholar]
- 38. Diomede F, Rajan TS, Gatta V, et al. Stemness maintenance properties in human oral stem cells after long‐term passage. Stem Cells Int. 2017;2017:1–14. ID 5651287. 10.1155/2017/5651287 [DOI] [PMC free article] [PubMed] [Google Scholar]
- 39. Shahnazari M, Chu V, Wronski TJ, Nissenson RA, Halloran BP. CXCL12/CXCR39 signaling in the osteoblast regulates the mesenchymal stem cell and osteoclast lineage populations. FASEB J. 2013;27:3505–3513. [DOI] [PubMed] [Google Scholar]
- 40. Xu J, Li Z, Hou Y, Fang W. Potential mechanisms underlying the Runx2 induced osteogenesis of bone marrow mesenchymal stem cells. Am J Transl Res. 2015;7:2527–2535. [PMC free article] [PubMed] [Google Scholar]
- 41. Shui C, Spelsberg TC, Riggs BL, Khosla S. Changes in Runx2/Cbfa1 expression and activity during osteoblastic differentiation of human bone marrow stromal cells. J Bone Miner Res. 2003;18:213–221. [DOI] [PubMed] [Google Scholar]
- 42. Osyczka AM, Diefenderfer DL, Bhargave G, Leboy PS. Different effects of BMP‐2 on marrow stromal cells from human and rat bone. Cells Tissues Organs. 2004;176:109–119. [DOI] [PMC free article] [PubMed] [Google Scholar]
- 43. Li Y, Ge C, Franceschi RT. MAP Kinase‐dependent RUNX2 phosphorylation is necessary for epigenetic modification of chromatin during osteoblast differentiation. J Cell Physiol. 2017;232:2427–2435. [DOI] [PMC free article] [PubMed] [Google Scholar]
- 44. Yang JX, Zhang N, Wang HW, Gao P, Yang QP, Wen QP. CXCR44 receptor overexpression in mesenchymal stem cells facilitates treatment of acute lung injury in rats. J Biol Chem. 2015;290:1994–2006. [DOI] [PMC free article] [PubMed] [Google Scholar]
- 45. Nawrocka D, Kornicka K, Szydlarska J, Marycz K. Basic fibroblast growth factor inhibits apoptosis and promotes proliferation of adipose‐derived mesenchymal stromal cells isolated from patients with type 2 diabetes by reducing cellular oxidative stress. Oxid Med Cell Longev. 2017;2017:3027109 10.1155/2017/3027109 [DOI] [PMC free article] [PubMed] [Google Scholar]
- 46. Kristensen HB, Andersen TL, Marcussen N, Rolighed L, Delaisse JM. Osteoblast recruitment routes in human cancellous bone remodeling. Am J Pathol. 2014;184:778–789. [DOI] [PubMed] [Google Scholar]
- 47. Lee EJ, So MW, Hong S, Kim YG, Yoo B, Lee CK. Interleukin‐33 acts as a transcriptional repressor and extracellular cytokine in fibroblast‐like synoviocytes in patients with rheumatoid arthritis. Cytokine. 2016;77:35–43. [DOI] [PubMed] [Google Scholar]
- 48. Choi YS, Park JA, Kim J et al. Nuclear IL‐33 is a transcriptional regulator of NF‐κB p65 and induces endothelial cell activation. Biochem Biophys Res Commun. 2012;421:305–311. [DOI] [PubMed] [Google Scholar]
- 49. Ali S, Mohs A, Thomas M et al. The dual function cytokine IL‐33 interacts with the transcription factor NF‐κB to dampen NF‐κB‐stimulated gene transcription. J Immunol. 2011;187:1609–1616. [DOI] [PubMed] [Google Scholar]
- 50. He X, Jiang W, Luo Z et al. IFN‐γ regulates human dental pulp stem cells behavior via NF‐κB and MAPK signaling. Sci Rep. 2017;7:40681 10.1038/srep40681 [DOI] [PMC free article] [PubMed] [Google Scholar]
- 51. Li C, Li B, Dong Z et al. Lipopolysaccharide differentially affects the osteogenic differentiation of periodontal ligament stem cells and bone marrow mesenchymal stem cells through Toll‐like receptor 4 mediated nuclear factor κB pathway. Stem Cell Res Ther. 2014;5:67 10.1186/scrt456 [DOI] [PMC free article] [PubMed] [Google Scholar]
- 52. Qi C, Zhang J, Chen X et al. Hypoxia stimulates neural stem cell proliferation by increasing HIF‐1α expression and activating Wnt/β‐catenin signaling. Cell Mol Biol (Noisy‐le‐grand). 2017;63:12–19. [DOI] [PMC free article] [PubMed] [Google Scholar]
- 53. Zhang F, Song J, Zhang H et al. Wnt and BMP signaling crosstalk in regulating dental stem cells: implications in dental tissue engineering. Genes Dis. 2016;3:263–276. [DOI] [PMC free article] [PubMed] [Google Scholar]
- 54. Liang L, Zhou W, Yang N et al. 2016;2016:8467849 ID 8467849. 10.1155/2016/8467849 [DOI] [PMC free article] [PubMed] [Google Scholar] [Retracted]
- 55. Qin Z, Fang Z, Zhao L, Chen J, Li Y, Liu G. High dose of TNF‐α suppressed osteogenic differentiation of human dental pulp stem cells by activating the Wnt/β‐catenin signaling. J Mol Histol. 2015;46:409–420. [DOI] [PubMed] [Google Scholar]
- 56. Chang J, Liu F, Lee M et al. NF‐κB inhibits osteogenic differentiation of mesenchymal stem cells by promoting β‐catenin degradation. Proc Natl Acad Sci USA. 2013;110:9469–9474. [DOI] [PMC free article] [PubMed] [Google Scholar]
- 57. Burger MG, Steinitz A, Geurts J, et al. Ascorbic acid attenuates senescence of human osteoarthritic osteoblasts. Int J Mol Sci. 2017;18 pii: E2517. doi: 10.3390/ijms18122517 [DOI] [PMC free article] [PubMed] [Google Scholar]
- 58. Tian Y, Xu Y, Xue T et al. Notch activation enhances mesenchymal stem cell sheet osteogenic potential by inhibition of cellular senescence. Cell Death Dis. 2017;8:e2595 10.1038/cddis.2017.2 [DOI] [PMC free article] [PubMed] [Google Scholar]
- 59. Hu H, Sun J, Wang C et al. IL‐33 facilitates endocrine resistance of breast cancer by inducing cancer stem cell properties. Biochem Biophys Res Commun. 2017;485:643–650. 10.1016/j.bbrc.2017.02.080 [DOI] [PubMed] [Google Scholar]
- 60. Akimoto M, Maruyama R, Takamaru H, Ochiya T, Takenaga K. Soluble IL‐33 receptor sST2 inhibits colorectal cancer malignant growth by modifying the tumour microenvironment. Nat Commun. 2016;7:13589 10.1038/ncomms13589 [DOI] [PMC free article] [PubMed] [Google Scholar]
- 61. Nagoshi N, Shibata S, Kubota Y et al. Ontogeny and multipotency of neural crest‐derived stem cells in mouse bone marrow, dorsal root ganglia, and whisker pad. Cell Stem Cell. 2008;2:392–403. 10.1016/j.stem.2008.03.005 [DOI] [PubMed] [Google Scholar]
- 62. Takashima Y, Era T, Nakao K et al. Neuroepithelial cells supply an initial transient wave of MSC differentiation. Cell. 2007;129:1377–1388. [DOI] [PubMed] [Google Scholar]
- 63. Trivanović D, Jauković A, Popović B et al. Mesenchymal stem cells of different origin: comparative evaluation of proliferative capacity, telomere length and pluripotency marker expression. Life Sci. 2015;141:61–73. [DOI] [PubMed] [Google Scholar]
- 64. Liu L, Wu L, Wei X, Ling J. Induced overexpression of Oct4A in human dental pulp cells enhances pluripotency and multilineage differentiation capability. Stem Cells Dev. 2015;24:962–972. [DOI] [PubMed] [Google Scholar]
- 65. Liu P, Cai J, Dong D, et al. Effects of SOX2 on proliferation, migration and adhesion of human dental pulp stem cells. PLoS One. 2015;10:e0141346. eCollection 2015. [DOI] [PMC free article] [PubMed] [Google Scholar]
- 66. Huang CE, Hu FW, Yu CH et al. Concurrent expression of Oct4 and Nanog maintains mesenchymal stem‐like property of human dental pulp cells. Int J Mol Sci. 2014;15:18623–18639. [DOI] [PMC free article] [PubMed] [Google Scholar]
- 67. Liu TM, Wu YN, Guo XM, Hui JH, Lee EH, Lim B. Effects of ectopic Nanog and Oct4 overexpression on mesenchymal stem cells. Stem Cells Dev. 2009;18:1013–1022. [DOI] [PMC free article] [PubMed] [Google Scholar]
- 68. Wu G, Schöler HR. Role of Oct4 in the early embryo development. Cell Regen (Lond). 2014;3:7. eCollection 2014. [DOI] [PMC free article] [PubMed] [Google Scholar]
- 69. Warthemann R, Eildermann K, Debowski K, Behr R. False‐positive antibody signals for the pluripotency factor OCT4A (POU5F1) in testis‐derived cells may lead to erroneous data and misinterpretations. Mol Hum Reprod. 2012;18:605–612. [DOI] [PMC free article] [PubMed] [Google Scholar]
- 70. Cortes‐Dericks L, Yazd EF, Mowla SJ, Schmid RA, Karoubi G. Suppression of OCT4B enhances sensitivity of lung adenocarcinoma A549 cells to cisplatin via increased apoptosis. Anticancer Res. 2013;33:5365–5373. [PubMed] [Google Scholar]
- 71. Meng L, Hu H, Zhi H et al. OCT4B regulates p53 and p16 pathway genes to prevent apoptosis of breast cancer cells. Oncol Lett. 2018;16:522–528. 10.3892/ol.2018.8607 [DOI] [PMC free article] [PubMed] [Google Scholar]
- 72. Liu L, Huang R, Yang R, Wei X. OCT4B1 regulates the cellular stress response of human dental pulp cells with inflammation. Biomed Res Int. 2017;2017:1–10. ID:2756891. [DOI] [PMC free article] [PubMed] [Google Scholar]
- 73. Takase O, Yoshikawa M, Idei M et al. The role of NF‐κB signaling in the maintenance of pluripotency of human induced pluripotent stem cells. PLoS One. 2013;8:e56399. [DOI] [PMC free article] [PubMed] [Google Scholar]
- 74. Raggioli A, Junghans D, Rudloff S, Kemler R. Beta‐catenin is vital for the integrity of mouse embryonic stem cells. PLoS One. 2014;9:e86691. eCollection 2014. [DOI] [PMC free article] [PubMed] [Google Scholar]
- 75. Hoffman MD, Benoit DS. Agonism of Wnt‐β‐catenin signalling promotes mesenchymal stem cell (MSC) expansion. J Tissue Eng Regen Med. 2015;9:E13–E26. [DOI] [PMC free article] [PubMed] [Google Scholar]
- 76. Seo E, Basu‐Roy U, Zavadil J, Basilico C, Mansukhani A. Distinct functions of Sox2 control self‐renewal and differentiation in the osteoblast lineage. Mol Cell Biol. 2011;31:4593–4608. [DOI] [PMC free article] [PubMed] [Google Scholar]
Associated Data
This section collects any data citations, data availability statements, or supplementary materials included in this article.
Supplementary Materials