FIGURE 2.

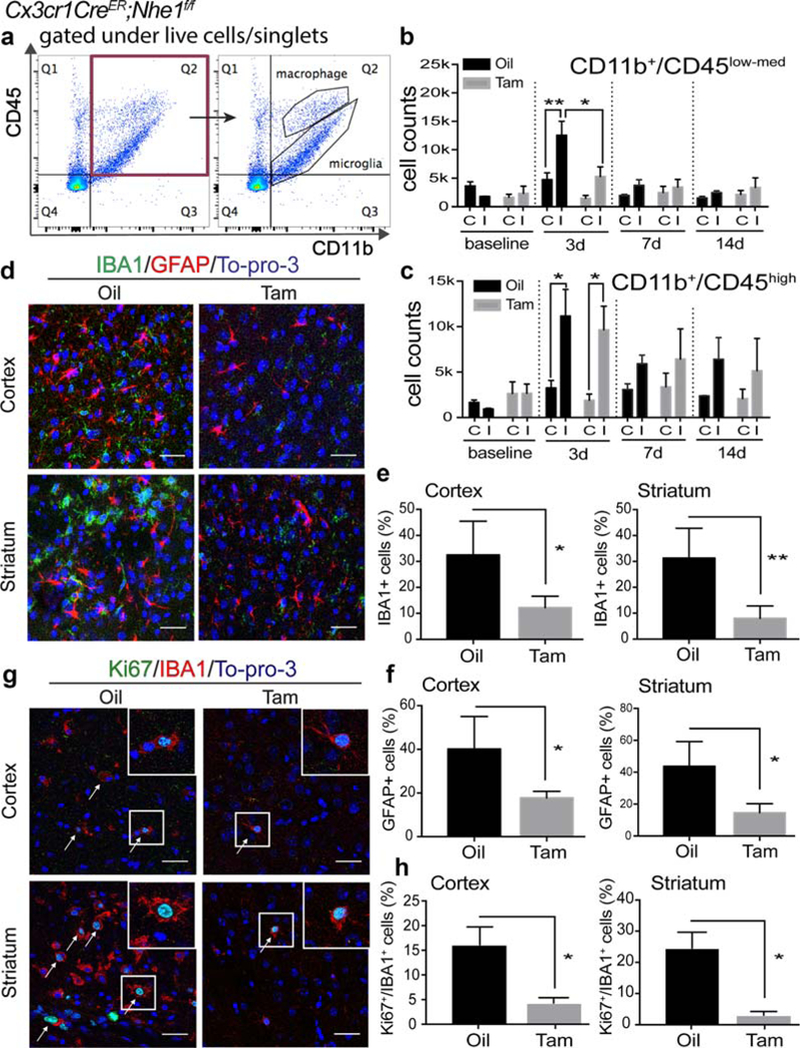
Tam-treated Cx3cr1-CreER;Nhe1f/f mice showed decreased number of microglia with less proliferation and reduced reactive astrocytes at the acute phase post-stroke. (a) Representative gating strategies of CD11b+/CD45low-med microglia and CD11b+/CD45hi macrophage populations. X-axis: number of CD11b+ cells. Y-axis: number of CD45+ cells. (b–c) Cell counts of CD11b+/CD45low-med microglia and CD11b+/CD45hi macrophages in the oil- and Tam-treated Cx3cr1-CreER;Nhe1f/f brains prior to tMCAO and at 3, 7, and 14 days Rp. A total cell count of 50,000 was recorded and analyzed. C, contralateral hemisphere; I, ipsilateral hemisphere. Data are mean ± SEM. At 0 day (baseline), 7 days and 14 days: N = 3; at 3 days: N = 9. *p < .05, **p < .01. (d) Representative immunofluorescent images of IBA1, GFAP, and To-pro-3 staining in the IL peri-lesion areas in the oil- and Tam-treated Cx3cr1-CreER;Nhe1f/f mice at 3 days post-tMCAO. (e) Quantitative analysis of IBA11 microglia in the IL peri-lesion areas in the cortex and striatum of the oil- and Tam-treated Cx3cr1-CreER;Nhe1f/f mice at 3 days post-tMCAO. Data are mean ± SEM. N = 4. *p < .05, **p < .01 oil- versus Tam-treated groups. (f) Quantitative analysis of GFAP1 astrocytes in the IL peri-lesion areas in the cortex and striatum of the oil- and Tam-treated Cx3cr1-CreER;Nhe1f/f mice at 3 days post-tMCAO. Data are mean ± SEM. N = 4. *p < .05, oil- versus Tam-treated groups. (g) Representative immunofluorescent images illustrate stroke-induced elevation of Ki67+/IBA1+ microglial cells in the IL hemispheres in the oi- but not in the Tam-treated Cx3cr1-CreER;Nhe1f/f mice at day 3 post-tMCAO. (h) Quantitative analysis of Ki67+/IBA1+ proliferative microglia populations. Data are mean ± SEM. N = 3. *p < .05, oil- versus Tam-treated groups [Color figure can be viewed at wileyonlinelibrary.com]
