

Abstract
Background
Early detection of decreased glomerular filtration rate (GFR) in dogs is challenging. Current methods are insensitive and new biomarkers are required.
Objective
To compare overall diagnostic performance of serum symmetric dimethylarginine (SDMA) and serum cystatin C to serum creatinine, for detection of decreased GFR in clinically stable dogs, with or without chronic kidney disease (CKD).
Animals
Ninety‐seven client‐owned dogs: 67 dogs with a diagnosis or suspicion of CKD and 30 healthy dogs were prospectively included.
Methods
Prospective diagnostic accuracy study. All dogs underwent physical examination, systemic arterial blood pressure measurement, urinalysis, hematology and blood biochemistry analysis, cardiac and urinary ultrasound examinations, and scintigraphy for estimation of glomerular filtration rate (mGFR). Frozen serum was used for batch analysis of SDMA and cystatin C.
Results
The area under the curve of creatinine, SDMA, and cystatin C for detection of an mGFR <30.8 mL/min/L was 0.98 (95% confidence interval [CI], 0.93‐1.0), 0.96 (95% CI, 0.91‐0.99), and 0.87 (95% CI, 0.79‐0.93), respectively. The sensitivity of both creatinine and SDMA at their prespecified cutoffs (115 μmol/L [1.3 mg/dL] and 14 μg/dL) for detection of an abnormal mGFR was 90%. The specificity was 90% for creatinine and 87% for SDMA. When adjusting the cutoff for cystatin C to correspond to a diagnostic sensitivity of 90% (0.49 mg/L), specificity was lower (72%) than that of creatinine and SDMA.
Conclusions and Clinical Importance
Overall diagnostic performance of creatinine and SDMA for detection of decreased mGFR was similar. Overall diagnostic performance of cystatin C was inferior to both creatinine and SDMA.
Keywords: azotemia, biomarker, canine, CKD, renal
Abbreviations
- ACE
angiotensin converting enzyme
- AUC
area under the curve
- BW
body weight
- Ca
total calcium
- CKD
chronic kidney disease
- eGFR
estimated glomerular filtration rate
- IQR
interquartile range
- IRIS
International Renal Interest Society
- K
potassium
- kDa
kilodalton
- LR−
negative likelihood ratio
- LR+
positive likelihood ratio
- mGFR
measured glomerular filtration rate with scintigraphy
- Na
sodium
- P
inorganic phosphate
- PBA
phosphate binding agent
- PETIA
particle‐enhanced immunoturbidimetric assay
- ROC
receiver operator characteristic
- SBP
systolic blood pressure
- SDMA
symmetric dimethylarginine
- UPC
urine protein to creatinine ratio
- USG
urine specific gravity
1. INTRODUCTION
A clinical diagnosis of chronic kidney disease (CKD) in dogs can be established on the basis of structural damage to the kidneys, or decreased renal function, or both. Although the kidneys are important for many aspects of homeostasis, the glomerular filtration rate (GFR) often is used as an indicator of global renal function.1 An early diagnosis of progressive CKD provides an opportunity to apply renoprotective measures that might benefit affected dogs.2 In clinically and hemodynamically stable dogs, a decrease in GFR is most likely a consequence of CKD. Calculation of GFR in dogs requires multiple blood samplings (plasma clearance methods) or special equipment and expertise (scintigraphy). Glomerular filtration rate therefore most often is estimated indirectly using circulating biomarkers, such as creatinine.1, 3 The use of serum creatinine concentration compared to a broad population‐based reference interval is suboptimal, but robust alternatives are lacking.1 The absence of an accurate, simple, and minimally invasive marker of GFR is a limiting factor in clinical nephrology research and clinical practice, and new, more precise, alternatives are continuously sought.
Symmetric dimethylarginine (SDMA) is an amino acid released from cells during protein degradation, which was first isolated in human urine in 1970.4 Clearance of SDMA is mainly accomplished by glomerular filtration.5 A meta‐analysis of 18 diagnostic studies showed a strong correlation between SDMA and different markers of renal function in people.6 Commercially available SDMA assays for use in dogs recently were introduced, and serum SDMA has since been increasingly used as an indirect marker of GFR. Unfortunately, the 2 published diagnostic studies do not present data that can be used to determine diagnostic performance of SDMA as a marker of GFR in dogs.7, 8 Regardless, SDMA is thought to represent, and is advertised as, a sensitive indicator of decreased GFR in dogs.9
Cystatin C, a low‐molecular‐weight (13 kDa) cysteine protease, is produced at a stable rate by all nucleated cells and cleared by glomerular filtration.10, 11 This protein was first proposed as an endogenous circulating indirect marker of GFR in people in 1985,12, 13 and is now routinely used in equations for calculation of estimated GFR (eGFR) either alone or together with creatinine.14, 15 In people, addition of cystatin C to creatinine‐based eGFR equations improves accuracy of estimates.16, 17 In dogs, cystatin C has been evaluated as a GFR marker using different analytical methods and study designs, and is considered potentially useful.18, 19, 20, 21, 22, 23, 24, 25 More work is needed to confirm the diagnostic value of cystatin C as a marker of decreased GFR in dogs.26
Our aim was to compare the overall diagnostic performance of serum SDMA and serum cystatin C to serum creatinine for detection of decreased GFR in clinically stable dogs with a diagnosis or strong suspicion of CKD. Our hypothesis was that overall diagnostic performance would be similar for all 3 markers. A secondary aim was to evaluate if combining either SDMA, cystatin C, or both, with creatinine increases sensitivity or specificity or both for detection of decreased GFR, compared to creatinine alone.
2. MATERIAL AND METHODS
2.1. Study design and study population
This prospective diagnostic accuracy study was performed at the Swedish University of Agricultural Sciences, Uppsala. All owners approved and signed an informed consent form. Client‐owned dogs of any breed and age with a previous CKD diagnosis, or for which the attending clinician had a suspicion of CKD, were included. Participating dogs were referred, or presented as primary patients, to the University Animal Hospital (2012‐2016). The diagnosis of CKD, defined as structural or functional abnormalities of 1 or both kidneys that had persisted for at least 3 months, had been made previously in many dogs, using standard methods (compatible clinical signs, results of urinalysis, hematological and biochemical analyses, morphological renal abnormalities detected by urinary tract ultrasound examination, or some combination of these). Exclusion criteria were presence of other systemic or organ‐related diseases or chronically administered medications (except PO glucosaminoglycan supplements, sodium pentosane polysulfate injections, angiotensin converting enzyme [ACE] inhibitors or phosphate binding agents [PBAs]). If the dog was receiving an ACE inhibitor or PBA, the drug was withdrawn 1 week before inclusion, and reintroduced after study participation. Renal diets were allowed. Healthy student, client, and staff‐owned dogs of any breed and age also were prospectively included. Inclusion of dogs was performed at preplanned hospital visits, designated for study inclusion only, to ensure clinical stability. At the day of enrollment into the study, dogs underwent physical examination, repeated blood pressure measurements, collection of venous blood and urine, echocardiographic examination, abdominal ultrasound examination of the entire urinary tract, and a scintigraphic examination for calculation of individual kidney mGFR. Dogs with CKD were classified according to International Renal Interest Society (IRIS) classification system into stage 1 through 4, based on stable serum creatinine concentration.
2.2. Systemic arterial blood pressure measurement
Indirect blood pressure measurements were performed by oscillometry (High Definition Oscillometry, S+B medVET, Germany; iE33, Philips Ultrasound, Bothell, Washington) after rest and accommodation to the premises. The cuff was put on the base of the tail and pressure was recorded with the dog standing, either on the floor or on the examination table, depending on where the dog seemed to be most comfortable. A minimum of 5 measurements were recorded for each dog, more in case of presumably incorrect measurements (such as a presumably incorrect heart rate registration on the device, a >20% variation in systolic blood pressure [SBP] among measurements, or an obviously distressed animal).
2.3. Abdominal ultrasound and echocardiography
Complete upper and lower urinary tract ultrasound examinations were conducted by experienced diagnostic imagers at the University Animal Hospital diagnostic imaging clinic. Dogs were non‐sedated and examined in dorsal recumbency during the procedure, which was performed according to a predefined protocol. Echocardiographic examinations of all dogs were performed by experienced ultrasonographers to exclude primary heart disease because such disease might affect renal function and extracellular fluid volume.
2.4. Blood and urine examinations
Blood was drawn from the cephalic vein into tubes without anticoagulant and tubes containing EDTA. Samples were transferred to the clinical chemistry laboratory at the University Animal Hospital for immediate hematological (CBC including manual differential cell count) and biochemical analysis (urea, creatinine, alkaline phosphatase, alanine aminotransferase, total calcium [Ca], inorganic phosphate [P], sodium [Na], potassium [K], chloride, cholesterol, C‐reactive protein, total protein, albumin, and fibrinogen). After analyses, serum and EDTA plasma were frozen (−20°) in aliquots and subsequently (within 24 hours) transferred to storage at −70°. For most dogs, urine was obtained by cystocentesis at the time of the abdominal ultrasound examination. If cystocentesis was not possible, fresh spontaneously voided urine was collected. Urine was aliquoted, and 5‐10 mL (depending on the total volume of urine obtained) was immediately used for analysis (dipstick and sediment examinations, specific gravity [USG], urine protein‐to‐creatinine ratio [UPC], and aerobic culture).
2.5. Glomerular filtration rate and plasma volume estimation by scintigraphy
Estimation of individual kidney GFR was performed using renal scintigraphy (plasma volume method) according to hospital routine. The examinations were performed as previously described,27 by an experienced diagnostic imager, blinded to results of the index tests (creatinine, SDMA, and cystatin C). Results were normalized to an estimation of plasma volume.28 The predefined cutoff for a decreased total (left + right kidney) mGFR by plasma volume method in the University Animal Hospital was 30.8 mL/min/L.27, 28 A second, less conservative, cutoff for decreased mGFR was defined, based on the results of mGFR in the healthy dogs of the present study. This cutoff was set at a level that resulted in an mGFR within normal limits in approximately 95% of healthy dogs.
2.6. Biomarker analysis
Serum creatinine concentration was determined using an enzymatic method (Architect c4000, Abbott, Abbott Park, Illinois). The predefined reference interval was 46‐115 μmol/L (0.5‐1.3 mg/dL).
Frozen (−70°) serum was sent to Idexx Laboratories GmbH, Ludwigsburg, Germany, and analyzed in batch with a commercially available method for quantification of SDMA, in 2017 (IDEXX SDMA Test, Idexx Laboratories GmbH). The predefined reference interval was 0‐14 μg/dL.
Frozen (−70°C) serum was transported to the Department of Clinical Chemistry, University Hospital, Uppsala, Sweden, and analyzed in batch in 2017. Cystatin C measurement was performed using a particle‐enhanced immunoturbidimetric assay (PETIA, [Gentian, Moss, Norway], on Architect c8200 [Abbott, Abbott Park, Illinois]), previously validated for use in dogs.24
Laboratory staffs at each site were blinded to results of all other variables.
2.7. Statistical analyses
Statistical calculations were performed using commercially available software programs (JMP Pro 11, SAS Institute, Cary, North Carolina) (MedCalc Version 17.9.7 64‐bit). A P‐value of <.05 was considered significant. Medians and interquartile ranges (IQRs) were used to describe distribution of continuous variables. Data were assessed graphically for normality, and non‐normally distributed variables were log‐transformed. In the statistical analyses of the present study, results from the plasma volume method were used as a reference because this method is thought to be less dependent on hydration status of the dog.27, 28, 29, 30 Spearman's correlation between integral and plasma volume methods of GFR estimation (r) was 0.8. Univariate linear regression (continuous variables) and Wilcoxon rank sum test (categorical variables) were performed to assess associations among creatinine, SDMA, and cystatin C, respectively, and the following variables: age, body weight (BW), sex, mGFR, PCV, SBP, P, Ca, albumin, Na, K, USG, and storage time. Multiple regression analyses were performed in a backward stepwise manner. All variables that were linearly correlated with creatinine, SDMA, or cystatin C, respectively, with a P value <.2, were included. Thereafter, the variable with the highest P value was removed in each step until all remaining variables were significant. For regression analyses, residuals were plotted and visually inspected.
Receiver operating characteristic (ROC) curve analysis was performed at the 2 different cutoffs for mGFR (<30.8 and <37 mL/min/L, respectively) in order to evaluate overall diagnostic performance of all 3 biomarkers at 2 different levels of GFR impairment.
Sensitivity, specificity and positive and negative likelihood ratios (LRs) were calculated for each biomarker at their prespecified clinically used cutoffs, and if necessary, specificity recalculated with cut points that achieved the same sensitivity for each of the diagnostic tests. For cystatin C, the cutoff that corresponded to the same sensitivity as that of creatinine and SDMA was chosen for these calculations, because the use of the “optimal” cutoff value for cystatin C identified in the present study possibly could inflate diagnostic accuracy results. Interval LRs were constructed by examining ROC tables and choosing relevant cutoffs in an attempt to maximize the clinical utility of results.
The diagnostic efficacy of the model obtained from the multiple regression analysis to predict the presence of decreased mGFR was further evaluated by the use of ROC curves at the 2 different cutoffs for mGFR. The ROC curves were evaluated using area under the curve (AUC) and calculating 95% confidence interval (CI), and differences were tested using the method by Hanley and McNeil.
Recursive partitioning was used to create decision trees for optimal clinical use of recorded variables in order to evaluate GFR.
Usefulness of cystatin C and SDMA for improvement of diagnostic performance in a selected population (dogs that were falsely categorized regarding mGFR, positively or negatively, by creatinine) was assessed by evaluating results of the SDMA and cystatin C analysis for each individual dog. The usefulness of creatinine and cystatin C as adjuncts to SDMA similarly was assessed.
The Wilcoxon rank sum test was used to compare results of mGFR, SDMA, and cystatin C among the following subgroups: healthy dogs and dogs in IRIS stages 1, 2, and 3 CKD. Dogs in group 4 were excluded from these analyses because too few were available. In these analyses, Bonferroni correction was applied and P < .01 was considered significant.
3. RESULTS
3.1. Study population
A total of 105 dogs were enrolled in the study, but only 97 dogs had all requisite data and were included in the analysis. Reasons for excluding the remaining 8 dogs are given in Figure 1. No adverse events were recorded during collection of study data. The study population comprised 12 mixed breed dogs, 6 Labradors, 6 Golden Retrievers, 5 Boxers, 4 Border Collies, and ≤3 individuals of 51 other breeds. Of these dogs, 30 were healthy. Fourteen dogs were not conclusively diagnosed with CKD, because of absence of confirmed structural or functional renal abnormalities. Median (IQR) age of all included dogs was 5.2 (2.5‐8.7) years, median BW 20.0 (IQR, 11.5‐27.3) kg, and median mGFR 43 (IQR, 25‐51) mL/min/L. Urine was obtained by cystocentesis in 90 dogs and by spontaneous voiding in 7 dogs. Clinical and laboratory characteristics of included dogs are presented in Table 1. Creatinine, SDMA, and cystatin C all were nonlinearly negatively associated with mGFR (Figure 2A‐C). The additional more conservative mGFR cutoff was set to <37 mL/min/L.
Figure 1.
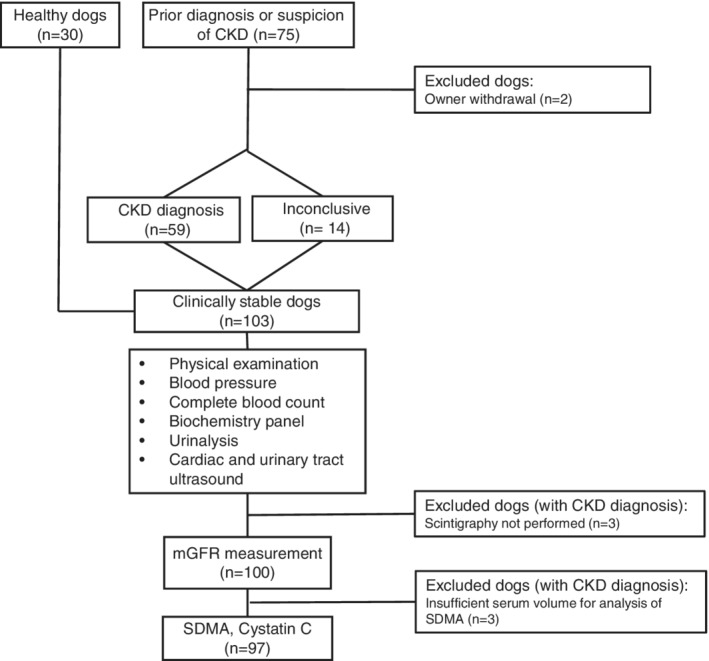
Flowchart of the study including reasons for exclusion of 8 dogs. CKD, chronic kidney disease; mGFR, measured glomerular filtration rate; SDMA, symmetric dimethylarginine
Table 1.
Dog characteristics and clinical variables
| Healthy (n = 30) | Inconclusive (n = 14) | CKD stage 1 (n = 26) | CKD stage 2 (n = 12) | CKD stage 3 (n = 12) | CKD stage 4 (n = 3) | |
|---|---|---|---|---|---|---|
| Creatinine (μmol/L) | 83 (75‐98) | 87 (71‐106) | 85 (75‐104) | 145 (137‐171) | 217 (187‐281) | 573 |
| Creatinine (mg/dL) | 0.9 (0.8‐1.1) | 1.0 (0.8‐1.2) | 1.0 (0.8‐1.2) | 1.6 (1.5‐1.9) | 2.4 (2.1‐3.2) | 6.5 |
| Age (y) | 4.9 (3.0‐7.8) | 3.4 (2.4‐7.0) | 5.1 (1.7‐7.6) | 3.5 (1.2‐11) | 6.9 (4.0‐10.5) | 10.8 |
| BW (kg) | 20 (16‐25) | 22 (14‐34) | 18 (8.6‐28) | 19 (9‐25) | 18 (8‐29) | 45 |
| mGFR (mL/min/L) | 51 (47‐61) | 46 (40‐56) | 47 (36‐50) | 21 (15‐26) | 13 (6‐17) | 5 |
| SDMA (μg/dL) | 11 (9‐12) | 12 (9‐14) | 13 (11‐14) | 21 (17‐28) | 28 (27‐33) | 55 |
| Cystatin (mg/L) | 0.31 (0.26‐0.41) | 0.48 (0.37‐0.62) | 0.42 (0.37‐0.64) | 0.57 (0.49‐0.85) | 1.38 (0.97‐2.56) | 3.69 |
| SBP (mm Hg)a | 127 (114‐140) | 133 (124‐157) | 137 (125‐157) | 135 (121‐168) | 145 (130‐176) |
Values are given as median (interquartile range).
Abbreviations: BW, body weight; CKD, chronic kidney disease; inconclusive, dogs with a suspicion of CKD but no final diagnosis by CKD definition; mGFR, measured glomerular filtration rate; SDMA, symmetric dimethylarginine; stage, International Renal Interest Society stage of CKD.
Systolic blood pressure (SBP) was available for only 84 dogs, including 2 dogs in CKD stage 4. Therefore, no value is given for stage 4 dogs.
Figure 2.
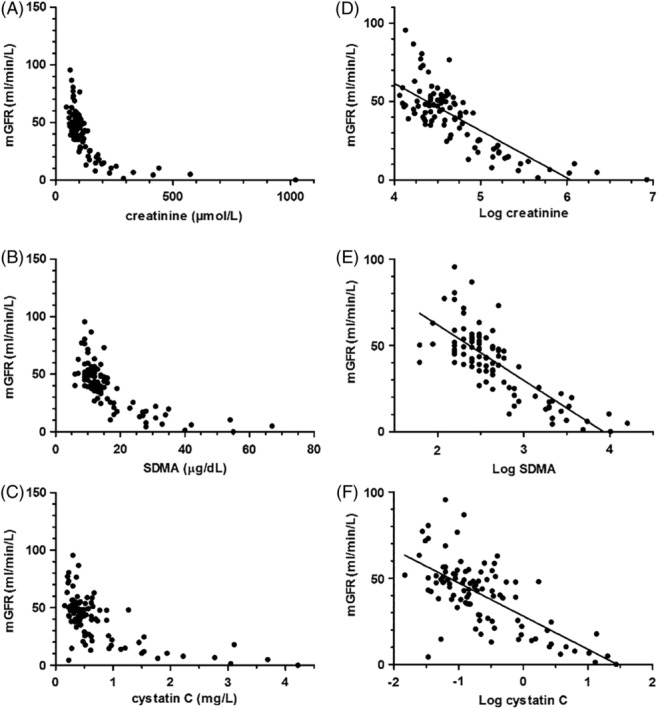
Original plots of A, creatinine; B, symmetric dimethylarginine (SDMA); and C, cystatin C versus measured glomerular filtration rate (mGFR) in 97 dogs. Linear associations between D, log creatinine; E, log SDMA; and F, log cystatin C and mGFR in 97 dogs
3.2. Comparison among subgroups
Results of mGFR, SDMA, and cystatin C were different between healthy dogs and dogs in IRIS stages 1, 2, and 3 (Figure 3A‐C).
Figure 3.
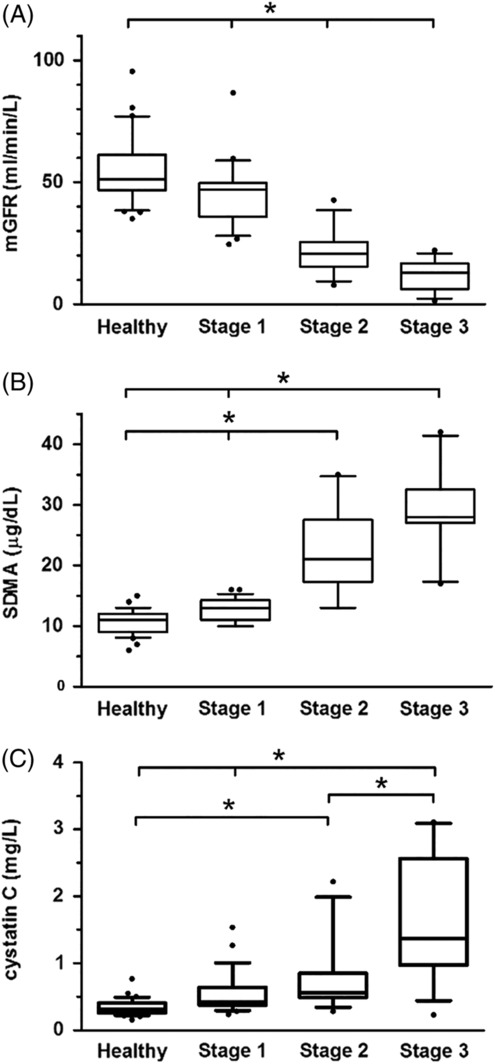
A, Measured glomerular filtration rate (GFR); B, symmetric dimethylarginine (SDMA); and C, cystatin C concentrations in 30 healthy dogs and 50 dogs with chronic kidney disease, in international renal interest society (IRIS) stages 1‐3. The top, bottom, and middle lines through each box correspond to the 75th percentile, the median, and the 25th percentile, respectively. The whiskers extend from the bottom 10th percentile to the top 90th percentile. Asterisks indicate significant differences in biomarker concentrations between groups (P < .01)
3.3. Univariate and multiple regression analyses
Serum creatinine concentration increased with decreasing mGFR (R 2 = 0.62; P < .001), PCV (R 2 = 0.48; P < .001), USG (R 2 = 0.14; P < .001) and albumin (R 2 = .06; P = .02) and with increasing P (R 2 = 0.24; P < .001), Ca (R 2 = 0.19; P < .001), K (R 2 = 0.10; P = .002), and age (R 2 = 0.62; P < .001) in the univariate analyses. The variables mGFR, age, BW, P, PCV, albumin, SBP, Ca, Na, K, and USG were included in the multiple regression analysis. Measured GFR, BW, PCV, and P were the variables independently associated with creatinine (R 2 adj = 0.74; P < .001).
Serum SDMA concentration increased with decreasing mGFR (R 2 = 0.62; P < .001), PCV (R 2 = 0.46; P < .001), USG (R 2 = 0.21; P < .001) and albumin (R 2 = 0.17; P < .001), and with increasing P (R 2 = 0.26; P < .001), Ca (R 2 = 0.13; P < .001), and K (R 2 = 0.11; P = .001) in the univariate analyses. The variables mGFR, age, P, PCV, albumin, SBP, Ca, K, USG, and storage time were included in the multiple regression analysis. Measured GFR, P, albumin, and USG were the variables independently associated with SDMA (R 2 adj = 0.71; P < .001).
Cystatin C concentration increased with decreasing mGFR (R 2 = 0.46; P < .001), PCV (R 2 = 0.38; P < .001), USG (R 2 = 0.23; P < .001) and albumin (R 2 = 0.06; P = .01), and with increasing age (R 2 = 0.16; P < .001), P (R 2 = 0.16; P < .001), Ca (R 2 = 0.16; P < .001), K (R 2 = 0.14; P = .002), and BP (R 2 = 0.10; P = .004) in the univariate analyses. The variables mGFR, age, P, PCV, albumin, SBP, Ca, K, and USG were included in the multiple regression analysis. Measured GFR, age, PCV, Ca, and USG were the variables independently associated with cystatin C (R 2 adj = 0.62; P < .001).
3.4. Overall diagnostic assessment
Log creatinine was linearly associated with mGFR (R 2 = 0.62, Figure 2C). The AUC of creatinine for detection of mGFR <30.8 mL/min/L was 0.98 (95% CI, 0.93‐1.0) and that for detection of mGFR <37 mL/min/L was 0.94 (95% CI, 0.87‐0.98; Figure 4).
Figure 4.
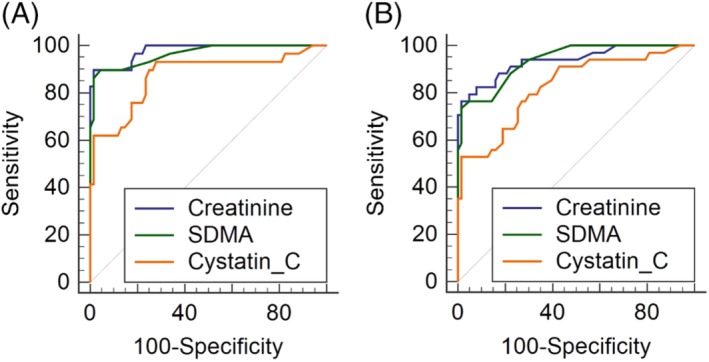
Receiver operator characteristic curve analysis. Comparison of overall diagnostic value of creatinine, symmetric dimethylarginine (SDMA), and cystatin C for detection of A, measured glomerular filtration rate (mGFR) <30.8 mL/min/L and B, mGFR <37 mL/min/L in 97 dogs. There was no difference between overall performance of creatinine and SDMA at either cutoff for mGFR (P = .37 and .70, respectively)
Log SDMA was linearly associated with mGFR (R 2 = 0.62, Figure 2D). The AUC of SDMA for detection of mGFR <30.8 mL/min/L was 0.96 (95% CI, 0.91‐0.99) and that for detection of an mGFR <37 mL/min/L was 0.94 (95% CI, 0.87‐0.98). No difference in overall diagnostic performance was detected between creatinine and SDMA at either cutoff of mGFR (Figure 4).
Log cystatin C was linearly associated with mGFR (R 2 = 0.46, Figure 2E). The AUC of cystatin C for detection of an mGFR <30.8 mL/min/L was 0.87 (95% CI, 0.79‐0.93) and that for detection of an mGFR <37 mL/min/L was 0.83 (95% CI, 0.74‐0.90). Cystatin C was significantly inferior to creatinine at both mGFR cutoffs but inferior to SDMA only at the higher cutoff (<37 mL/min/L, Figure 4).
The cutoffs identified in the ROC curve analysis as optimal (taking into account both sensitivity and specificity) in this population of dogs, to detect an mGFR <30.8 mL/min/L, were 126 μmol/L (1.4 mg/dL) for creatinine, 16 μg/dL for SDMA, and 0.47 mg/L for cystatin C.
3.5. Diagnostic performance of serum markers at prespecified and defined cutoffs
The sensitivity of creatinine and SDMA at their prespecified cutoffs (115 μmol/L [1.3 mg/dL] and 14 μg/dL, respectively) for detection of an abnormal (<30.8 mL/min/L) mGFR was the same (90%) in the dogs of the present study. The specificity was 90% for creatinine and 87% for SDMA. A “defined” cutoff for cystatin C that corresponded to the same level of sensitivity (90%) therefore was chosen (0.49 mg/L), which corresponded to a specificity of 75%. Sensitivity, specificity, positive and negative LRs for creatinine, SDMA, and cystatin C at their predefined/defined cutoffs for detection of decreased (<30.8 mL/min/L) mGFR are presented in Table 2. Interval LRs for all 3 markers are presented in Table 3.
Table 2.
Sensitivity, specificity, and likelihood ratios at prespecified single cutoffs
| Biomarker | Predefined cutoff value | Sensitivity (%) | Specificity (%) | LR+ | LR− |
|---|---|---|---|---|---|
| Creatinine | 115 μmol/L(1.3 mg/dL) | 90 (73‐98) | 90 (80‐96) | 8.7 (4.3‐17.8) | 0.12 (0.04‐0.34) |
| SDMA | 14 μg/dL | 90 (73‐98) | 87 (76‐94) | 6.8 (3.6‐12.6) | 0.12 (0.04‐0.35) |
| Cystatin C | 0.49a mg/L | 90 (73‐98) | 74 (61‐83) | 3.4 (2.2‐5.1) | 0.14 (0.05‐0.41) |
Values are given with 95% confidence interval (CI) in brackets.
Abbreviations: LR−, negative likelihood ratio; LR+, positive likelihood ratio; SDMA, symmetric dimethylarginine.
Defined cutoff value, that is, the cutoff for cystatin C that corresponded to the same sensitivity (90%) as that of creatinine and SDMA in the present study.
Table 3.
Proposed interval likelihood ratios (for detection of mGFR <30.8 mL/min/L)
| Biomarker | Serum concentration | mGFR decreased (number of dogs) | mGFR normal (number of dogs) | Interval likelihood ratios |
|---|---|---|---|---|
| Creatinine μmol/L (mg/dL) | >127 (1.4) | 26 | 1 | 61 |
| 101‐127 (1.1‐1.4) | 2 | 14 | 0.33 | |
| ≤100 (<1.1) | 1 | 53 | 0.04 | |
| SDMA μg/dL | >16 | 25 | 1 | 61 |
| 14‐16 | 1 | 8 | 0.29 | |
| ≤13 | 3 | 59 | 0.05 | |
| Cystatin C mg/L | >0.91 | 18 | 1 | 42 |
| 0.47‐0.91 | 9 | 18 | 1.1 | |
| ≤0.46 | 2 | 49 | 0.14 |
Abbreviations: mGFR, measured glomerular filtration rate; SDMA, symmetric dimethylarginine.
3.6. Usefulness of SDMA and cystatin C as adjunct tests to creatinine
The combination of creatinine and SDMA for detection of decreased mGFR in a multiple regression model resulted in an adjusted R 2 of 0.67 and an AUC of 0.98. For the combination of creatinine and cystatin C, adjusted R 2 was 0.65 and the AUC was 0.99. When creatinine, SDMA, and cystatin C all were used to construct a model, adjusted R 2 was 0.68 and AUC was 0.99.
The resultant decision tree when every clinical variable was used in the partition model to predict if mGFR was abnormal (<30.8 mL/min/L) or not included creatinine and cystatin C only. The resultant decision tree was identical when only creatinine, SDMA, and cystatin C initially were entered into the model (Figure 5).
Figure 5.
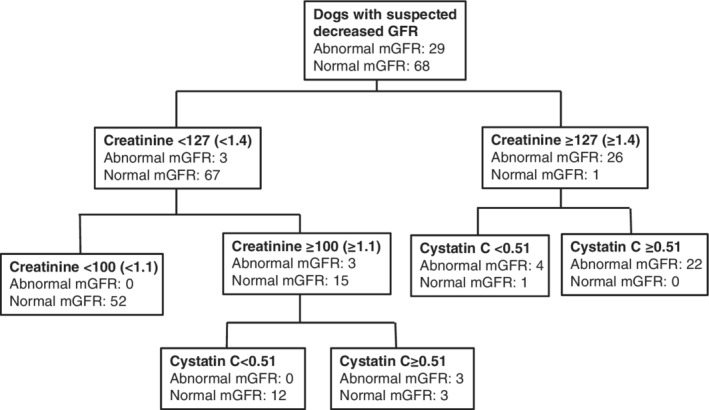
Partition modelling. Resultant decision tree when every clinical variable was entered into the model to predict if mGFR was abnormal (< 30.8 mL/min/L) or not. An identical decision tree resulted if only creatinine, SDMA and cystatin C were entered into the model. Cystatin C units: mg/L. Creatinine units: μmol/L. The equivalent of 127 μmol/L is 1.4 mg/dL and the equivalent of 100 μmol/L is 1.1 mg/dL
Ten (10%) dogs were falsely categorized by creatinine at its prespecified cutoff with regard to mGFR (<30.8 mL/min/L) status. Seven results were falsely positive (serum creatinine concentration ranging from 117 to 136 μmol/L [1.3‐1.5 mg/dL]) and 3 were falsely negative (serum creatinine concentration ranging from 100 to 105 μmol/L [1.1‐1.2 mg/dL]). Seven of these 10 dogs were correctly classified by SDMA at its prespecified cutoff. Eight of them were correctly classified by cystatin C at its “defined” cutoff of 0.49 mg/L.
Twelve (12%) dogs were falsely categorized by SDMA at its prespecified cutoff with regard to mGFR (<30.8 mL/min/L) status. Nine results were falsely positive (serum SDMA concentration ranging from 15 to 19 μg/dL) and 3 were falsely negative (serum SDMA concentration ranging from 12 to 14 μg/dL). Nine of these dogs were correctly classified by creatinine at its prespecified cutoff. Eight of them were correctly classified by cystatin C at its “defined” cutoff of 0.49 mg/L.
4. DISCUSSION
In this diagnostic accuracy study, overall performance of creatinine and SDMA as markers of decreased mGFR was the same. Performance of cystatin C on the other hand was inferior to both creatinine and SDMA. In the subpopulation of dogs for which creatinine (at its predefined cutoff) was falsely positive or negative, both SDMA and cystatin C appeared to be of value as adjunct markers for interpretation of mGFR status. Similarly, for the subpopulation of dogs for which SDMA (at its predefined cutoff) was falsely positive or negative, creatinine and cystatin C both were considered valuable adjunct markers for mGFR interpretation.
Overall diagnostic performance (AUC) of SDMA as a marker of decreased mGFR was the same as that of creatinine in our study. Symmetric dimethylarginine currently is marketed as a more sensitive marker of decreased GFR than creatinine. Consequently, and because of current uncertainty regarding what exactly constitutes a decreased GFR, we chose to evaluate overall diagnostic performance of creatinine, SDMA and cystatin C at 2 different mGFR cutoffs. As expected, overall diagnostic performance of all 3 markers was lower at the higher mGFR cutoff, but again, the performances of creatinine and SDMA were not different from each other. Our conclusion is that creatinine and SDMA have similar overall diagnostic value for detection of decreased GFR. The exact sensitivity and specificity of these continuous biomarkers depend on which cutoff is chosen.
In our study, the single cutoff for an optimal combination of sensitivity and specificity of SDMA for detection of a decreased mGFR was 16 μg/dL. If a higher sensitivity is preferred, the cutoff of 14 μg/dL could be maintained, but would result in a higher number of false positives compared to a cutoff of 16 μg/dL. We propose the use of interval LRs when interpreting results of this SDMA test (Table 3). These interval LRs were not validated in a separate cohort of dogs, which should be performed in future studies. Likelihood ratios are factors used to modify the pretest probability of disease, preferably with the use of a Fagan nomogram.31 An LR >10 or <0.1 provides information that modifies the pretest probability in a highly useful way.32
Overall diagnostic performance of cystatin C, when measured using a PETIA, was inferior to both creatinine and SDMA. Cystatin C however was considered useful for clinical GFR estimation based on results from the partition model (decision tree) and when evaluations of assay results in individual dogs were reviewed. Therefore, this assay, when used as an adjunct test to creatinine and interpreted using the decision tree or the interval LRs proposed here, might prove to be clinically useful. Additional studies however are needed to validate these interval LRs as well as the decision tree, and to further evaluate cystatin C as a marker of decreased GFR in clinical situations.
The cutoff for creatinine of 115 μmol/L (1.3 mg/dL), which is used clinically at our hospital for detection of decreased GFR, resulted in the same sensitivity and specificity as did the SDMA test in our population of dogs. If a high sensitivity for creatinine (or SDMA or any other continuous biomarker) is desired and the cutoff is lowered, the specificity invariably will decrease and, at some point, the test will no longer be clinically useful because of an unacceptably low specificity. According to our results (ROC analysis), the optimal single cutoff for creatinine in our dog population was 126 μmol/L (1.4 mg/dL). If a high sensitivity is desired and the cutoff is set at 115 μmol/L (1.3 mg/dL), some healthy large breed dogs will be categorized as azotemic. As an alternative, 2 different reference intervals, 1 for small and 1 for larger dogs, could be considered, although this also would not completely account for the influence of breed and muscle mass. A third option is to interpret serum creatinine concentration using interval LRs. In the present study, we suggest interval LRs that could be of use in serum creatinine concentration interpretation. Validation of these interval LRs should be carried out in future studies. The exact cutoffs for different intervals of LR also might differ among different creatinine assays.33 Either way creatinine is interpreted, the signalment of the dog must be taken into consideration in the diagnostic thought process.
Variables (other than mGFR) that were independently associated with the 3 biomarkers in the multiple regression analyses were those associated with renal function (PCV, Ca, P, albumin, and USG). The only 2 exceptions were the independent association between BW and creatinine, and that between age and cystatin C. This finding was expected because the dependence of serum creatinine concentration on muscle mass is known.34, 35, 36 Body weight in this population of dogs depends on breed as well. Some large breeds (such as the Greyhound, represented by 3 individuals in our study) have higher serum concentrations of creatinine than do dogs of other breeds, possibly despite higher GFR.37, 38, 39, 40 An age dependence of cystatin C also has been described previously in dogs.20, 24 Age has, however, not been considered to influence cystatin C concentrations in humans or cats.41, 42, 43, 44
Not all of the dogs that had a tentative diagnosis of CKD could be given a final CKD diagnosis based on GFR measurement. The reasons for including dogs in the study regardless of a diagnosis of CKD were 2‐fold. First, this group of dogs more closely represents the population in which these tests are performed clinically, namely dogs that are suspected of having decreased renal function, rather than dogs that already have been given a diagnosis of decreased renal function. Second, avoidance of a case‐control scenario in diagnostic accuracy studies decreases the risk of spectrum bias (exaggeration of diagnostic accuracy).45 As is the case for most continuous biomarkers, the diagnostic performance of a biomarker of decreased GFR is best in dogs with advanced disease, but the test becomes less efficient as GFR approaches normal. Therefore, inclusion of individuals with suspected minor decreases in GFR (such as the inconclusive dogs and many of the stage 1 CKD dogs in our study) is important in a diagnostic accuracy study evaluating performance of a biomarker of decreased GFR. Regardless of how GFR is estimated or calculated, it is necessary to clinically ascertain if decreased GFR is a consequence of prerenal, renal, or postrenal problems, and if it is acutely or chronically decreased. If GFR is chronically (>3 months) decreased because of a renal disorder, this finding represents 1 of several criteria on which to base a clinical diagnosis of CKD.46 However, a diagnosis of CKD also can be made on the basis of presence of structural abnormalities of 1 or both kidneys.46 In these cases, GFR sometimes is normal, and the disease might also be nonprogressive (ie, clinical signs may not ever develop). Thus, it is important to acknowledge that abnormal GFR and CKD are 2 separate, but often coexistent, entities.
4.1. Limitations
It is impossible to directly measure GFR, therefore it is instead estimated by use of filtration markers. Clearance, or in case of scintigraphy, renal uptake, of a marker is used to estimate GFR. There is a large variation in reported measurements of GFR in dogs.34, 47, 48, 49, 50, 51, 52, 53 Reference ranges differ with methodology and choice of normalization variable, but also among studies using similar methods. In a previous study using scintigraphy, most of the variability in GFR was a result of variation among dogs, less to day‐to‐day variability, and very little variation was due to the GFR estimation technique.28 Regardless, in our study the same methodology was used in all dogs, and therefore should have equal consequences for creatinine, SDMA, and cystatin C. Additionally, the cutoff for decreased GFR likely differs among subpopulations of dogs (eg, regarding age, breed, and BW).54 Although mGFR has been shown to decrease with increasing BW in healthy dogs,54 in our study, no significant effect of BW on mGFR was seen in the healthy, inconclusive or stage 1 dogs (data not shown). This finding might be due to the fact that all dogs but 2 in the previously mentioned groups weighed <40 kg. Hydration status also influences GFR measurements.55 The plasma volume method is less dependent on hydration status of the animal and therefore was chosen for statistical analyses.27, 29, 30, 56 Also, dogs were included at a time point when they were considered to be clinically stable, in order to further minimize any influence of hydration status.
The laboratory used for analysis of SDMA in our study recently changed the cutoff for SDMA to 16 μg/dL for dogs under the age of 12 months.9 This change in protocol was not accounted for in the statistical calculations. Two of the dogs <1 year of age (6 and 11 months old, respectively) with normal GFR in our study had serum SDMA concentrations of 15 μg/dL. However, 1 of these dogs was diagnosed with renal cysts and had low normal GFR (38 mL/min/L). Taking this change into account, the number of dogs falsely classified by SDMA decreased from 12 to 10, which is identical to the number of dogs falsely classified by creatinine. Furthermore, removing these 2 young dogs from the AUC calculations resulted in an AUC for SDMA of 0.97 instead of 0.96, which was not significantly different from the AUC of creatinine when the 2 dogs were removed (0.98).
Frozen (−70°C) samples obtained between 2012 and 2016 were sent for batch analysis of cystatin C and SDMA in early 2017. Concentrations of SDMA (analyzed by liquid chromatography‐mass spectrometry) have shown stability in samples stored for 7 and 14 days at 20° and 4°, respectively, and after 3 freeze‐thaw cycles.7 Stability of cystatin C concentrations in human serum measured by the assay used in our study was confirmed after storage up to 1 month at 2°C‐8°C.57 Stability of SDMA and cystatin C in canine serum stored at −70° for several years, however, has not been investigated. Storage time therefore was included as an explanatory variable in the univariate regression analyses. For SDMA, storage time subsequently also was included in the multiple regression analysis, but was not retained in the final model.
5. CONCLUSION
In our study, the overall diagnostic performance of creatinine and SDMA as markers of decreased mGFR in clinically stable dogs was found to be similar. Performance of cystatin C was inferior to that of creatinine and SDMA. However, use of either SDMA or cystatin C or both as adjuncts to creatinine may provide additional value for diagnosis of decreased GFR. This information may have an impact on the way dogs with suspected decreased GFR are investigated and managed.
CONFLICT OF INTEREST DECLARATION
Harriet Syme and Jonathan Elliott have acted as consultants for, and Jonathan Elliott is in receipt of research funding from, IDEXX Ltd.
OFF‐LABEL ANTIMICROBIAL DECLARATION
Authors declare no off‐label use of antimicrobials.
INSTITUTIONAL ANIMAL CARE AND USE COMMITTEE (IACUC) OR OTHER APPROVAL DECLARATION
Uppsala Ethics Committee approved this study.
HUMAN ETHICS APPROVAL DECLARATION
Authors declare human ethics approval was not needed for this study.
ACKNOWLEDGMENTS
The authors thank the Swedish research funds AGRIA/SKK research foundation, Michael Forsgren foundation, and Thure F and Karin Forsberg foundation for funding the present study. The authors also thank all owners of included dogs. Preliminary results of the present study were presented as an oral abstract at the 2017 ECVIM Congress in Malta.
Pelander L, Häggström J, Larsson A, et al. Comparison of the diagnostic value of symmetric dimethylarginine, cystatin C, and creatinine for detection of decreased glomerular filtration rate in dogs. J Vet Intern Med. 2019;33:630–639. 10.1111/jvim.15445
Funding information Agria/SKK Research Foundation; Michael Forsgren Foundation; Thure F och Karin Forsbergs Stiftelse
REFERENCES
- 1. Pressler BM. Clinical approach to advanced renal function testing in dogs and cats. Vet Clin North Am Small Anim Pract. 2013;43:1193‐1208. [DOI] [PubMed] [Google Scholar]
- 2. Jacob F, Polzin DJ, Osborne CA, et al. Clinical evaluation of dietary modification for treatment of spontaneous chronic renal failure in dogs. J Am Vet Med Assoc. 2002;220:1163‐1170. [DOI] [PubMed] [Google Scholar]
- 3. Von Hendy‐Willson VE, Pressler BM. An overview of glomerular filtration rate testing in dogs and cats. Vet J. 2011;188:156‐165. [DOI] [PMC free article] [PubMed] [Google Scholar]
- 4. Kakimoto Y, Akazawa S. Isolation and identification of N‐G,N‐G‐ and N‐G,N'‐G‐dimethyl‐arginine, N‐epsilon‐mono‐, di‐, and trimethyllysine, and glucosylgalactosyl‐ and galactosyl‐delta‐hydroxylysine from human urine. J Biol Chem. 1970;245:5751‐5758. [PubMed] [Google Scholar]
- 5. McDermott JR. Studies on the catabolism of Ng‐methylarginine, Ng, Ng‐dimethylarginine and Ng, Ng‐dimethylarginine in the rabbit. Biochem J. 1976;154:179‐184. [DOI] [PMC free article] [PubMed] [Google Scholar]
- 6. Kielstein JT, Salpeter SR, Bode‐Boeger SM, Cooke JP, Fliser D. Symmetric dimethylarginine (SDMA) as endogenous marker of renal function‐‐a meta‐analysis. Nephrol Dial Transplant. 2006;21:2446‐2451. [DOI] [PubMed] [Google Scholar]
- 7. Nabity MB, Lees GE, Boggess MM, et al. Symmetric dimethylarginine assay validation, stability, and evaluation as a marker for the early detection of chronic kidney disease in dogs. J Vet Intern Med. 2015;29:1036‐1044. [DOI] [PMC free article] [PubMed] [Google Scholar]
- 8. Hall JA, Yerramilli M, Obare E, Yerramilli M, Almes K, Jewell DE. Serum concentrations of symmetric dimethylarginine and creatinine in dogs with naturally occurring chronic kidney disease. J Vet Intern Med. 2016;30:794‐802. [DOI] [PMC free article] [PubMed] [Google Scholar]
- 9. IDEXX SDMA Test: More reliable kidney function test . https://www.idexx.com/small-animal-health/sdma-home.html: Idexx Laboratories, 2017.
- 10. Abrahamson M, Olafsson I, Palsdottir A, et al. Structure and expression of the human cystatin C gene. Biochem J. 1990;268:287‐294. [DOI] [PMC free article] [PubMed] [Google Scholar]
- 11. Jacobsson B, Lignelid H, Bergerheim US. Transthyretin and cystatin C are catabolized in proximal tubular epithelial cells and the proteins are not useful as markers for renal cell carcinomas. Histopathology. 1995;26:559‐564. [DOI] [PubMed] [Google Scholar]
- 12. Grubb A, Simonsen O, Sturfelt G, Truedsson L, Thysell H. Serum concentration of cystatin C, factor D and beta 2‐microglobulin as a measure of glomerular filtration rate. Acta Med Scand. 1985;218:499‐503. [DOI] [PubMed] [Google Scholar]
- 13. Simonsen O, Grubb A, Thysell H. The blood serum concentration of cystatin C (gamma‐trace) as a measure of the glomerular filtration rate. Scand J Clin Lab Invest. 1985;45:97‐101. [DOI] [PubMed] [Google Scholar]
- 14. Larsson A, Malm J, Grubb A, Hansson LO. Calculation of glomerular filtration rate expressed in mL/min from plasma cystatin C values in mg/L. Scand J Clin Lab Invest. 2004;64:25‐30. [DOI] [PubMed] [Google Scholar]
- 15. Grubb A, Horio M, Hansson LO, et al. Generation of a new cystatin C‐based estimating equation for glomerular filtration rate by use of 7 assays standardized to the international calibrator. Clin Chem. 2014;60:974‐986. [DOI] [PubMed] [Google Scholar]
- 16. Bjork J. Back SE, Ebert N, et al. GFR estimation based on standardized creatinine and cystatin C: a European multicenter analysis in older adults. Clin Chem Lab Med. 2018;56:422‐435. [DOI] [PubMed] [Google Scholar]
- 17. Bjork J, Grubb A, Gudnason V, et al. Comparison of glomerular filtration rate estimating equations derived from creatinine and cystatin C: validation in the age, gene/environment susceptibility‐reykjavik elderly cohort. Nephrol Dial Transplant. 2018;33:1380‐1388. [DOI] [PMC free article] [PubMed] [Google Scholar]
- 18. Almy FS, Christopher MM, King DP, Brown SA. Evaluation of cystatin C as an endogenous marker of glomerular filtration rate in dogs. J Vet Intern Med. 2002;16:45‐51. [DOI] [PubMed] [Google Scholar]
- 19. Wehner A, Hartmann K, Hirschberger J. Utility of serum cystatin C as a clinical measure of renal function in dogs. J Am Anim Hosp Assoc. 2008;44:131‐138. [DOI] [PubMed] [Google Scholar]
- 20. Braun J‐P, Perxachs A, Pe'CHEREAU D, De La Farge F. Plasma cystatin C in the dog: reference values and variations with renal failure. Comp Clin Pathol. 2002;11:44‐49. [Google Scholar]
- 21. Antognoni MT, Siepi D, Porciello F, Fruganti G. Use of serum cistatin C determination as a marker of renal function in the dog. Vet Res Commun. 2005;29(Suppl 2):265‐267. [DOI] [PubMed] [Google Scholar]
- 22. Antognoni MT, Siepi D, Porciello F, Rueca F, Fruganti G. Serum cystatin‐C evaluation in dogs affected by different diseases associated or not with renal insufficiency. Vet Res Commun. 2007;31(Suppl 1):269‐271. [DOI] [PubMed] [Google Scholar]
- 23. Miyagawa Y, Takemura N, Hirose H. Evaluation of the measurement of serum cystatin C by an enzyme‐linked immunosorbent assay for humans as a marker of the glomerular filtration rate in dogs. J Vet Med Sci. 2009;71:1169‐1176. [DOI] [PubMed] [Google Scholar]
- 24. Monti P, Benchekroun G, Berlato D, Archer J. Initial evaluation of canine urinary cystatin C as a marker of renal tubular function. J Small Anim Pract. 2012;53:254‐259. [DOI] [PubMed] [Google Scholar]
- 25. Marynissen SJ, Smets PM, Ghys LF, et al. Long‐term follow‐up of renal function assessing serum cystatin C in dogs with diabetes mellitus or hyperadrenocorticism. Vet Clin Pathol. 2016;45:320‐329. [DOI] [PubMed] [Google Scholar]
- 26. Ghys L, Paepe D, Smets P, Lefebvre H, Delanghe J, Daminet S. Cystatin C: a new renal marker and its potential use in small animal medicine. J Vet Intern Med. 2014;28:1152‐1164. [DOI] [PMC free article] [PubMed] [Google Scholar]
- 27. Westgren F, Ley CJ, Kampa N, Lord P. Effects of hydration on scintigraphic glomerular filtration rate measured using integral and plasma volume methods in dogs with suspected renal disease. Vet Radiol Ultrasound. 2014;55:632‐637. [DOI] [PubMed] [Google Scholar]
- 28. Kampa N, Bostrom I, Lord P, Wennstrom U, Ohagen P, Maripuu E. Day‐to‐day variability in glomerular filtration rate in normal dogs by scintigraphic technique. J Vet Med A Physiol Pathol Clin Med. 2003;50:37‐41. [DOI] [PubMed] [Google Scholar]
- 29. Peters AM. Expressing glomerular filtration rate in terms of extracellular fluid volume. Nephrol Dial Transplant. 1992;7:205‐210. [DOI] [PubMed] [Google Scholar]
- 30. Peters AM, Allison H, Ussov W. Simultaneous measurement of extracellular fluid distribution and renal function with a single injection of 99mTc DTPA. Nephrol Dial Transplant. 1995;10:1829‐1833. [PubMed] [Google Scholar]
- 31. Fagan TJ. Letter: nomogram for Bayes's theorem. N Engl J Med. 1975;293:257. [DOI] [PubMed] [Google Scholar]
- 32. Hayden SR, Brown MD. Likelihood ratio: a powerful tool for incorporating the results of a diagnostic test into clinical decisionmaking. Ann Emerg Med. 1999;33:575‐580. [DOI] [PubMed] [Google Scholar]
- 33. Ulleberg T, Robben J, Nordahl KM, Ulleberg T, Heiene R. Plasma creatinine in dogs: intra‐ and inter‐laboratory variation in 10 European veterinary laboratories. Acta Vet Scand. 2011;53:25. [DOI] [PMC free article] [PubMed] [Google Scholar]
- 34. van den Brom WE, Biewenga WJ. Assessment of glomerular filtration rate in normal dog: analysis of the 51Cr‐EDTA clearance and its relation to several endogenous parameters of glomerular filtration. Res Vet Sci. 1981;30:152‐157. [PubMed] [Google Scholar]
- 35. Braun JP, Lefebvre HP, Watson AD. Creatinine in the dog: a review. Vet Clin Pathol. 2003;32:162‐179. [DOI] [PubMed] [Google Scholar]
- 36. Hall JA, Yerramilli M, Obare E, Yerramilli M, Melendez LD, Jewell DE. Relationship between lean body mass and serum renal biomarkers in healthy dogs. J Vet Intern Med. 2015;29:808‐814. [DOI] [PMC free article] [PubMed] [Google Scholar]
- 37. Zaldivar‐Lopez S, Marin LM, Iazbik MC, et al. Clinical pathology of Greyhounds and other sighthounds. Vet Clin Pathol. 2011;40:414‐425. [DOI] [PMC free article] [PubMed] [Google Scholar]
- 38. Dunlop MM, Sanchez‐Vazquez MJ, Freeman KP, Gibson G, Sacchini F, Lewis F. Determination of serum biochemistry reference intervals in a large sample of adult Greyhounds. J Small Anim Pract. 2011;52:4‐10. [DOI] [PubMed] [Google Scholar]
- 39. Drost WT, Couto CG, Fischetti AJ, Mattoon JS, Iazbik C. Comparison of glomerular filtration rate between Greyhounds and non‐Greyhound dogs. J Vet Intern Med. 2006;20:544‐546. [DOI] [PubMed] [Google Scholar]
- 40. Feeman WE 3rd, Couto CG, Gray TL. Serum creatinine concentrations in retired racing Greyhounds. Vet Clin Pathol. 2003;32:40‐42. [DOI] [PubMed] [Google Scholar]
- 41. Finney H, Newman DJ, Price CP. Adult reference ranges for serum cystatin C, creatinine and predicted creatinine clearance. Ann Clin Biochem 2000;37 ( Pt 1):49–59. [DOI] [PubMed] [Google Scholar]
- 42. Finney H, Newman DJ, Thakkar H, Fell JM, Price CP. Reference ranges for plasma cystatin C and creatinine measurements in premature infants, neonates, and older children. Arch Dis Child. 2000;82:71‐75. [DOI] [PMC free article] [PubMed] [Google Scholar]
- 43. Galteau MM, Guyon M, Gueguen R, Siest G. Determination of serum cystatin C: biological variation and reference values. Clin Chem Lab Med. 2001;39:850‐857. [DOI] [PubMed] [Google Scholar]
- 44. Ghys LF, Paepe D, Lefebvre HP, et al. The effect of feeding, storage and anticoagulant on feline serum cystatin C. Vet J. 2015;206:91‐96. [DOI] [PubMed] [Google Scholar]
- 45. Whiting PF, Rutjes AW, Westwood ME, et al. QUADAS‐2: a revised tool for the quality assessment of diagnostic accuracy studies. Ann Intern Med. 2011;155:529‐536. [DOI] [PubMed] [Google Scholar]
- 46. Polzin DJ. Chronic kidney disease In: Ettinger SJ, Feldman EC, Côte E, eds. Textbook of Veterinary Internal Medicine. St. Louis, MO: Elsevier; 2017. [Google Scholar]
- 47. Krawiec DR, Badertscher RR 2nd, Twardock AR, et al. Evaluation of 99mTc‐diethylenetriaminepentaacetic acid nuclear imaging for quantitative determination of the glomerular filtration rate of dogs. Am J Vet Res. 1986;47:2175‐2179. [PubMed] [Google Scholar]
- 48. Haller M, Muller W, Binder H, et al. Single‐injection inulin clearance‐‐a simple method for measuring glomerular filtration rate in dogs. Res Vet Sci. 1998;64:151‐156. [DOI] [PubMed] [Google Scholar]
- 49. Kampa N, Wennstrom U, Lord P, et al. Effect of region of interest selection and uptake measurement on glomerular filtration rate measured by 99mTc‐DTPA scintigraphy in dogs. Vet Radiol Ultrasound. 2002;43:383‐391. [DOI] [PubMed] [Google Scholar]
- 50. Bovee KC, Joyce T. Clinical evaluation of glomerular function: 24‐hour creatinine clearance in dogs. J Am Vet Med Assoc. 1979;174:488‐491. [PubMed] [Google Scholar]
- 51. Finco DR, Coulter DB, Barsanti JA. Simple, accurate method for clinical estimation of glomerular filtration rate in the dog. Am J Vet Res. 1981;42:1874‐1877. [PubMed] [Google Scholar]
- 52. Fettman MJ, Allen TA, Wilke WL, Radin MJ, Eubank MC. Single‐injection method for evaluation of renal function with 14C‐inulin and 3H‐tetraethylammonium bromide in dogs and cats. Am J Vet Res. 1985;46:482‐485. [PubMed] [Google Scholar]
- 53. Barthez PY, Hornof WJ, Cowgill LD, Neal LA, Mickel P. Comparison between the scintigraphic uptake and plasma clearance of 99mTc‐diethylenetriaminepentacetic acid (DTPA) for the evaluation of the glomerular filtration rate in dogs. Vet Radiol Ultrasound. 1998;39:470‐474. [DOI] [PubMed] [Google Scholar]
- 54. Bexfield NH, Heiene R, Gerritsen RJ, et al. Glomerular filtration rate estimated by 3‐sample plasma clearance of iohexol in 118 healthy dogs. J Vet Intern Med. 2008;22:66‐73. [DOI] [PubMed] [Google Scholar]
- 55. Tabaru H, Finco DR, Brown SA, Cooper T. Influence of hydration state on renal functions of dogs. Am J Vet Res. 1993;54:1758‐1764. [PubMed] [Google Scholar]
- 56. Kampa N, Lord P, Maripuu E, et al. Effects of measurement of plasma activity input on normalization of glomerular filtration rate to plasma volume in dogs. Vet Radiol Ultrasound. 2007;48:585‐593. [DOI] [PubMed] [Google Scholar]
- 57. Sunde K, Nilsen T, Flodin M. Performance characteristics of a cystatin C immunoassay with avian antibodies. Ups J Med Sci. 2007;112:21‐37. [DOI] [PubMed] [Google Scholar]