

etoc Blurb
Zhou et al. investigate the hypothesis that orientation of mitotic spindles plays a key role in determining organ shape. Unexpectedly, they find that orientated cell divisions are not required for the normal shape of the Drosophila wing, and that the absence of oriented divisions can be compensated for by other cellular processes.
Keywords: wing, spindle orientation, morphogenesis, shape, cell division
SUMMARY
Formation of correctly shaped organs is vital for normal function. The Drosophila wing has an elongated shape, which has been attributed in part to a preferential orientation of mitotic spindles along the proximal-distal axis [1, 2]. Orientation of mitotic spindles is believed to be a fundamental morphogenetic mechanism in multicellular organisms [3–6]. A contribution of spindle orientation to wing shape was inferred from observations that mutation of Dachsous-Fat pathway genes results in both rounder wings, and loss of the normal proximal-distal bias in spindle orientation [1, 2, 7]. To directly evaluate the potential contribution of spindle orientation to wing morphogenesis, we assessed the consequences of loss of the Drosophila NuMA homolog Mud, which interacts with the dynein complex and has a conserved role in spindle orientation [8, 9]. Loss of Mud randomizes spindle orientation, but does not alter wing shape. Analysis of growth and cell dynamics in developing discs and in ex vivo culture suggests that the absence of oriented cell divisions is compensated for by an increased contribution of cell rearrangements to wing shape. Our results indicate that oriented cell divisions are not required for wing morphogenesis, nor are they required for the morphogenesis of other Drosophila appendages. Moreover, our results suggest that normal organ shape is not achieved through locally specifying and then summing up individual cell behaviors like oriented cell division. Instead wing shape might be specified through tissue-wide stresses that dictate an overall arrangement of cells without specifying the individual cell behaviors needed to achieve it.
RESULTS and DISCUSSION
Loss of mud randomizes spindle orientation, but does not alter wing shape
To evaluate the role of spindle orientation in directing organ shape, we examined the wings of adult flies mutant for the Drosophila NuMA homolog mushroom body defect (mud) [8, 9]. Flies hemizygous for an amorphic allele, mud4, are viable and have wings that are slightly smaller, but similar in shape, to the wings of wild-type controls (Figure 1A,B,E–H). Similarly, adult wings from flies in which mud was knocked down throughout wing development by expressing a mud RNAi line in wing cells under nub-Gal4 control appear similar in shape to control wings, and slightly reduced in size (Figure 1C-E,H, quantitation of roundness revealed no difference in males wings, and only a 2% difference in female wings).
Figure 1. Loss of mud randomizes spindle orientation, but does not alter wing shape.
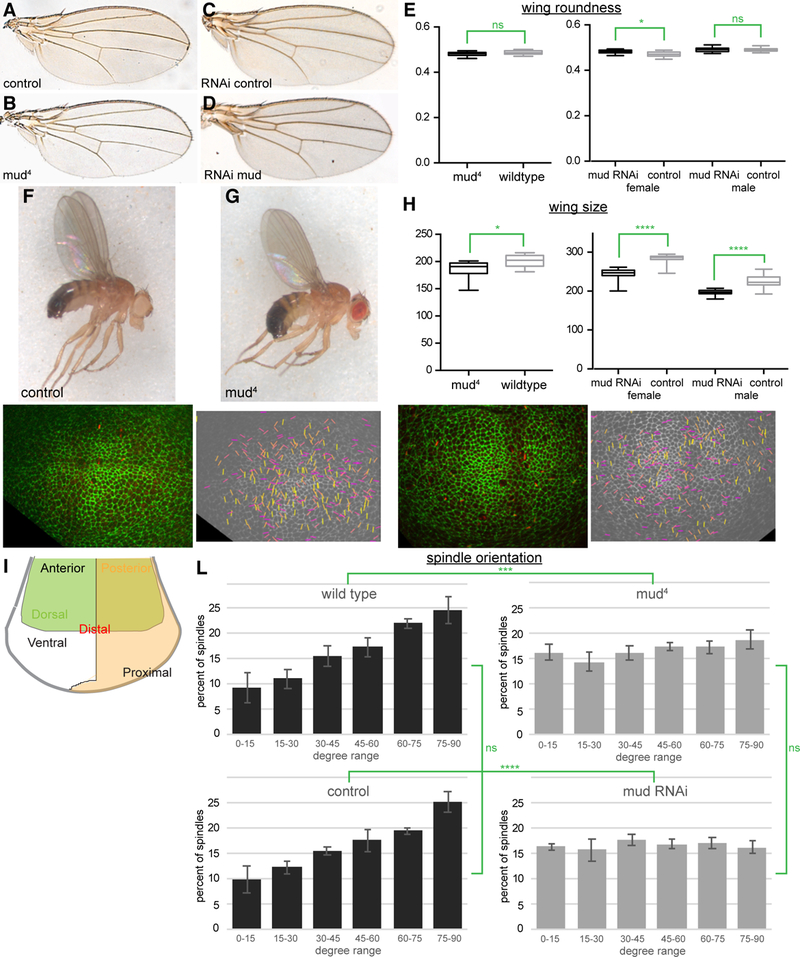
(A-D) Adult wings from (A) w1118 (B) mud4 (C) nub-Gal4 UAS-dcr2 and (D) nub-Gal4 UAS-dcr2 UAS-mud-RNAi flies. (E) Mean roundness of wings of the indicated genotypes, calculated from 13 (mud4), 16 (wildtype), 19 (female mud RNAi), 12 (female RNAi control), 20 (male mud RNAi), and 15 (male RNAi control) wings. Significance of differences calculated by t test are indicated. (F-G) Adult male flies of (F) w1118 and (G) mud4. (H) Mean wing area (in arbitrary units) for the indicated genotypes. Significance of differences calculated by t test are indicated. (I) Schematic of the wing disc showing the anterior-posterior (AP), dorsal-ventral (DV) and distal-proximal (PD) regions. (J,K) Snapshots from ex vivo live imaging of control (J) or mud4 (K) wing discs, with cell junctions labeled by E-cadherin:GFP and spindles labeled by Jupiter:RFP. In images at right all spindle orientations from a 14 h video are plotted onto one image. Each line represents one spindle. Yellow identifies spindles perpendicular (60–90°), orange identifies spindles 30–60°, and magenta identifies spindles parallel (0–30°) to the D-V boundary. (L) Quantitative analyses of spindle orientation with respect to the D-V boundary in cultured wing discs from wild-type control (w1118) (N=1797 spindles from 5 discs), mud4 (N=1722 spindles from 5 discs), nub-Gal4 UAS-dcr2 control (N=643 spindles from 3 discs), and nub-Gal4 UASdcr2 UAS-mud-RNAi (N=1088 spindles from 3 discs). Error bars show the standard deviation in results from different discs. The results of Chi square tests of comparisons of the distributions are indicated in green. See also Videos S1 and S2.
Spindle orientation is precisely controlled along two axes in the developing wing imaginal disc. Spindles are aligned parallel to the surface of the disc epithelium (perpendicular to the apical-basal axis), which ensures cell divisions occur within the plane of the disc. Spindles in most of the developing wing also tend to be oriented along the proximal distal axis, which in the central part of the disc is perpendicular to the dorsal-ventral (D-V) compartment boundary (Figure 1I–L). It has previously been reported that mud mutation or RNAi disrupts the normal planar orientation of mitotic spindles in the wing disc [10, 11], and that mud is required for alignment of spindles induced by cell shape and tri-cellular junctions [12]. However, whether loss of mud also disrupts the normal proximal-distal bias in spindle orientation in the developing wing has not been reported.
To examine this, we labelled mitotic spindles by using a MiMIC insertion to create an RFP-tagged allele of the microtubule-associated protein Jupiter [13], and labelled cell junctions using a GFP-tagged E-cadherin transgene. Wing discs expressing these fluorescently-labelled proteins were dissected from third instar larvae, cultured ex vivo, and imaged every 6–8 minutes on a spinning disc confocal microscope for 12 hours (Figure 1J,K, Videos S1,S2). This analysis was performed using a recently developed method for ex vivo imaginal disc culture, which facilitates extended growth in culture and maintains disc patterning and gene expression, thus enabling dynamic imaging of cell behaviors in growing discs for an extended time [14]. The resulting videos were then segmented to identify mitotic spindles, and the final spindle orientation for dividing cells within the wing pouch was identified and measured relative the D-V boundary (Figure 1J-L). For spindles that were tilted towards the apical-basal axis, we used the projection of these spindles onto the XY plane. In wild-type wing discs, spindles were preferentially oriented towards the D-V boundary, consistent with earlier studies [1, 2, 7]. In contrast, in mud mutant wing discs, or wing discs expressing a mud RNAi line, there was no preferred spindle orientation (Figure 1L). Thus, loss of mud randomizes spindle orientations in the wing disc along both apical-basal [10, 11] and planar axes.
mud mutant wing discs have oriented growth without oriented cell divisions
The observation that wing shape is normal in mud mutant or RNAi flies, despite randomly oriented spindles, implies that the normal orientation of cell divisions is not required for wing shape. We considered the possibility that daughter cells might reorient along the proximal-distal axis immediately after division, but did not observe this in our live imaging videos. To quantitatively assess cell division orientation, we used the cell division nematics function of Tissue Analyzer software [15]. This provides an indication of the preferred cell division orientation throughout different time points of a live imaging video based on identification of daughter cells in videos with a segmented cell membrane marker. Applying this analysis to wild-type discs expressing E-cadherin:GFP revealed a preferential dorsal-ventral orientation of cell divisions, whereas applying this analysis to mud mutant wing discs revealed no preferred orientation of cell divisions (Figure 2A).
Figure 2. Normally oriented growth in the absence of mud.
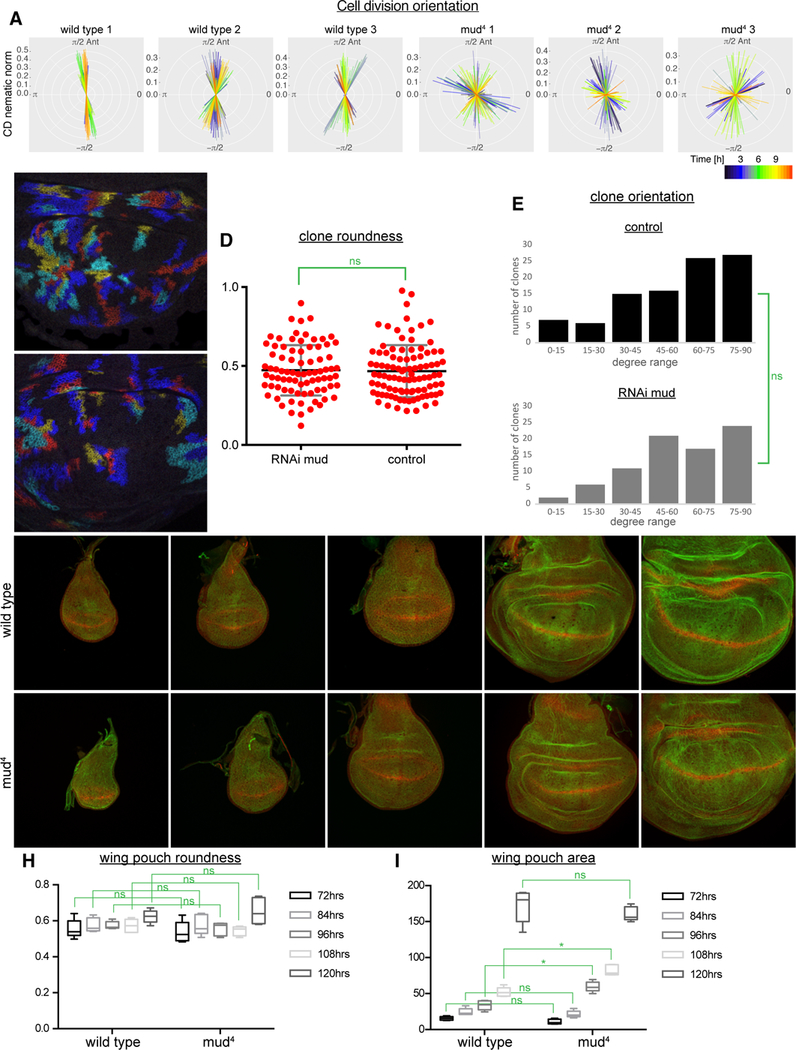
(A) Analysis of cell division nematics of three wildtype and three mud4 live imaging videos. Different colored lines indicate the predominant cell division orientation at different time points throughout 12 h of a live imaging video (key at bottom right). (B-C) Examples of labelled clones (blue, cyan, red and yellow, labelled using Raepeli technique) in wildtype (B) and mud RNAi (C) wing discs. (D) Analysis of the shape of labelled clones shows a similar distribution of clone roundness in control and mud RNAi wing discs. Significance of differences calculated by t test is indicated, N=101 clones (control) and 87 clones (mud RNAi). (E) Analysis of the orientation of clones shows a similar bias in clone orientations perpendicular rather than parallel to the D-V boundary in control and mud RNAi wing discs. The results of Chi square tests of comparisons of the distributions are indicated, N=97 clones (control) and 81 clones (mud RNAi). (F-G) Images of mud4 (G) and wildtype (F) wing discs at 72, 84, 96, 108 and 120 h AEL. (H) The roundness of the wing pouch region (defined by Wg expression) is similar between mud4 and wild type at all stages. (I) Comparison of the area of the wing pouch between mud4 and wild type. Significance of differences calculated by t test are indicated, N=5 discs for each time point of each genotype.
We also considered the possibility that compensatory mechanisms during pupal development might generate normally shaped wings despite abnormally oriented growth within the larval wing disc. To investigate the orientation of growth within discs, we used the Raeppli technique [16] to label clones of cells within developing wing discs and examined their growth. The relative elongation and orientation of labelled clones generated within mud RNAi discs was then compared to clones generated within control wing discs. Elongation was quantified by defining the roundness of each clone, and orientation was defined by comparing the long axis of each clone to the D-V boundary. Roundness varies from clone to clone, but the overall distribution of clone roundness within wild-type or mud RNAi wing discs is similar (Figure 2B-D). Clones created within mud RNAi wing discs also tend to be oriented perpendicular to the D-V boundary, as occurs in wild-type wing discs (Figure 2B,C,E). Thus, wing discs lacking mud retain oriented growth, despite lacking oriented cell divisions.
We also analyzed the overall size and shape of the wing pouch, as defined by the inner ring of Wingless (Wg) expression. Wing discs were examined at time points throughout the third larval instar (72, 84, 96, 108, and 120 h after egg laying (AEL)). Overall wing pouch size and shape were similar between wild-type and mud4 mutant wing discs, although transient differences in size were detected around mid-third instar (Figure 2F–I). Altogether, these observations indicate that the overall organization of growth within the developing wing disc is unaffected by the randomization of cell division orientation.
Analysis of cell behaviors contributing to wing disc shape
To investigate how normally oriented wing growth can occur despite abolishment of normal division orientation, we analyzed live imaging videos of wing discs expressing Jupiter:RFP and E-cad:GFP. Wing discs were dissected from mid-third instar larvae (96h AEL), cultured for 12–14 h and imaged every 6–8 minutes throughout this time. The resulting videos were then fully segmented including manual correction at each time point so that individual cells could be identified, characterized, and tracked. Changes in relative disc shape (shear) during culture, together with the contributions of different cell behaviors to this shape change, were analyzed using the TissueMiner computational framework [17]. A key component of this approach involves triangulation of segmented cellular networks to identify and quantify the contributions of different types of cell behaviors to tissue shear [17, 18] (Figure 3A).
Figure 3. Cellular components of tissue shear in mud mutants.
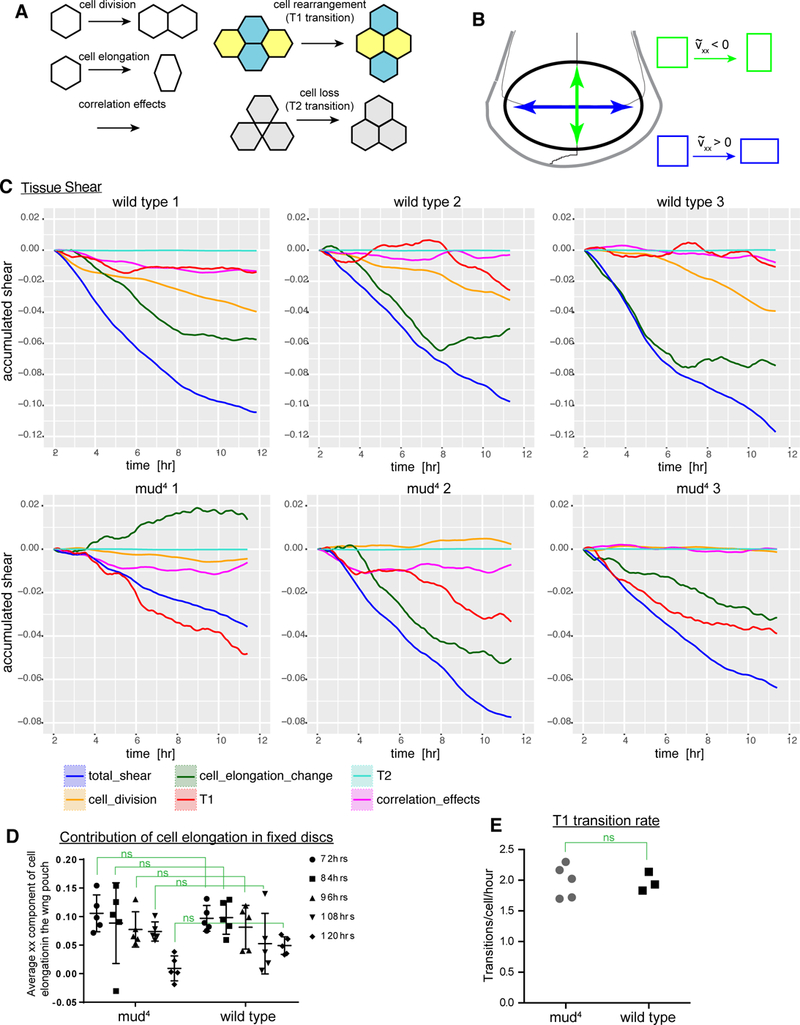
(A) Illustrations of different types of cell dynamics that can contribute to tissue shear [17, 18]. (B) Schematic illustrating how the sign of the shear tensor indicates the direction of the change in shape. (C) Analysis of accumulated shear (blue) and the contribution of different cellular processes to this shear (key at bottom) in three wildtype and three mud4 discs from 2 – 12 h of culture, averaged over the entire tracked region. (D) Analysis of the xx component of cell elongation, averaged throughout the wing pouch of mud4 and wildtype wing discs at 72, 84, 96, 108 and 120 h AEL that were imaged as illustrated in Figure 2 and then segmented based on E-cadherin:GFP to outline all cells. Each dot represents the averaged value for one disc; center line indicates the mean value. Significance of differences calculated by t test are indicated, N=5 discs for each time point of each genotype. (E) Scatter plot showing the T1 transition rates within segmented videos of wildtype and mud4 ex vivo culture. Significance of difference calculated by t test is indicated. See also Figure S1, and videos S1 to S4.
In the coordinate system used to measure shear, positive shear indicates shear parallel to the wing D-V boundary, whereas negative shear indicates shear perpendicular to the D-V boundary (Figure 3B). Analysis of the wing pouch regions of three wild-type wing discs revealed an accumulation of negative shear over time, indicating that shear perpendicular to the D-V boundary occurs. Analysis of cell dynamics revealed that three cell behaviors account for most of this shear: oriented cell divisions, T1 transitions (cell rearrangements), and cell elongation (Figure 3C). The respective contributions of these different cellular processes vary from disc to disc. The results of our analysis are similar to those of Dye, et al. [14], who developed the methods for long term disc culture and analysis that we used, both in terms of the total shear detected, and the contributions of different cellular processes to this shear.
We performed the same analysis on five mud mutant wing discs. As in wild-type, mud mutant discs proliferated throughout 12 h of ex vivo culture, although on average fewer cell divisions were detected (Figure S1A). Direct observation revealed that in a fraction of cell divisions (~15%) a spindle orientation perpendicular to the plane of the disc epithelium results in the basal extrusion of one of the daughter cells. In most cases these extruded daughter cells are permanently lost, and apoptotic cells can be detected basal to the disc epithelium of mud mutant discs (Figure S1C), although in a few cases (9% of these perpendicular divisions), the more basal cell later re-enters the disc epithelium. As in wild-type, mud mutant wings cultured ex vivo undergo a negative shear that accumulates over time (Figure 3C, S1D), although the total shear observed in mud mutant discs was more variable and overall less than observed in wild-type discs. As the growth of mud wing discs, and wing pouch shape, are similar to wild-type discs in vivo (Figure 2F-I), mud discs might be more sensitive than wild-type discs to ex vivo culture, but they nonetheless exhibit cell proliferation and accumulation of shear throughout ex vivo culture (Figure 3).
Consistent with the randomization of division orientation in mud mutants, cell division did not contribute significantly to the total shear observed (Figures 3, S1). Cell elongation also contributed less to the total shear in three out of five mud mutant discs, which was unexpected, but might suggest that randomization of spindle orientation can affect local stresses that influence cell shape. To complement our analysis of cell behaviors in culture, we also examined cell shapes and orientations in fixed discs at different times throughout third instar, and quantified the contribution of cell elongation to wing disc shape [14]. This revealed a similar overall contribution of cell elongation and orientation to wing shape between wild-type and mud mutant discs (Figure 3D). This contribution is positive (indicating a contribution of cell shape to elongation along the D-V boundary), but it declines over time [14, 19]. Our live imaging videos begin around 96 h AEL, and run for 12 h. In fixed discs we observed a greater decrease in the cell elongation contribution in wild-type discs as compared to mud4 mutant discs from the 96–108h time points, but this difference was not statistically significant (Figure 3D).
In contrast to the lack of significant contribution from cell division, T1 transitions made a substantial contribution to the total shear observed in mud4 mutant discs, and a greater contribution to disc shear than in wild-type wing discs (Figure 3C, S1D). Thus, we infer that the lack of contribution of oriented cell divisions to wing disc shear in mud mutant discs, and to final wing shape in adult flies, is compensated for at least in part by an increased contribution of T1 transitions. Although the contribution of T1 transitions to wing disc shear is greater in mud mutant wing discs, the total number of T1 transitions that occur is similar between wild-type and mud mutants (Figure 3E, Videos S3,S4). This suggests that there is a distinct bias in the average orientation of T1 transitions in mud mutants as compared to wild-type wing discs.
Generation of wing shape
Our analysis of mud mutants establishes that oriented cell divisions do not make an essential contribution to normal wing morphogenesis. They occur, but they are unnecessary. Moreover, as mud4 mutants are viable and have a normal external morphology (Figure 1F,G), it appears that oriented cell divisions are not required for morphogenesis of any part of the adult Drosophila cuticle and appendages. Suggestions that oriented cell divisions drive oriented growth hypothesize that local, individual cell behaviors (eg oriented cell division) are specified and then summed to determine the shape of an organ (Figure 4A). For example, in the Drosophila wing, it was proposed that “Tissues can grow in a particular direction by controlling the orientation of cell division” [1]. Our observations instead suggest that the overall shape of the organ can be determined without specifying the cell behaviors needed to achieve it. In this view, oriented cell divisions could occur as a response to mechanisms that orient growth rather than being a cause of oriented growth.
Figure 4. Relating cell behaviors to wing shape.
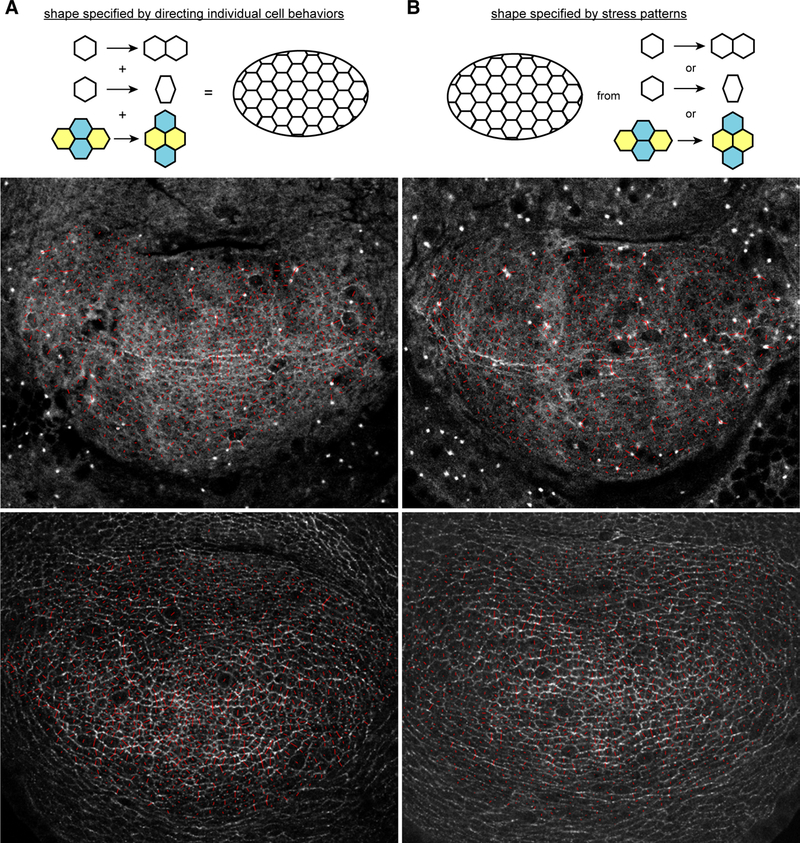
A,B) Cartoons illustrating two alternative mechanisms for controlling morphogenesis. (A) Organ shape is generated by specifying and then summing individual cell behaviors. (B) Organ shape is generated by defining a “morphogenetic space” that can be filled through a variety of cell behaviors, whose contributions are not individually defined and may vary in different animals.C-F) Examples of wing discs expressing GFP-tagged Myosin II heavy chain (Zip, C,D) or Dachs (E,F) in wild-type control (C,E) or mud4 mutant (D,F) males. Red lines superimposed on the images indicate anisotropy of junctional Zip or Dachs within each cell, with the orientation indicating the axis of anisotropy and the length indicating the magnitude of anisotropy. See also Figure S2.
One possible mediator of such a mechanism is mechanical stress. Cells subject to external forces can exhibit a variety of stress relaxation behaviors, including changes in cell shape, oriented divisions, and cell rearrangements [19–22]. A stress-based mechanism for wing morphogenesis could thus account for variations in the contributions of different cell behaviors to the total shear of wing discs cultured ex vivo [14], as well as for the continuation of normal morphogenesis when one of these mechanisms (oriented cell divisions) is abolished. Similarly, during zebrafish epiboly, tension orients cell divisions by orienting cell elongation. Epiboly can still proceed when cell division orientations are randomized, but cell fusions increase [21].
While the precise mechanism by which wing shape is specified is not yet clear, genetically it depends upon the Dachsous-Fat pathway, as formation of rounder wings is a characteristic phenotype of mutations in genes of this pathway [23–29]. The organization of Dachsous-Fat polarity could establish tissue-wide stresses through controlling the localization of the unconventional myosin Dachs, as Dachs localization is controlled by Ds-Fat signaling [26], and Dachs can influence junctional tension [1, 30, 31]. These tissue-wide stresses could influence the overall shape of the growing wing disc, and ultimately the adult wing, without specifying the particular cellular behaviors by which it is achieved (Figure 4B). Consistent with this possibility, the normal proximal-distal bias in Dachs and Myosin II (Zipper, Zip) localization on junctions is maintained in mud mutant wing discs (Figures 4C-F, S2).
STAR Methods
Contact for Reagent and Resource Sharing
Further information and requests for reagents may be directed to, and will be fulfilled by, the corresponding author Ken Irvine (irvine@waksman.rutgers.edu).
Experimental Model and Subject Details
Unless otherwise indicated, flies were raised on standard medium at 25 °C. w1118 are used as control flies. Ubi-Ecad:GFP was obtained from the Kyoto stock center. Jupitor:RFP was created from the MiMIC line JupiterMI00919 by insertion of the TagRFP 3xHA cassette [32] using services of BestGene. P(w[+mC]=Raeppli-CAAX)67E/TM6B for Reappli and other flies were obtained from the Bloomington Drosophila stock center. Both male and female flies were used. For measurements of wing area, males and females were analyzed separately at 1 day after eclosion. The information for all fly lines is described in the Key Resources Table.
Key Resources Table.
| REAGENT or RESOURCE | SOURCE | IDENTIFIER |
|---|---|---|
| Antibodies | ||
| Anti-wingless | DSHB | RRID: AB_528512 |
| Anti-Cleaved Caspase | Cell Signaling | 9658P |
| Anti-E-cad | DSHB | RRID: AB_528120 |
| Chemicals, Peptides, and Recombinant Proteins | ||
| Paraformaldehyde | Fisher Scientific | Cat# T353–500 |
| Hoechst | Invitrogen | Cat# H3570 |
| Grace’s Insect Medium | Sigma-Aldrich | Cat# G9771 |
| 20-hydroxyecdysone | Sigma-Aldrich | Cat# H5142–5MG |
| BisTris | Sigma-Aldrich | Cat# B4429–25G |
| Fetal Bovine Serum | Thermo-Fisher | Cat# 10082147 |
| Pen Strep | Thermo-Fisher | Cat# 15070063 |
| Experimental Models: Organisms/Strains | ||
| Fly: Ubi-Ecad:GFP | [34] | N/A |
| Fly: Jupiter:RFP | This manuscript | N/A |
| Fly: zip:GFP | BDSC | Stock# 51564 |
| Fly: dachs:GFP | [31] | N/A |
| Fly: mud4/FM7i | BDSC | Stock# 9563 |
| Fly: UAS-RNAi mud | BDSC | Stock# 38190 |
| Fly: w;P(w[+mC]=Raeppli-CAAX)67E | BDSC | Stock# 55083 |
| Fly: nubbin-Gal4 UAS-dcr2 | [35] | N/A |
| Software and Algorithms | ||
| Matlab2016b | Mathworks Inc., USA | http://mathworks.com |
| Fiji | [36] | https://fiji.sc |
| ImSAnE matlab script | [33] | https://media.nature.com/original/nature-assets/nmeth/journal/v12/n12/extref/nmeth.3648-S2.zip |
| ilastik | [37] | http://ilastik.org/index.html |
| Prism 6.0 | GraphPad | https://www.graphpad.com/scientific-software/prism/, RRID: SCR_002798 |
| R ver.3.4.1 | [38] | https://www.r-project.org |
| TissueAnalyzer | [39] | https://grr.gred-clermont.fr/labmirouse/software/WebPA/index.html |
| TIssueMiner | [17] | https://github.com/mpicbg-scicomp/tissue_miner |
| Spindle Orientation script | This manuscript | https://github.com/alegoth/Spindle-Orientation-Analysis |
| Others | ||
| 35mm petri dish | MatTek corporation | P35G-0–14-C |
| Cyclopore polycarbonate membrane | GE healthcare | Cat# 7060–2513 |
| Leica SP8 confocal | Leica Microsystems | https://www.leica-microsystems.com/ |
| UltraView Spinning disc confocal | PerkinElmer | http://www.perkinelmer.com/lab-products-and-services/cellular-imaging/confocal-imaging.html |
Method Details
Quantification of adult wings
Adult wing phenotypes of mud mutants were scored by comparing mud4 hemizygous and w1118 males. Adult wing phenotypes of mud RNAi were scored by crossing nub-Gal4 UAS-dcr2 females to UAS-RNAi mud /CyO,GFP or If/CyO,GFP (control) males. All wings were photographed at the same magnification. For quantification, at least 12 wings per genotype were manually traced in Fiji (NIH ImageJ) and then analyzed using area and shape descriptors measure functions of Fiji. This calculates roundness using 4 x Area/(π x [Major axis]2).
Examination and quantitation of fixed wing discs
y w; Ubi-Ecad:GFP/CyO,GFP; Jupitor:RFP/TM6B males were crossed with either mud4 or w1118 females. Wing discs from male larvae at specified time points after egg laying (AEL) were dissected and fixed in 4% paraformaldehyde (Fisher, T353–500) for 12 min at room temperature, and stained using mouse anti-Wg (1:400, DSHB) and donkey anti-mouse IgG:Cy5 (Jackson ImmunoResearch). Wing discs were mounted on a microscope slide and images captured on a Leica SP8 confocal microscope.
The wing pouch was defined by anti-Wg staining, and quantified by manually tracing this region in Fiji, and calaculating the area and roundness using the Area and Shape descriptors measurement functions of Fiji.
For cell elongation analysis, the E-cad:GFP channel from confocal images of fixed wing discs were processed with the ImSAnE Matlab script [33] to project the apical plane onto a 2D surface based on maximal brightness of the E-Cadherin-GFP signal. The E-cad signal in the central pouch region was then segmented using Tissue Analyzer. Tissue Miner was then used to plot the xx component of cell elongation averaged by the area for each disc and the results were plotted using Graphpad Prism software.
Quantification of Zip and Dachs anisotropy
zip:GFP or dachs:GFP males were crossed with either mud4 or w1118 females. Wing discs from male larvae at 96 h AEL were dissected and fixed in 4% paraformaldehyde (Fisher, T353–500) for 12 min at room temperature, and stained using rat anti-E-cad (1:400, DSHB) and donkey anti-rat IgG:Cy5 (Jackson ImmunoResearch). Wing discs were mounted on a microscope slide and images captured on a Leica SP8 confocal microscope. For quantification of protein anisotropy, confocal image stacks were first processed with the ImSAnE Matlab script to project the apical surface onto a 2D plane based on maximal brightness of the E-Cad. Cells were then segmented based on E-Cad staining and the anisotropy of Zip:GFP or Dachs:GFP for each cell was characterized using TissueAnalyzer software.
Quantification of Raeppli clones
Raeppli clones were generated by crossing y w; nub-Gal4 UAS-dcr2/CyO,GFP; P(w[+mC]=Raeppli-CAAX)67E/TM6B females to either y w hs-Flp;UAS-RNAi-mud/CyO,GFP; Ubi-Ecad:GFP/TM6B or y w hs-Flp ;If/CyO,GFP; Ubi-Ecad:GFP/TM6B (control) males for 4 h and then maintaining them at 29°C. Larvae were heat shocked at 90 h AEL and dissected at 120 h AEL. To quantify clone shape and orientation, clone boundaries were traced manually and measured using the Shape descriptors functions of Fiji.
Live imaging and analysis of wing discs cultured ex vivo
For live imaging of mud mutants, y w; Ubi-Ecad:GFP/CyO,GFP; Jupitor:RFP/TM6B male flies were crossed with either mud4 or w1118 (control) females and then male larval progeny were examined. For live imaging of mud RNAi knock-down, nub-Gal4 UAS-dcr2 /CyO,GFP; Ubi-Ecad:GFP/TM6B females were crossed to either UAS-RNAi mud /CyO,GFP; Jupitor:RFP/TM6B or If/CyO,GFP; Jupitor:RFP/TM6B (control) males. Wing disc culture was based on the procedure of Dye et al [14]. A stock medium was prepared using Grace’s medium (Sigma, G9771) without sodium bicarbonate but with the addition of 5mM Bis-Tris and the pH was adjusted to 6.6–6.7 at room temperature. This was stored at 4°C for less than a month. Before every experiment, we added 5% fetal bovine serum (FBS; ThermoFisher, 10082147), Penicillin-Streptomycin (Thermo-Fisher, #15070063, 100× stock solution) and 10 nM 20-hydroxyecdysone (Sigma, H5142) to the medium. Larvae at 96h AEL were floated on 25% sucrose and transferred into glass dishes with culture medium. Larvae of the desired genotype were selected and sterilized in 70% ethanol for 1–2 mins. We then drew a circle on the glass bottom of a 35-mm glass-bottomed Petri dish (MatTek, P35G-0–14-C) using glue from tape (Tesa, 5388). Wing discs were dissected out of larvae and transferred into this Petri dish. Then we covered the discs with cyclopore polycarbonate membrane (GE health, 7060–2513) and glued it to the glass bottom to immobilize discs. Live wing discs were then imaged using a Perkin Elmer Ultraview spinning disc confocal microscope every 6–8 mins for 12 hours.
For analysis of spindle orientation, the Jupiter:RFP channel was segmented using Ilastik. Spindle orientation was determined using a custom MatLab script, when the spindles merge into one spindle line, which occurs after spindle rotations have completed. The orientations of spindles relative to the D-V boundary were calculated using Excel.
For analysis of tissue shear and its component cellular contributions, confocal image stacks were first processed with the ImSAnE Matlab script to project the apical surface onto a 2D plane based on maximal brightness of the E-Cadherin-GFP signal. Segmentation and cell tracking was then performed on the central wing pouch of the projected time lapse images using Tissue Analyzer. Manual correction of segmentation was required for every time frame of each video, which typically takes 2 weeks per video. Analysis of tissue shear and its cellular contributions was calculated using Tissue Miner.
Quantification and Statistical Analysis
For quantification of adult wings, at least 12 wings per genotype were manually traced in Fiji (NIH ImageJ) and then analyzed using area and shape descriptors measure functions of Fiji. Statistical significance of pairwise comparisons was assessed by t test using Prism 7 software (GraphPad). For quantification of fixed wing discs, the wing pouch was defined by anti-Wg staining, and quantified by manually tracing this region in Fiji, and calculating the area and roundness using the Area and Shape descriptors measurement functions of Fiji. Statistical significance of pairwise comparisons for each time point was assessed by t test using Prism 7 software (GraphPad). For quantification of Zip and Dachs anisotropy, the anisotropy of Zip:GFP or Dachs:GFP for each cell was characterized using TissueAnalyzer software. Statistical analysis was performed using Chi square in R (ver.3.4.1) with R stats package. To quantify Reappli clone shape and orientation, clone boundaries were traced manually and measured using the Shape descriptors functions of Fiji. Statistical significance of pairwise comparisons was assessed by t test using Prism 7 software (GraphPad). For quantification of spindle orientation, the orientations of spindles relative to the D-V boundary were calculated using a custom MatLab script.Statistical analysis was performed using Chi square in R (ver.3.4.1) with R stats package. For each dataset, details of n-values can be found in the corresponding figure legends.
Supplementary Material
Video S1 Wild type wing disc, related to Figure 1
Wild-type wing disc expressing E-cad:GFP and Jup:RFP cultured ex vivo for 12 h and imaged every 7 minutes.
Video S2 mud mutant wing disc, related to Figure 1
mud4 mutant wing disc expressing E-cad:GFP and Jup:RFP cultured ex vivo for 12 h and imaged every 6 minutes.
Video S3 T1 transition analysis in wild-type, related to Figure 3
T1 transitions detected in a segmented wild-type wing disc video.
Video S4 T1 transition analysis in mud mutant, related to Figure 3
T1 transitions detected in a segmented mud mutant wing disc video.
Highlights.
Loss of mud randomizes cell division orientation without affecting wing shape
Loss of mud does not influence the orientation of growth in developing wing discs
Cell rearrangements make a greater contribution to tissue shear in mud mutants
These observations suggest wing shape may be specified by tissue wide stresses
ACKNOWLEDGMENTS
We thank Natalie Dye and Suzanne Eaton assistance with wing disc culture and image analysis, and for helpful discussions and sharing protocols prior to publication. We thank Y. Bellaïche, the Developmental Studies Hybridoma Bank, the VDRC, and the Bloomington and Kyoto Stock Centers for antibodies and Drosophila stocks. We thank Shuguo Sun for establishing the Jup:RFP fly line. This research was supported by NIH grant R01 GM78620 (KDI), and a Busch pre-doctoral fellowship (ZZ).
Footnotes
Data and Software Availability
A custom Matlab script was used to determine the final orientation of mitotic spindles in live imaging videos based on segmentation of the Jup:RFP stain. This script is available at https://github.com/alegoth/Spindle-Orientation-Analysis
DECLARATION OF INTERESTS
The authors declare no competing interests
Publisher's Disclaimer: This is a PDF file of an unedited manuscript that has been accepted for publication. As a service to our customers we are providing this early version of the manuscript. The manuscript will undergo copyediting, typesetting, and review of the resulting proof before it is published in its final citable form. Please note that during the production process errors may be discovered which could affect the content, and all legal disclaimers that apply to the journal pertain.
REFERENCES
- 1.Mao Y, Tournier AL, Bates PA, Gale JE, Tapon N, and Thompson BJ (2011). Planar polarization of the atypical myosin Dachs orients cell divisions in Drosophila. Genes & Development 25, 131–136. [DOI] [PMC free article] [PubMed] [Google Scholar]
- 2.Baena-Lopez LA, Baonza A, and Garcia-Bellido A (2005). The orientation of cell divisions determines the shape of Drosophila organs. Curr Biol 15, 1640–1644. [DOI] [PubMed] [Google Scholar]
- 3.Bergstralh DT, Dawney NS, and St Johnston D (2017). Spindle orientation: a question of complex positioning. Development 144, 1137–1145. [DOI] [PubMed] [Google Scholar]
- 4.Gillies TE, and Cabernard C (2011). Cell division orientation in animals. Curr Biol 21, R599–609. [DOI] [PubMed] [Google Scholar]
- 5.Legoff L, and Lecuit T (2015). Mechanical Forces and Growth in Animal Tissues. Cold Spring Harbor perspectives in biology 8, a019232. [DOI] [PMC free article] [PubMed] [Google Scholar]
- 6.Heisenberg CP, and Bellaiche Y (2013). Forces in tissue morphogenesis and patterning. Cell 153, 948–962. [DOI] [PubMed] [Google Scholar]
- 7.Li W, Kale A, and Baker NE (2009). Oriented cell division as a response to cell death and cell competition. Current biology 19, 1821–1826. [DOI] [PMC free article] [PubMed] [Google Scholar]
- 8.Yu JX, Guan Z, and Nash HA (2006). The mushroom body defect gene product is an essential component of the meiosis II spindle apparatus in Drosophila oocytes. Genetics 173, 243–253. [DOI] [PMC free article] [PubMed] [Google Scholar]
- 9.Lu MS, and Johnston CA (2013). Molecular pathways regulating mitotic spindle orientation in animal cells. Development 140, 1843–1856. [DOI] [PMC free article] [PubMed] [Google Scholar]
- 10.Dewey EB, Sanchez D, and Johnston CA (2015). Warts phosphorylates mud to promote pins-mediated mitotic spindle orientation in Drosophila, independent of Yorkie. Curr Biol 25, 2751–2762. [DOI] [PMC free article] [PubMed] [Google Scholar]
- 11.Bergstralh DT, Lovegrove HE, Kujawiak I, Dawney NS, Zhu J, Cooper S, Zhang R, and St Johnston D (2016). Pins is not required for spindle orientation in the Drosophilawing disc. Development 143, 135475–132581. [DOI] [PMC free article] [PubMed] [Google Scholar]
- 12.Bosveld F, Markova O, Guirao B, Martin C, Wang Z, Pierre A, Balakireva M, Gaugue I, Ainslie A, Christophorou N, et al. (2016). Epithelial tricellular junctions act as interphase cell shape sensors to orient mitosis. Nature 530, 495–498. [DOI] [PMC free article] [PubMed] [Google Scholar]
- 13.Karpova N, Bobinnec Y, Fouix S, Huitorel P, and Debec A (2006). Jupiter, a new Drosophila protein associated with microtubules. Cell Motil Cytoskeleton 63, 301–312. [DOI] [PubMed] [Google Scholar]
- 14.Dye NA, Popović M, Spannl S, Etournay R, Kainmüller D, Ghosh S, Myers EW, Jülicher F, and Eaton S (2017). Cell dynamics underlying oriented growth of the Drosophila wing imaginal disc. Development 144, 4406–4421. [DOI] [PubMed] [Google Scholar]
- 15.Aigouy B, Umetsu D, and Eaton S (2016). Segmentation and Quantitative Analysis of Epithelial Tissues. Methods in molecular biology (Clifton, N.J: 1478, 227–239. [DOI] [PubMed] [Google Scholar]
- 16.Kanca O, Caussinus E, Denes AS, Percival-Smith A, and Affolter M (2013). Raeppli: a whole-tissue labeling tool for live imaging of Drosophila development. Development 141, 472–480. [DOI] [PubMed] [Google Scholar]
- 17.Etournay R, Merkel M, Popović M, Brandl H, Dye NA, Aigouy B, Salbreux G, Eaton S, and Jülicher F (2016). TissueMiner: A multiscale analysis toolkit to quantify how cellular processes create tissue dynamics. Elife 5, e14334. [DOI] [PMC free article] [PubMed] [Google Scholar]
- 18.Etournay R, Popović M, Merkel M, Nandi A, Blasse C, Aigouy B, Brandl H, Myers G, Salbreux G, Jülicher F, et al. (2015). Interplay of cell dynamics and epithelial tension during morphogenesis of the Drosophila pupal wing. Elife 4, 20140443. [DOI] [PMC free article] [PubMed] [Google Scholar]
- 19.Mao Y, Tournier AL, Hoppe A, Kester L, Thompson BJ, and Tapon N (2013). Differential proliferation rates generate patterns of mechanical tension that orient tissue growth. The EMBO Journal [DOI] [PMC free article] [PubMed]
- 20.Wyatt TPJ, Harris AR, Lam M, Cheng Q, Bellis J, Dimitracopoulos A, Kabla AJ, Charras GT, and Baum B (2015). Emergence of homeostatic epithelial packing and stress dissipation through divisions oriented along the long cell axis. Proceedings of the National Academy of Sciences of the United States of America 112, 5726–5731. [DOI] [PMC free article] [PubMed] [Google Scholar]
- 21.Campinho P, Behrndt M, Ranft J, Risler T, Minc N, and Heisenberg C-P (2013). Tension-oriented cell divisions limit anisotropic tissue tension in epithelial spreading during zebrafish epiboly. Nature Cell Biology 15, 1405–1414. [DOI] [PubMed] [Google Scholar]
- 22.Aegerter-Wilmsen T, Smith AC, Christen AJ, Aegerter CM, Hafen E, and Basler K (2010). Exploring the effects of mechanical feedback on epithelial topology. Development 137, 499–506. [DOI] [PubMed] [Google Scholar]
- 23.Misra JR, and Irvine KD (2016). Vamana Couples Fat Signaling to the Hippo Pathway. Developmental Cell 39, 254–266. [DOI] [PMC free article] [PubMed] [Google Scholar]
- 24.Mao Y, Kucuk B, and Irvine KD (2009). Drosophila lowfat, a novel modulator of Fat signaling. Development 136, 3223–3233. [DOI] [PMC free article] [PubMed] [Google Scholar]
- 25.Matakatsu H, and Blair SS (2008). The DHHC palmitoyltransferase approximated regulates Fat signaling and Dachs localization and activity. Curr Biol 18, 1390–1395. [DOI] [PMC free article] [PubMed] [Google Scholar]
- 26.Mao Y, Rauskolb C, Cho E, Hu WL, Hayter H, Minihan G, Katz FN, and Irvine KD (2006). Dachs: an unconventional myosin that functions downstream of Fat to regulate growth, affinity and gene expression in Drosophila. Development 133, 2539–2551. [DOI] [PubMed] [Google Scholar]
- 27.Villano JL, and Katz FN (1995). four-jointed is required for intermediate growth in the proximal-distal axis in Drosophila. Development 121, 2767–2777. [DOI] [PubMed] [Google Scholar]
- 28.Clark HF, Brentrup D, Schneitz K, Bieber A, Goodman C, and Noll M (1995). Dachsous encodes a member of the cadherin superfamily that controls imaginal disc morphogenesis in Drosophila. Genes Dev 9, 1530–1542. [DOI] [PubMed] [Google Scholar]
- 29.Mahoney PA, Weber U, Onofrechuk P, Biessmann H, Bryant PJ, and Goodman CS (1991). The fat tumor suppressor gene in Drosophila encodes a novel member of the cadherin gene superfamily. Cell 67, 853–868. [DOI] [PubMed] [Google Scholar]
- 30.Bosveld F, Bonnet I, Guirao B, Tlili S, Wang Z, Petitalot A, Marchand R, Bardet PL, Marcq P, Graner F, et al. (2012). Mechanical Control of Morphogenesis by Fat/Dachsous/Four-Jointed Planar Cell Polarity Pathway. Science 336, 724–727. [DOI] [PubMed] [Google Scholar]
- 31.Bosveld F, Guirao B, Wang Z, Rivière M, Bonnet I, Graner F, and Bellaïche Y (2016). Modulation of junction tension by tumor suppressors and proto-oncogenes regulates cell-cell contacts. Development 143, 623–634. [DOI] [PubMed] [Google Scholar]
- 32.Venken KJ, Schulze KL, Haelterman NA, Pan H, He Y, Evans-Holm M, Carlson JW, Levis RW, Spradling AC, Hoskins RA, et al. (2011). MiMIC: a highly versatile transposon insertion resource for engineering Drosophila melanogaster genes. Nat Methods 8, 737–743. [DOI] [PMC free article] [PubMed] [Google Scholar]
- 33.Heemskerk I, and Streichan SJ (2015). Tissue cartography: compressing bio-image data by dimensional reduction. Nature Methods 12, 1139–1142. [DOI] [PMC free article] [PubMed] [Google Scholar]
- 34.Oda H, and Tsukita S (2001). Real-time imaging of cell-cell adherens junctions reveals that Drosophila mesoderm invagination begins with two phases of apical constriction of cells. Journal of Cell Science 114, 493–501. [DOI] [PubMed] [Google Scholar]
- 35.Rauskolb C, Pan G, Reddy BV, Oh H, and Irvine KD (2011). Zyxin links Fat signaling to the Hippo pathway. PLoS biology 9, e1000624. [DOI] [PMC free article] [PubMed] [Google Scholar]
- 36.Schindelin J, Arganda-Carreras I, Frise E, Kaynig V, Longair M, Pietzsch T, Preibisch S, Rueden C, Saalfeld S, Schmid B, et al. (2012). Fiji: an open-source platform for biological-image analysis. Nature Methods 9, 676–682. [DOI] [PMC free article] [PubMed] [Google Scholar]
- 37.Sommer C, Straehle C, Koethe U, and Hamprecht F (2011). ilastik: interactive learning and segmentation toolkit. In Proceedings of ISBI (Chicago, IL, USA: ). [Google Scholar]
- 38.R Core Team (2016). R: A Language and Environment for Statistical Computing (R Foundation for Statistical Computing), http://www.r-project.org/.
- 39.Aigouy B, Farhadifar R, Staple DB, Sagner A, Röper J-C, Jülicher F, and Eaton S (2010). Cell flow reorients the axis of planar polarity in the wing epithelium of Drosophila. Cell 142, 773–786. [DOI] [PubMed] [Google Scholar]
Associated Data
This section collects any data citations, data availability statements, or supplementary materials included in this article.
Supplementary Materials
Video S1 Wild type wing disc, related to Figure 1
Wild-type wing disc expressing E-cad:GFP and Jup:RFP cultured ex vivo for 12 h and imaged every 7 minutes.
Video S2 mud mutant wing disc, related to Figure 1
mud4 mutant wing disc expressing E-cad:GFP and Jup:RFP cultured ex vivo for 12 h and imaged every 6 minutes.
Video S3 T1 transition analysis in wild-type, related to Figure 3
T1 transitions detected in a segmented wild-type wing disc video.
Video S4 T1 transition analysis in mud mutant, related to Figure 3
T1 transitions detected in a segmented mud mutant wing disc video.