

Abstract
Context:
Cancer treatment symptoms play a major role in determining the health of children with cancer. Symptom toxicity often results in complications, treatment delays, and therapy dose reductions that can compromise leukemia therapy and jeopardize chances for long-term survival. Critical to understanding symptom experiences during treatment is the need for exploration of “why” inter-individual symptom differences occur; this will determine who may be most susceptible to treatment toxicities.
Objective
This study examined specific symptom trajectories during the first 18 months of childhood leukemia treatment. Symptom measures included fatigue, sleep disturbances, pain, nausea, and depression.
Methods
Symptom trajectories of 236 children with leukemia 3 to 18 years old were explored prospectively over four time periods: initiation of post-induction therapy, 4 and 8 post-induction therapy and the last time point was at the beginning of maintenance/continuation therapy. Latent class growth analysis was used to classify patients into distinctive groups with similar symptom trajectories based on patients’ response patterns on the symptom measures over time.
Results
Three latent classes of symptom trajectories were identified and classified into mild, moderate, and severe symptom trajectories. The only demographic characteristic with a significant relationship to membership in the latent class symptom trajectories was race/ethnicity. All other demographic characteristics including leukemia risk levels showed no significant relationships.
Conclusion
This study is unique in that groups of patients with similar symptoms were identified rather than groups of symptoms. Further research using latent class growth analysis is needed.
Keywords: Symptom trajectories, Childhood leukemia, Treatment toxicities, Leukemia therapy, Latent class growth analysis
Introduction
Throughout cancer treatment, children with leukemia experience multiple symptoms that rarely occur alone. Co-occurring symptoms can effect an individual’s well-being by increasing the intensity of existing symptoms and/or generating new symptoms.1 When two or more symptoms interact with each other to create an association distinct from other symptoms, it is labeled as a symptom cluster.2 While the understanding of symptom clusters is growing within the adult cancer literature, the recognition of symptom clusters among children with cancer is just emerging.3 Three research teams have identified a wide array of symptom clusters in children and adolescents undergoing treatment across a variety of types of pediatric cancers using a global symptom assessment tool.4–6 This broad assessment of symptoms is referred to as a de novo approach to symptom clustering and allows for identification of the number and type of symptom clusters using a comprehensive symptom assessment tool.7 However, when symptoms are known to be prevalent in a particular patient population, assessing specific symptoms can provide a deeper understanding of symptom clusters and is referred to as an a priori approach.7 Symptoms of fatigue, sleep disturbances, pain, nausea, and depression are known to commonly occur among children and adolescents undergoing cancer treatment.8,9 Recently researchers have identified specific symptom clusters with these prevalent symptoms including clusters of fatigue and depression among children; fatigue, depression, and sleep disturbances in adolescents; and nausea and sleep disturbances among children and adolescents.10,11
To advance the understanding of symptom clustering, additional analyses are needed to evaluate subgroups of patients with distinct outcomes or characteristics within the cluster.7 Using pediatric PROMIS measures, Buckner and colleagues12 reported children and adolescents with high severity profiles of anxiety, depression, fatigue, and pain experienced low functional outcomes within peer relationships, upper extremity physical functioning, and mobility. Hockenberry and colleagues11 noted a decrease in performance status among children and adolescents within the nausea and sleep disturbance symptom cluster. While these studies provide a foundational understanding of outcomes associated with symptom clusters, no studies have focused on one cancer diagnosis or evaluated demographic characteristics among children and adolescents within distinct symptom clusters. Determining individual characteristics of patients including those patients with high and low levels of symptom severity within the cluster is especially important for a comprehensive understanding of the cluster.
Most pediatric oncology studies on symptom clusters and profiles employ cross-sectional designs.5,13,14 However, symptoms are dynamic and change over time; thus, longitudinal studies are needed to evaluate symptom profiles.7 Conventional growth curve analysis using multilevel modeling or structural equation modeling can be used for this purpose, but these approaches only estimate a single trajectory that averages the individual trajectories for all participants in a given sample. Cancer treatment symptoms may follow a multinomial pattern in which symptom severity varies between/among groups of patients. Describing an entire population using a single growth trajectory is oversimplifying the complex growth patterns of change. For understanding inter-individual differences in patterns of change, alternative modelling strategies are available that consider multinomial heterogeneity in change. One such approach is a group‐based technique known as latent class growth analysis (LCGA).15–18 LCGA models provide such heterogeneity by classifying individuals into groups with similar trajectories or patterns of change in an outcome across multiple time points, called latent classes. The unique aspect of latent class growth analysis is that subjects are grouped based on similar symptom experiences and researchers can follow the subjects’ symptom trajectories over time.
This study used LCGA to examine symptom trajectories for groups of children experiencing cancer treatment symptoms over time. Data from a multisite study that explored symptom characteristics in children experiencing fatigue, sleep disturbances, pain, nausea, and depression during four phases of acute lymphocytic leukemia treatment were used for the LCGA analyses. Relationships of demographic characteristics (age, sex, and race/ethnicity) and leukemia risk levels (low, average/standard, high, and very high risk) were also examined with the membership of the latent classes of symptom trajectories.
Conceptual Framework
The conceptual framework is illustrated in Figure 1. Children and adolescents diagnosed with leukemia are known to experience symptoms of fatigue, sleep disturbances, pain, nausea, and depression during their trajectory of treatment. However, the unique characteristics of the individual at the onset of the leukemia diagnosis, including the leukemia risk level and demographic characteristics, may influence the severity of symptoms over time, thus leading to different symptom profiles.
Figure 1.

Conceptual Framework
Methods
Design
A repeated-measures research design was used to evaluate treatment-related symptom associations experienced by 236 children and adolescents 3 to 18 years of age receiving leukemia treatment. Symptom trajectories were explored over four time periods: initiation of post-induction therapy, 4 and 8 post-induction therapy and the last time point was at the beginning of maintenance/continuation therapy. Symptom measures included fatigue, sleep disturbances, pain, nausea, and depression.
Settings and Sample
The settings for this study include four major childhood cancer treatment centers in the United States. When combined, the four centers diagnose approximately 250 children and adolescents with leukemia who meet the study eligibility criteria each year. Children with a cognitive disability identified pre-leukemia diagnosis were ineligible for study enrollment.
The initial sample consisted of 241 patients who had information on both sociodemographic variables and symptom measures. Five participants (2.1%) did not provide information on leukemia risk levels. The missing data were missing completely at random (MCAR)19 and, thus, were excluded from the analyses. Such exclusion under MCAR had no negative impact on parameter estimation.20 As for intermittently longitudinal missing values on the five symptom measures across the four time points, they were also MCAR. Such longitudinal missing values were automatically handled by maximum likelihood in SAS Proc Traj16–17 for LCGA and no further missing data treatment was necessary. This resulted in a final sample size of 236.
Leukemia Treatment
All participants were treated on an acute lymphoblastic leukemia protocol. Induction therapy (1 month) included weekly treatment with vincristine and daunomycin (for high-risk ALL), a corticosteroid and a dose of Peg-asparaginase, and two IT MTX treatments (Days 1 and 29). Postinduction therapy (6–8 months) involved several courses of treatment that included asparaginase, high- or intermediate-dose IV MTX (depending on ALL protocol assignment), vincristine, doxorubicin, corticosteroid, cytarabine, and mercaptopurine. During postinduction IT MTX was given on Day 1 of each 12-week cycle. Throughout therapy, study participants receive CNS prophylaxis with standardized doses of IT MTX based on age. All participants were treated on a lymphoblastic leukemia protocol. Induction therapy (1 month) included weekly treatment with vincristine and daunomycin (for high-risk ALL), a corticosteroid and a dose of Peg-asparaginase, and two IT MTX treatments (Days 1 and 29). Postinduction therapy (6–8 months) involved several courses of treatment that included asparaginase, high- or intermediate-dose IV MTX (depending on ALL protocol assignment), vincristine, doxorubicin, corticosteroid, cytarabine, and mercaptopurine. During postinduction IT MTX was given on Day 1 of each 12-week cycle. Throughout therapy, study participants received CNS prophylaxis with standardized doses of IT MTX based on age. Maintenance/continuation therapy with the final study measurement, began 6 to 8 months after the end of induction therapy. Time intervals for each phase of treatment were influenced by participants side effects and recovery from low blood counts.
Data Collection
Consent was obtained from a parent or legal guardian. Children and adolescents provided assent. Symptom assessments were obtained using standardized instruments and occurred during a routine follow-up clinic visit; time points were chosen to evaluate the most intensive phase of therapy post-induction. For consistency across symptoms, parent proxy was used for the 3–6-year-old age group and symptom self-report for children ≥ 7 years of age. All symptoms were reported over the past 2–4 weeks. English and Spanish speaking children were included in the study. Instruments were translated into Spanish versions to prevent language barriers. This study used an innovative approach to symptom assessment by measuring each symptom using a separate reliable and validated instrument (see Table 1) with a tablet PC (iPad). English and Spanish versions of the instruments were used on the tablet PC. Data collection required less than 25 minutes to complete at each time point. For each symptom scale, a higher score indicates greater symptom severity. Scores were used to determine symptom severity and classify them into different symptom profiles labeled as mild, moderate and severe.
Table 1.
Self-Report Study Measurements
| Symptom Measuresa | Time to Completeb | Instrument Description | Score Used in Data Analysis |
|---|---|---|---|
| Fatigue Child Fatigue Scale (CFS)c, Adolescent Fatigue Scale (FSA)d Parent Fatigue Scale (PFS)e |
< 5 min | CFS-10-item questionnaire assessing the experience of fatigue-related symptoms for ages 7–12X
FSA-13-item self-report scale developed to measure fatigue for ages 13–18X PFS-17-item scale assessing parent perception of fatigue experienced for ages 3–6 X |
T-score of total score with a range of 20–80. |
| Sleep Disturbance Adolescent Sleep Wake Scale (ASWS)f Child Sleep Wake Scale (CSWC)g |
< 5 min | ASWS- 28-item questionnaire for ages 13 to 17 X CSWC- 40-item questionnaire for ages 3 to 12 completed by a parent Both instruments include 5 sub-scales including going to bed, falling asleep, maintaining sleep, going back to sleep and returning to wakefulness |
Average score across subscales ranging from 1 (good quality sleep) - 6 (bad quality sleep). For this study, scores were reversed in order to have same direction as other symptom measures. |
| Pain Wong-Baker Faces Scaleh |
< 1min | 6-point visual analogue scale (0, 2, 4, 6, 8, 10) to rate severity of pain | Raw score ranging from 0 (no hurt) – 10 (hurts worst) |
| Nausea Visual Analog Scale (VAS)i,j |
< 1 min | 0–100 VAS scale to rate severity of nausea | Raw score ranging from 0–100 (severe nausea). |
| Depression Child Depression Inventory (CDI-2)k |
< 10 min | 27-item instrument completed by children ages < 7 and by a parent for children for ages 3–6. Possible responses are scored 0 (absence of the symptom), 1 (mild symptom), or 2 (definite symptom), with a score of ≥ 16 defining depression. | T-score of total score with a range of 20–80. |
Measured at 4 time points: Start of post-induction, 4, 8 and 12 months into post-induction therapy.
Total time is < 25 min.
Hinds PS, Yang J, Gattuso JS, et al. Psychometric and clinical assessment of the 10-item reduced version of the Fatigue Scale—Child instrument. J Pain Symptom Manage 2010;39:572–578.
Mandrell B, Yang J, Hooke MC, et al. Psychometric and clinical assessment of the 13-item reduced version of the Fatigue Scale-Adolescent instrument. J Pediatr Oncol Nurs 2010;28:287–294.
Hockenberry M, Hinds PS, Barrera P, et al. Three instruments to assess fatigue in children with cancer: the child, parent and staff perspectives. J Pain Symptom Manage 2003; 25:319–328.
LeBourgeois MK, Giannotti F, Cortesi F, Wolfson A, Harsh J. The relationship between reported sleep quality and sleep hygiene in Italian and American adolescents. Pediatr 2005;115:S257-S265.
LeBourgeois M, Harsh JR. A new research measure for children’s sleep. Sleep 2001;24:A213-A214.
Wong D, Baker,C. Pain in children: comparison of assessment scales. Pediatr Nurs 1988;14:9–17.
Scott J, Huskisson EC. Vertical or horizontal visual analogue scales. Ann Rheum Dis 1979;38:560.
Revill SI, Robinson JO, Rosen M, Hogg MI. The reliability of a linear analogue for evaluating pain. Anaesthesia 1976;31:1191–1198.
Kovacs M. Children’s Depression Inventory 2™ (CDI 2). San Antonio, TX:Pearson, 2010.
Data analysis
Descriptive statistics were computed to describe the sample characteristics (Table 2) and the five symptom measures over time (Table 3).
Table 2.
Sample Characteristics (N = 236)
| Characteristic | Frequency (n) | Percent (%) | |
|---|---|---|---|
| Age Group | Adolescent (13 – 18 Years) | 46 | 19.5 |
| Child (7 – 12 Years) | 77 | 32.6 | |
| Young Child (3 – 6 years) | 113 | 47.9 | |
| Sex | Female | 107 | 45.3 |
| Male | 129 | 54.7 | |
| Race/Ethnicity | Hispanic | 108 | 45.8 |
| Non-Hispanic White | 90 | 38.1 | |
| Non-Hispanic Black | 19 | 8.1 | |
| Non-Hispanic Other | 19 | 8.1 | |
| Leukemia Risk | Low | 26 | 11.0 |
| Average/Standard | 83 | 35.2 | |
| High | 48 | 20.3 | |
| Very High | 79 | 33.5 | |
Table 3.
Means (Ms) and Standard Deviations (SDs) of the Five Symptoms by Time
| Symptom | Time 1 | Time 2 | Time 3 | Time 4 | ||||||||
|---|---|---|---|---|---|---|---|---|---|---|---|---|
| n | M | SD | n | M | SD | n | M | SD | n | M | SD | |
| Fatiguea | 212 | 54.08 | 9.97 | 211 | 49.93 | 10.54 | 178 | 48.20 | 8.97 | 160 | 46.47 | 8.31 |
| Sleep Disturbanceb | 210 | 2.69 | 0.73 | 207 | 2.71 | 0.78 | 178 | 2.77 | 0.77 | 161 | 2.69 | 0.76 |
| Pain | 210 | 2.64 | 2.33 | 207 | 1.71 | 2.23 | 177 | 1.37 | 1.69 | 161 | 1.28 | 1.77 |
| Nausea | 211 | 14.33 | 21.62 | 206 | 14.54 | 22.05 | 175 | 15.30 | 21.78 | 162 | 11.70 | 18.96 |
| Depressiona | 210 | 51.87 | 9.78 | 210 | 50.85 | 10.54 | 174 | 49.33 | 10.16 | 161 | 47.40 | 8.52 |
T-score.
Reverse score.
Fatigue and Depression were analyzed on their T-scores with a range of 20–80.
Pain: Raw scores ranging from 0 (no hurt) – 10 (hurts worst)
Nausea: Raw scores ranging from 0–100 (severe nausea)
Sleep Disturbance: Reversed average score ranging from 1 (good quality sleep) - 6 (bad quality sleep)
To identify latent classes of symptom trajectories over time, latent class growth analysis with growth mixture modeling (i.e. group-based trajectory modeling) was conducted using SAS Proc Traj.16,17 Such statistical techniques can help distinquish distinct groups of participants following similar trajectories of change over time on a variable of interest. In this study, further analysis of all the five symptoms simultaneously using multitrajectory modeling17 were examined to identify linkages between the trajectories of the five symptoms measured by standardized instruments described in Table 1. Thus, each trajectory class was defined not by one symptom but by the five symptoms at the same time. Four of the five symptoms (fatigue, sleep disturbances, nausea, and depression) were continuous with approximately normally distributions and, thus, modeled using the censored normal (CNORM) model in SAS Proc Traj; whereas pain was modeled using the zero-inflated Poisson (ZIP) model because pain had only six discrete values (0, 2, 4, 6, 8, 10) with a severely positively skewed distribution. When comparing model fit to determine the number of distinct latent classes of symptom trajectories over time, a small change in Bayesian information criterion (BIC)21 as well as minimum-overlapping 95% confidence intervals (CIs) of trajectories17 were considered.
Further, to examine the relationships of demographic characteristics and leukemia risk levels with the membership of the classes of symptom trajectories, ordinal logistic regression of latent classes of symptom trajectories on demographic characteristics and leukemia risk levels was conducted using SAS Proc Logistic.22 Odds ratios with their 95%CIs of being more severe class of symptom trajectories were estimated from the ordinal logistic regression.
RESULTS
Descriptive statistics
Table 2 shows that among 236 participants in the final sample, the age group was not equally distributed with 47.9%, 32.6%, and 19.5% for young children, children, and adolescents, respectively. Sex was fairly balanced with only a few more boys than girls (54.7% vs. 45.3%); whereas race/ethnicity was unbalanced with almost half (45.8%) being Hispanic, 38.1% being non-Hispanic white, and much fewer being non-Hispanic black or non-Hispanic others both with 8.1%. As for leukemia risk levels, 33.5% of the children in the study sample were at very high risk, 20.3% at high risk, 35.2% at average or standard risk, and 11.0% at low risk. The means and standard deviations of the five symptom measures across the four treatment time points (Table 3) demonstrate that fatigue, pain, and depression decreased over time; whereas sleep disturbances and nausea increased in the early treatment phrases before they decreased at the later time points.
Latent classes of symptom trajectories
Three latent classes of symptom trajectories were identified with 36.6% of the patients (Group 1, n1 = 84) classified into the mild symptom trajectory, 52.2% (Group 2, n2 = 127) into the moderate symptom trajectory, and 11.1% (Group 3, n3 = 25) into the severe symptom trajectory. Patterns of the trajectories of each individual symptom as well as the variability (i.e., 95%CIs) of the symptom trajectories within each class group is shown in Figure 2. The three-class solution (mild, moderate, severe) became evident as the best model after exploring models with alternate numbers of classes (2 and 4). The difference in model fit between the three-class solution and a two-class solution (ΔBIC = 85.64) was much larger than that between a four-class solution and the three-class solution (ΔBIC = 9.77). The three-class solution also produced more distinct 95%CIs (dashed lines in Figure 2) for the symptom trajectories than those of a four-class solution.
Figure 2.

Latent classes of symptom trajectories with 95% CIs (dashed lines) by symptom measures. Patients (group 1, n1 = 84, 36.6%) experiencing mild symptoms. Patients (group 2, n2 = 127, 52.2%) experiencing moderate symptoms. Patients (group 3, n3 = 25, 11.1%) experiencing severe symptoms.
It is worth noting that although the latent classes of symptom trajectories are displayed separately for each symptom (Figure 2), these symptom trajectories were determined by multitrajectory modeling in LCGA for all the five symptoms simultaneously. That is why the same distribution of patients across the three symptom severity groups was found (36.6%, 52.2%, and 11.1%) for all the five symptoms. By examining the symptom trajectories in Figure 2, the majority of patients (Group 2, 52.2%) experienced moderate symptoms across all five measures with a significant decrease in fatigue (p < .031); a marginal increase in sleep disturbances (p = .071); a significant decrease in pain (p < .029); and a rate of decrease marginally faster at later time points in depression (p = .063). More than one third of patients (Group 1, 36.6%) experienced mild symptoms across all five measures with a significant decrease (p < .001) and a rate of decrease signiticantly slower at later time points (p < .004) in fatigue; a significant decrease (p < .001) with a rate of decrease significantly slower at later time points (p < .001) in pain; and a significant decrease (p < .026) with a rate of decrease marginally slower at later time points (p = .074) in depression. The remaining patients (Group 3, 11.1%) experienced severe symptoms across all five measures whose trends were not statistically significant due to the small sample (n3 = 25) in this group although there was an observed decrease in fatigue, pain, and depression over time.
Relationships of demographic characteristics and leukemia risk levels with the symptom trajectories
Ordinal logistic regression of three latent classes of symptom trajectories on demographic characteristics and leukemia risk levels was conducted. The parameter estimates are listed in Table 4; and odds ratios with their 95%CIs of experiencing severer symptoms are also displayed in Figure 3. The odds ratios demonstrate that only Hispanic participants, compared with non-Hispanic other participants that included five (26.3%) American Indian/Alaska Native decent, ten (52.6%) Asian Americans, one participant (5.3%) who identified with more than one race and three participants (15.8%) who did not report race, had a 95%CI not containing an odds ratio of 1. This finding suggests that Hispanic participants were significantly less likely to experience more severe symptoms over time than non-Hispanic other participants (p < .014), whereas all other demographic characteristics including leukemia risk levels had no significant relationships with membership in the latent classes of symptom trajectories.
Table 4.
Parameter Estimates and Odds Ratios from Ordinal Logistic Regression
| Parameter/Effect | β | SE | p | Odds Ratio | 95%CI of Odds Ratio | |
|---|---|---|---|---|---|---|
| Lower | Upper | |||||
| Adolescent vs. Young Child | −0.43 | 0.40 | .277 | 0.65 | 0.30 | 1.41 |
| Child vs. Young Child | −0.29 | 0.40 | .476 | 0.75 | 0.34 | 1.65 |
| Female vs. Male | 0.18 | 0.26 | .490 | 1.20 | 0.72 | 2.00 |
| Non-Hispanic White vs. Hispanic | 0.45 | 0.29 | .121 | 1.57 | 0.89 | 2.76 |
| Non-Hispanic Black vs. Hispanic | 0.25 | 0.50 | .609 | 1.29 | 0.49 | 3.41 |
| Non-Hispanic Other vs. Hispanic | 1.26 | 0.51 | .014 | 3.52 | 1.29 | 9.60 |
| Low Leukemia Risk vs. Very High Leukemia Risk | 0.01 | 0.50 | .981 | 1.01 | 0.38 | 2.70 |
| Average Leukemia Risk vs. Very High Leukemia Risk | 0.47 | 0.35 | .182 | 1.60 | 0.80 | 3.18 |
| High Leukemia Risk vs. Very High Leukemia Risk | −0.28 | 0.39 | .468 | 0.76 | 0.36 | 1.61 |
Figure 3.
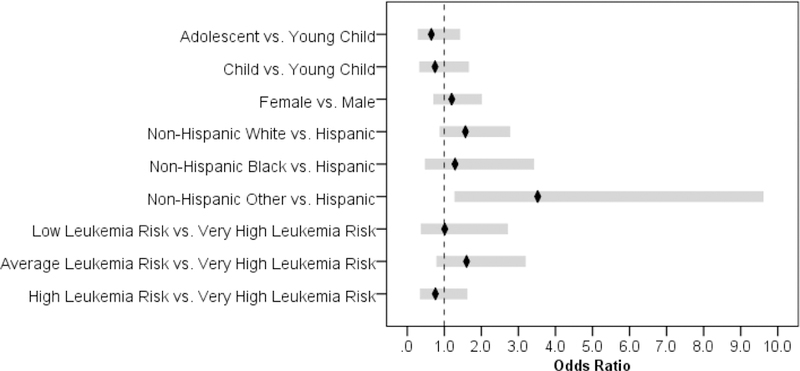
Odds Ratios with 95%CIs of Experiencing More Severe Symptoms by Demographic Characteristics and Leukemia Risk Levels
Summary
This study used LCGA with multitrajectory modeling to determine subgroups of participants who follow distinct trajectories of change in all symptoms at the same time, as opposed to the conventional growth curve analysis that only estimates a single trajectory averaging growth parameters across all participants in the sample. This innovative method to evaluate symptom classes and trajectories during childhood leukemia treatment is extremely useful for identifying homogeneous subpopulations within a larger heterogeneous population. It allows researchers to identify meaningful groups of children experiencing similar symptoms during leukemia treatment. This study is unique in that most cancer symptom clustering studies focus on identifying groups of symptoms rather than groups of patients with similar symptoms experiences over time. In this study an LCGA approach provides an opportunity to evaluate symptom trajectories of classes of patients following similar trends over time.
In this study, all five symptom measures were analyzed simultaneously to examine linkages between the trajectories of the five symptom measures in subpopulations of children with leukemia. This led to three latent class sub-groups: 36% were recognized as members of the mild symptom sub-group (Group 1), 52% were in the moderate symptom sub-group (Group 2), and 11% were in the severe symptom sub-group (Group 3). Unique characteristics of each symptom demonstrate trajectory patterns for the five symptoms. Sleep disturbance and nausea are noted to have limited change over time; whereas fatigue, pain, and depression decreased over the four time periods. However, none of the symptoms completely resolved over time. While this is the first study to evaluate long-term symptom experiences in children with leukemia, it is evident that disease burden improves during leukemia treatment but symptoms related to treatment continue. Sleep disturbances and nausea behaved similarly or clustered together; these findings are similar to previous work evaluating fatigue, nausea, depression, and performance status in 67 children receiving chemotherapy.10 Fatigue, pain, and depression clustered together in this current study of children with leukemia as well in this previous study of children with a variety of cancer diagnoses.
Leukemia risk level had no impact on the severity of symptom classes. This is a unique finding that was discovered using LCGA and warrants further exploration. Age and sex also had no significant impact on the child’s symptom severity experiences. The largest race/ethnic group in this study was Hispanic which was indicative of the population at two of the study sites. The only variable influencing symptom severity was race/ethnicity; Non-Hispanic other participants consistently experienced more severe symptoms over time than all other race/ethnic groups (Hispanic, non-Hispanic black, and non-Hispanic white). No previous study has identified differences in symptom profiles among distinct ethnicities.8,23 A recent study of 160 children undergoing treatment for acute lymphoblastic leukemia found no difference in the symptoms of pain, nausea, and anxiety among Hispanic versus non-Hispanic groups;24 however, only a few symptoms were evaluated in this study. Future research is needed to explore the impact of ethnicity on symptom classes and trajectories over time.
Results of this study support future development of phenotypic profiles of symptom experiences during childhood leukemia treatment. This work can promote more accurate assessment of symptom classes in the future. As more children survive leukemia the importance of promoting cure while minimizing toxicity becomes even more important.
Acknowledgments
Disclosures
This was supported by a National Institutes of Health RO1 CA 1693398.
Contributor Information
Marilyn J Hockenberry, Duke University School of Nursing, Durham, NC.
Mary C Hooke, University of Minnesota School of Nursing, Minneapolis, MN.
Cheryl Rodgers, Duke University School of Nursing, Durham, NC.
Olga Taylor, Texas Children’s Cancer and Hematology Centers/Baylor College of Medicine, Houston, TX.
Kari M Koerner, University of Arizona College of Nursing, Tucson, AZ.
Pauline MItby, Children’s Minnesota, Minneapolis, Minnesota, USA.
Ida Moore, University of Arizona College of Nursing, Tucson, AZ.
Michael E. Scheurer, Texas Children’s Cancer and Hematology Centers/Baylor College of Medicine, Houston, TX.
Wei Pan, Duke University School of Nursing, Durham, NC.
References
- 1.Aktas A Cancer symptom clusters: current concepts and controversies. Curr Opin Support Palliative Care 2013;7:38–44. [DOI] [PubMed] [Google Scholar]
- 2.Barsevick A Defining the symptom cluster: How far have we come? Semin Oncol Nurs 2016;32:344–350. [DOI] [PubMed] [Google Scholar]
- 3.Rodgers C, Hooke MC, Ward J, Linder L. Symptom clusters in children and adolescents with cancer. Semin Oncol Nurs 2016;32:394–404. [DOI] [PubMed] [Google Scholar]
- 4.Yeh C, Chiang Y, Chien L, Lin L, Yang C, Chaung H. Symptom clustering in older Taiwanese children with cancer. Oncol Nurs Forum 2008;35:273–281. [DOI] [PubMed] [Google Scholar]
- 5.Baggott C, Cooper BA, Marina N, Mathay KK, Miaskowski C. Symptom cluster analyses based on symptom occurrence and severity ratings among pediatric oncology patients during myelosuppressive chemotherapy. Cancer Nurs 2012;35:19–28. [DOI] [PMC free article] [PubMed] [Google Scholar]
- 6.Atay S, Conk Z, Bahar Z. Identifying symptom clusters in paediatric cancer patients using the Memorial Symptom Assessment Scale. Eur J Cancer Nurs 2012;21:460–468. [DOI] [PubMed] [Google Scholar]
- 7.Miaskowski C Future directions in symptom cluster research. Semin Oncol Nurs 2016;32:405–415. [DOI] [PubMed] [Google Scholar]
- 8.Baggott C, Dodd M, Kennedy C, Marina N, Miaskowski C. Multiple symptoms in pediatric oncology patients: A systematic review. J Pediatr Oncol Nurs 2009;26:325–339. [DOI] [PubMed] [Google Scholar]
- 9.Rodgers CC, Hooke MC, Hockenberry MJ. Symptom clusters in children. Curr Opin Support Palliat Care 2013;7:67–72. [DOI] [PubMed] [Google Scholar]
- 10.Hockenberry MJ, Hooke MC, Gregurich M, et al. Symptom clusters in children and adolescents receiving cisplatin, doxorubicin, or ifosfamide. Oncol Nurs Forum 2010;37:E16–E27. [DOI] [PubMed] [Google Scholar]
- 11.Hockenberry MJ, Hooke MC, McCarthy K, Gregurich MA. Sickness behavior clustering in children with cancer. J Pediatr Oncol Nurs 2011;28:263–272. [DOI] [PubMed] [Google Scholar]
- 12.Buckner TW, Wang J, DeWalt DA, et al. Patterns of symptoms and functional impairments in children with cancer. Pediatr Blood Cancer 2014;61:1282–1288. [DOI] [PMC free article] [PubMed] [Google Scholar]
- 13.Macartney G, VanDenKerkhof E, Harrison MB, Stacey D. Symptom experience and quality of life in pediatric brain tumor survivors: a cross-sectional study. J Pain Symptom Manage 2014;48:957–967. [DOI] [PubMed] [Google Scholar]
- 14.Williams PD, Robinson J, Williams AR. Symptom occurrence and severity on the therapy-related symptom checklist for children among Hispanic pediatric oncology outpatients. Cancer Nurs 2014;37:E12–20. [DOI] [PubMed] [Google Scholar]
- 15.Berlin KS, Parra GR, Williams NA. An introduction to latent variable mixture modeling (Part 2): longitudinal latent class growth analysis and growth mixture models. J Pediatr Psychology 2014;39:188–203. [DOI] [PubMed] [Google Scholar]
- 16.Jones BL, Nagin DS, Roeder K. A SAS procedure based on mixture models for estimating developmental trajectories. Sociol Method Res 2001;29:374–393. [Google Scholar]
- 17.Jones BL, Nagin DS. Advances in group-based trajectory modeling and a sas procedure for estimating them. Sociol Method Res 2007;35:542–571. [Google Scholar]
- 18.Jung T, Wickrama KAS. An introduction to latent class growth analysis and growth mixture modeling. Social and Personality Psychology Compass 2008;2:302–317. [Google Scholar]
- 19.Little RJA. A test of missing completely at random for multivariate data with missing values. Journal of the American Statistical Association 1988;83:1198–1202. [Google Scholar]
- 20.Little RJA, Rubin DB. Statistical analysis with missing data New York, NY: Wiley, 2002. [Google Scholar]
- 21.Schwartz G Estimating the dimension of a model. The Annals of Statistics 1978;6:461–464. [Google Scholar]
- 22.SAS Institute Inc. SAS/STAT 9.3 user’s guide Cary, NC: SAS Institute Inc, 2011. [Google Scholar]
- 23.Kestler SA, LoBiondo-Wood G. Review of symptom experiences in children and adolescents with cancer. Cancer Nurs 2012;35:E31–49. [DOI] [PubMed] [Google Scholar]
- 24.Dupuis LL, Lu X, Mitchell H, et al. Anxiety, pain, and nausea during the treatment of standard-risk childhood acute lymphoblastic leukemia: A prospective, longitudinal study from the Children’s Oncology Group. Cancer 2016;122:1116–1125. [DOI] [PMC free article] [PubMed] [Google Scholar]