

SUMMARY
Active defense against a conspecific aggressor is essential for survival. Previous studies revealed strong c-Fos expression in the ventrolateral part of the ventromedial hypothalamus (VMHvl) in defeated animals. Here, we examined the functional relevance and in vivo responses of the VMHvl during conspecific defense. We found that VMHvl cells expressing estrogen receptor α (Esr1) are acutely excited during active conspecific defense. Optogenetic inhibition of the cells compromised an animal’s ability to actively defend against an aggressor, whereas activating the cells elicited defense-like behaviors. Furthermore, the VMHvl is known for its role in aggression. In vivo recording and c-Fos mapping revealed differential organization of the defense and aggression-responsive cells in the VMHvl. Specifically, defense-activated cells are concentrated in the anterior part of the VMHvl, which preferentially targets the periaqueductal gray (PAG). Thus, our study identified an essential neural substrate for active conspecific defense and expanded the function of the VMHvl.
Graphical Abstract

In Brief
Active defense against conspecific aggressors is essential for survival, but its underlying neural substrates remain largely unknown. Through a series of in vivo recordings and functional manipulations, Wang et al. demonstrate that cells expressing estrogen receptor α in a small medial hypothalamic nucleus are essential for defense against a bully.
INTRODUCTION
Animals have evolved a set of genetically hardwired behavioral and physiological responses to threats. Depending on the species, the threat can originate from a predator of a different species, members of the same species (conspecifics), or both. For modern humans, the main threats arise from individuals of our own species; thus, defense against conspecifics is particularly important. Whether one is in a war zone, an active shooting, or an unfamiliar neighborhood late at night, self-defense is essential to ensure one’s safety. In rodents, conspecific defense is commonly observed when two animals compete for limited resources or to establish dominance. After several rounds of confrontations, one animal starts to initiate most of the attacks, whereas the other animal mainly displays defensive behaviors to evade these attacks (Blanchard et al., 1979; Takahashi and Blanchard, 1982).
Several studies have characterized rodent conspecific defense in details, using various terms to describe defensive behavior, such as upright posture, boxing, keep off, dash, flight, escape, jump, immobilize, freeze, defensive sideways, lying-on-the-back posture, and vocalization (Blanchard and Blanchard, 1989; Depaulis and Vergnes, 1985; Takahashi and Blanchard, 1982). These diverse terms reveal a rich behavioral repertoire of conspecific defense. Motta et al. (2009) proposed to divide conspecific defense into two simple categories: active defense and passive defense. Active defense occurs when the animal is under attack and includes actions that aim to terminate attacks, such as dashing away from the aggressor or assuming an upright posture while pushing the aggressor (Motta et al., 2009). In contrast, passive defense occurs after the end of the attack and includes actions with little movement, such as freezing or sustaining an on-the-back posture, possibly to minimize provocation of the aggressor (Motta et al., 2009).
The neural substrates underlying these conspecific defensive behaviors remain poorly understood. Previous immediate-early gene mapping studies in rodents have revealed strong activation of several medial hypothalamic regions after the test animal was exposed to a dominant conspecific male. These regions include the anterodorsal preoptic nucleus (ADP), medial preoptic area, paraventricular nucleus of hypothalamus (PVN), dorsomedial hypothalamic nucleus (DMH), ventrolateral part of ventromedial hypothalamus (VMHvl), and dorsal part of the premammillary nucleus (PMd) (Kollack-Walker et al., 1997; Motta et al., 2009; Pan et al., 2010). Among these regions, the function of the PMd in conspecific defense in rats was investigated in detail. Animals in which the PMd was lesioned failed to freeze or assume an on-the-back posture after being attacked, but their active defense mechanisms were unaffected (Motta et al., 2009). Consequently, PMd appears to be a critical region for passive defense, but not active defense.
What is the neural substrate essential for active defense? Among the regions that express high levels of c-Fos after social defeat, we consider the VMHvl as a potential candidate. Our previous studies, as well as other studies, found that the VMHvl is an essential region for generating aggressive behaviors in both male and female mice (Falkner et al., 2014, 2016; Hashikawa et al., 2017; Lee et al., 2014; Lin et al., 2011; Siegel et al., 1999; Yang et al., 2013, 2017). Optogenetic activation of the VMHvl elicits immediate attacks, whereas optogenetic or pharmacological inhibition of the VMHvl decreases aggressive behaviors (Lee et al., 2014; Lin et al., 2011). Thus, the VMHvl plays a role in controlling and initiating intensive motor actions toward social targets. Although attack and active defense differ in their motor patterns, both involve a heightened arousal state, incorporate fast and strenuous actions, and aim toward similar social targets; therefore, they may involve overlapping neural substrates.
Here, we test the relevance of the VMHvl in conspecific defense by performing in vivo recording of VMHvl neurons during encounters with a conspecific aggressor and functionally manipulating the VMHvl cells in defending animals. Our results support an important role of the VMHvl, especially its anterior subdivision, in active defense against conspecific aggressors.
RESULTS
Enrichment of c-Fos Expression in VMHvl Esr1+ Neurons after Social Defense
We first confirmed the immediate-early gene expression in the VMHvl in male mice after they were defeated. A highly aggressive C57BL/6 or Swiss Webster (SW) male intruder was introduced into the home cage of a single-housed C57BL/6 male test mouse for 10 min, and the c-Fos expression pattern was examined 90 min later. By testing the defending mouse in its home cage, we ensured that the induced c-Fos was not due to handling or exposure to the aggressor’s territory. During the 10 min interaction, the introduced aggressor initiated multiple attacks (mean ± SD: 17.5 ± 7.8 episodes/10 min) against the resident mouse and the resident mouse showed clear active defense, such as dashing and upright postures, and passive defense, such as freezing in a corner after being attacked. Consistent with previous reports, we found significantly increased c-Fos in the VMHvl in defeated animals in comparison to control animals that were not exposed to an intruder (Figure 1A; Figure S1). In addition, we noticed that the defeat-induced c-Fos+ cells are more abundant in the anterior portion of the VMHvl (Bregma: −1.4 to −1.5 mm) than the posterior VMHvl (pVMHvl) (Bregma: −1.6 to −1.9 mm) (Figure 1A). In a separate group of mice, we examined c-Fos expression after the resident mouse attacked a non-aggressive C57BL/6 or BALB/c male intruder (mean ± SD: 16.4 ± 5.4 episodes/10 min) and found that the aggression-induced c-Fos showed no spatial bias along the anterior-posterior axis of the VMHvl (Figure 1A). When comparing the aggression-induced and defeat-induced c-Fos, we found that the aVMHvl expressed more c-Fos after defeat than after aggression, while a comparable number of c-Fos+ cells are observed in the pVMHvl after these two behaviors (Figures 1B and 1C). The c-Fos expression patterns induced by different strains of non-aggressive intruders or aggressive intruders are similar, suggesting that the c-Fos expression is mainly determined by the behavior of the test animals instead of the type of intruder.
Figure 1. The Anterior VMHvl Expresses a High Level of c-Fos after Social Defeat.

(A) From top to bottom showing the representative images and number of c-Fos-expressing cells in the VMHvl of C57BL/6 male mice after no social interaction, attacking a BALB/c male intruder, attacking a non-aggressive C57BL/6 male intruder, being defeated by an aggressive C57BL/6 intruder, and being defeated by a SW intruder. Left column shows test conditions. Middle panels show c-Fos expression in the VMHvl (bregma: −1.4 to −1.9 mm) from representative animals. Right panels show the average number of c-Fos+ cells per 50 μM section in the VMHvl (bregma: −1.4 to −1.9 mm) after various test conditions. One-way ANOVA with repeated measures followed by pairwise comparison with Bonferroni correction: F(5, 30) = 0.478, p = 0.78923, n = 4–6 animals for each group. Scale bar: 100 μM.
(B) Comparison of the number of c-Fos+ cells across test conditions in the sections from anterior VMHvl (bregma: −1.4 mm to −1.5 mm).
(C) Comparison of the number of c-Fos+ cells across test conditions in the sections from the posterior VMHvl (bregma: −1.6 mm to −1.9 mm). One-way ANOVA followed by pairwise comparison with Tukey HSD correction.
(D) Image showing the expression of defeat-induced c-Fos (green), Esr1 (magenta) and their overlay in the aVMHvl. Bottom: enlarged view of the boxed area. Top and bottom scale bars: 100 and 50 μM.
(E) Left: the percentage of c-Fos and Esr1 double positive cells in all c-Fos+ cells (solid lines) and the percentage of Esr1+ cells in DAPI stained cells (chance level) across the anterior-posterior VMHvl. Right: the overlap between defeat- or attack-induced c-Fos and Esr1 in the entire VMHvl is significantly higher than the chance level. One-way ANOVA followed by pairwise comparison with Tukey HSD correction.
(A) One way ANOVA with repeated measures. First row: F(5, 30) = 0.478, p = 0.78923, n = 6 animals. Second row: F(5, 18) = 1.889, p = 0.41561, n = 4 animals. Third row: F(5, 18) = 2.915, p = 0.04929, n = 4 animals; Post-hoc pairwise comparison with Bonferroni correction: All pairs, p > 0.05. Fourth row: F(5,30) = 13.752, p = 1.67 ×10⁻⁶, n = 6 animals. Post-hoc pairwise comparison with Bonferroni correction: −1.4 vs. −1.9 and −1.5 vs. −1.9, p < 0.05. All other pairs, p > 0.05. Fifth row: F(5,24) = 17.75, p = 9.54 ×10⁻⁷, n = 5 animals. Post-hoc pairwise comparison with Bonferroni correction: −1.4 vs. −1.8, −1.4 vs. −1.9, −1.5 vs. −1.8, −1.5 vs. −1.9 and −1.7 vs. −1.9, p < 0.05. All other pairs, p > 0.05.
(B) One-way ANOVA: F(4, 20) = 22.55, p = 3.56 × 10⁻⁷, n = 4–6 animals for each group. Post hoc pairwise comparison with Tukey HSD correction: alone versus attack Balb/c, alone versus defeated by C57BL/6, alone versus defeated by SW, attack C57BL/6 versus defeated by C57BL/6, and attack C57BL/6 versus defeated by SW, p < 0.01. Attack Balb/c versus defeated by C57BL/6 and attack Balb/c versus defeated by SW, p < 0.05. All other pairs, p > 0.05.
(C) One-way ANOVA: F(4, 20) = 6.61, p = 0.0015, n = 4–6 animals for each group. Post hoc pairwise comparison with Tukey HSD correction: alone versus defeated by C57BL/6 and alone versus defeated by SW, p < 0.01. Alone versus attack Balb/c, p < 0.05. All other pairs, p > 0.05.
(E) One-way ANOVA: F(2, 21) = 11.63, p = 0.0004, n = 5–11 animals for each group. Post hoc pairwise comparison with Tukey HSD correction: chance level versus proportion of c-Fos and Esr1 double-positive cells in c-Fos+ cells in each test condition (attack or defeated), p < 0.01. Attack versus defeated, p > 0.05.
Error bars represent SEM. *p < 0.05, **p < 0.01.
See also Figure S1.
Estrogen receptor α (Esr1) was previously shown to be highly enriched in the VMHvl (Lee et al., 2014; Mitra et al., 2003). The VMHvl Esr1 cells are particularly relevant for social behaviors, including aggression and sexual behaviors (Hashikawa et al., 2017; Lee et al., 2014; Musatov et al., 2006; Spiteri et al., 2010). We asked whether the Esr1+ cells are also relevant for social defense. We found a preferential overlap between c-Fos and Esr1 throughout the anterior and pVMHvl in defeated mice (Figures 1D and 1E). While Esr1 is expressed in only 40% of VMHvl cells, approximately 65% of c-Fos+ cells express Esr1 (Figure 1E). The extent of overlap between c-Fos and Esr1 in the VMHvl is comparable after aggression and social defeat (Figure 1E).
In Vivo Fiber Photometric Recording of VMHvl Esr1+ Cell Activity during Social Defense
The increase in c-Fos in the VMHvl in defeated animals may reflect neural activation during active defense when being attacked, passive defense after being attacked, or other behaviors associated with the aggressor encounter. To better understand the behavioral events correlated with the activity increase of VMHvl Esr1+ cells, we implemented fiber photometry (Cui et al., 2013; Gunaydin et al., 2014) to record the population Ca2+ signal from VMHvl Esr1+ cells. Given the differential c-Fos expression in the anterior and pVMHvl in defending animals, we attempted to directly compare the activity of anterior and pVMHvl cells by recording from both areas simultaneously. We injected 80 nL of AAV1-CAG-FLEX-GCaMP6f into one side of aVMHvl (bregma: −1.4 mm) and the same virus into the contralateral pVMHvl (bregma: −1.9 mm) and implanted a 200 μm optic fiber above each injection site in adult male Esr1-2A-Cre mice (Figures 2A–2C). Although the virus appeared to spread to both aVMHvl and pVMHvl bilaterally, regardless of the injection site, histological analysis revealed that the optic fibers were successfully placed above aVMHvl and pVMHvl in 6 animals (bregma [mean ± SD]: anterior fiber, −1.38 ± 0.15 mm; posterior fiber, −1.84 ± 0.22 mm), which were used for final analysis (Figure 2C). Esr1 staining revealed that GCaMP6f expression was largely confined in the Esr1-expressing cells, supporting that the VMHvl Esr1+ cells are the main source of the recorded signals (Figure 2C). Three weeks after injection, we monitored the Ca2+ activity as recording mice encountered a non-aggressive male intruder and an aggressive male intruder in the home cage of the recording mouse, each for 10 to 20 min.
Figure 2. In Vivo Population Recording of the VMHvl Esr1+ Cells during Aggression and Conspecific Defense.

(A) Schematics of the dual optical recording setup and experimental schedule.
(B) Viral construct and implantation locations.
(C) Top row: representative images showing the optic fiber tracks right above the aVMHvl (left) and pVMHvl (right). Blue: DAPI staining. Bottom row: Esr1 (red), GCaMP6f (green), and their overlay. Scale bars: 100 μm.
(D) Representative traces of the Z-scored normalized GCaMP6 signal from the aVMHvl (black) and pVMHvl (red) during aggressor encounters. Color shades indicate behavioral events.
(E) aVMHvl shows higher average ΔF/F change over baseline in the presence of an aggressor versus a non-aggressor. pVMHvl shows the opposite pattern. Paired t test. aVMHvl: t(5) = −3.47, p = 0.018. pVMHvl: t(5) = 3.94, p = 0.011. Student’s t test. aVMHvl: with non-aggressor, t(5) = 2.56, p = 0.051; with aggressor, t(5) = 3.83, p = 0.012; pVMHvl: with non-aggressor, t(5) = 5.45, p = 0.0028; with aggressor, t(5) = 3.00, p = 0.030. *p < 0.05.
(F) Heatmaps showing the Z-scored GCaMP6f post-stimulus histograms (PSTHs) aligned to various behaviors at aVMHvl (top) and pVMHvl (bottom) of individual animals. Only 4 of 6 recorded animals showed attack.
(G) Averaged PSTHs of the Z-scored GCaMP6f signal aligned to various behaviors of all animals. Shades represent ± SEM.
(H) Comparing averaged GCaMP6 responses of aVMHvl and pVMHvl during various social behaviors. Paired t-test. Sniff non-aggressor: t(5) = −2.26, p = 0.073; attack: t(3) = −0.83, p = 0.47; sniff aggressor: t(5)= −2.61, p = 0.047; defend: t(5) = 3.06, p = 0.028; dash: t(5) = 3.31, p = 0.021; upright: t(5) = 1.50, p = 0.19; freeze: t(5) = 2.14, p = 0.085. *p < 0.05.
(I) Relative GCaMP6f responses during various social behaviors in the aVMHvl (black) and pVMHvl (red). One-way ANOVA. p < 0.001 for both aVMHvl and pVMHvl. Pairwise comparison with Tukey-Kramer correction. Left: F(6, 33) = 5.57, p = 0.0004. Right: F(6, 33) = 6.45, p = 0.0001. Pairwise comparison with Tukey-Kramer correction. Left: defend versus sniff non-aggressor, p < 0.05; defend versus sniff aggressor, p < 0.05; defend versus up, p < 0.05; defend versus freeze, p < 0.05. Right: attack versus freeze, p < 0.05; attack versus up, p < 0.05; attack versus dash, p < 0.05; sniff aggress or versus freeze, p < 0.05; sniff non-aggressor versus freeze, p < 0.05. All other pairs, p > 0.05. *p < 0.05.
Error bars ± SEM.
See also Figures S2–S4.
Upon introduction of the non-aggressor, all 6 animals investigated the intruder and 4 animals initiated attacks during the testing period. Upon introduction of the aggressor, the recording animals initially sniffed the aggressor (Figure S2A), but soon afterward, the aggressor initiated attacks toward the recording mice (latency to first attack: 125.7 ± 47.4 s). Upon being attacked by the aggressor, recording mice showed clear active defense, including dashing and jumping away from the aggressor and assuming an upright posture while pushing the aggressor (Figure S2A; Video S1). These behaviors constitute approximately 75% of all behaviors shown by the recording mice when being attacked (Figure S2B), and all agonistic interactions were terminated by these active defensive behaviors (Figure S2C). During the remaining 25% of agonistic interaction time, the defender spent approximately 15% of the time struggling to move forward as the aggressor bit the back of the recording mouse (drag) and 9% of the time transitioning between dashing and assuming an upright position. Rarely (~1%) did animals show defenseless actions, such as lying on their stomach or back with no active movements when being attacked (Figures S2A and S2B). When the aggressor approached recording mice without immediate attacks, recording mice often assumed an upright posture (48.0% ± 6.0% of being-approached events) or dashed away (25.9% ± 7.2% of being-approached events), likely in an effort to prevent potential attacks from occurring (Figures S2D and S2E; Video S2).
We continuously monitored the Ca2+ activity as the recording mice encountered the non-aggressor and aggressor in their home cages (Figure 2D). In the presence of the male intruder, the overall Ca2+ signal increased in both anterior and pVMHvl (Figure 2E). In the aVMHvl, the signal increase was significantly larger during the encounter with the aggressor than the encounter with the non-aggressor, while the pVMHvl showed the opposite pattern (Figure 2E). We then examined the Ca2+ signal change during specific behaviors, including sniffing the non-aggressor, attacking the non-aggressor, sniffing the aggressor, dashing upon being approached by the aggressor, assuming upright positions upon being approached by the aggressor, active defense when being attacked, and freezing after being attacked. We did not separate individual actions during active defense given that these actions interchanged rapidly and often lasted for a fraction of a second, which is shorter than the temporal resolution allowed by GCaMP6f (Chen et al., 2013). For the aVMHvl, we found that maximum GCaMP6 activity increase occurred during active defense followed by dashing upon being approached (Figures 2F–2I). When the animals assumed an upright posture, sniffed an aggressor or a non-aggressor, or attacked a non-aggressor, the activity also increased but to a lesser extent. During freezing after being attacked, no increase in Ca2+ activity was observed (Figures 2F–2I). In contrast to the aVMHvl responses, the maximum Ca2+ increase of the pVMHvl occurred during attack followed by investigating a non-aggressor and aggressor (Figures 2F–2I). The Ca2+ activity increase during active defense and dash are relatively weak and varied across animals. No Ca2+ increase was observed during upright or freezing (Figures 2F–2I). When directly comparing the responses of aVMHvl and pVMHvl, we found that the aVMHvl has a significantly higher Ca2+ increase during active defense and dashing than the pVMHvl, while the pVMHvl showed higher responses during social investigation than the aVMHvl (Figure 2H). The aVMHvl and pVMHvl responses during attack are comparable (Figure 2H). In five GFP-expressing control animals, we found no significant increase in fluorescence activity during any interaction with an aggressor, supporting that the GCaMP signal change is minimally affected by movement artifacts (Figure S3).
Defenseless actions, such as lying motionlessly when being attacked, were rare (approximately 1%) in the test animals that encountered the aggressor for the first time (Figure S2B). However, we found a higher frequency of defenseless actions in animals that were defeated repeatedly. In a separate set of animals that were defeated for 12 days, the animals spent approximately 7% of time acting defenselessly when being attacked on the last day of testing (Figures S4A and S4B). VMHvl Esr1+ cells showed no activity increase during these defenseless actions while remaining highly activated during active defense (Figures S4C and S4D). These repeatedly defeated animals also occasionally attempted to jump out of the cage when the aggressor was far away. No Ca2+ activity increase was observed during the jumping, suggesting that the response of the cells is not simply due to intensive movements (Figures S4C and S4D). In addition, when the test animal encountered a natural predator, a rat (though direct attack from the rat was prohibited), we observed no increase in Ca2+ signal during close interaction with the rat or when recording mice moved away from the rat quickly, suggesting that the VMHvl Esr1+ cells likely respond specifically during social encounters (Figures S4E–S4G).
Inhibiting VMHvl Esr1+ Cells Compromises Social Defense
Given that the VMHvl Esr1+ cells are maximally excited during active defense when encountering an aggressor, we next investigated whether the VMHvl Esr1+ cell activation is necessary for driving the behavior by optogenetically suppressing it when animals were under attack. We injected AAV-expressing CRE-dependent eNpHR3.0 bilaterally into the VMHvl of Esr1-2A-Cre mice and implanted bilateral cannulas above the VMHvl for inserting optic fibers to deliver light (Figures 3A–3C). A control group of mice was injected with GFP-expressing virus and underwent the same testing procedure. Three weeks after surgery, during testing, an experienced aggressor was introduced into the home cage of eNpHR3.0- or GFP-injected mice and quickly initiated attacks against the resident mouse (first attack latency: eNpHR3.0 group, 15.9 ± 8.8 s; GFP group, 14.1 ± 5.3 s). Immediately after the onset of each attack episode, bilateral continuous yellow light (λ = 593 nm, ~5 mW each side) was delivered through optic fibers to the VMHvl until the end of the attack episode (defined as when two animals separate from each other and the aggressor stops pursuing the experimental mice) (Figure 3D). When VMHvl Esr1+ cells were inhibited, test animals were significantly compromised in their ability to actively defend themselves and break apart from an attack (Figures 3E and 3F). When attacked, in comparison to GFP animals, eNpHR3.0 animals spent significantly less time actively defending themselves, e.g., dashing, jumping, upright, and pushing, and more time acting defenselessly, e.g., lying motionlessly on the back or belly (Figures 3E and 3F; Video S3). Inactivation of VMHvl Esr1+ cells did not impair the general movement of animals. When the test animal was alone in its cage, the locomotion speed did not decrease during light delivery in eNpHR3.0 or control groups (Figure 3G). In the GFP group, most attack trials (90.8% ± 4.0%) were terminated by the defending mice dashing away or assuming an upright posture. In the eNpHR3.0 group, only two-thirds of the attack trials (65.0% ± 8.1%; rank-sum test, p < 0.01) ended with active defense, while the remaining one-third of trials ended by the aggressor walking away from test mice after biting them for an extensive period without resistance (Figures 3H and 3I). As a result, the average duration of agonistic encounter was significantly longer in the eNpHR3.0 group than in the control group (attack duration: halo, 55.1 ± 9.3 s, versus GFP, 32.5 ± 2.6 s; unpaired t test, p < 0.05) (Figure 3J).
Figure 3. Optogenetic Inhibition of the VMHvl Esr1+ Cells Suppresses Active Defense against Aggressors.
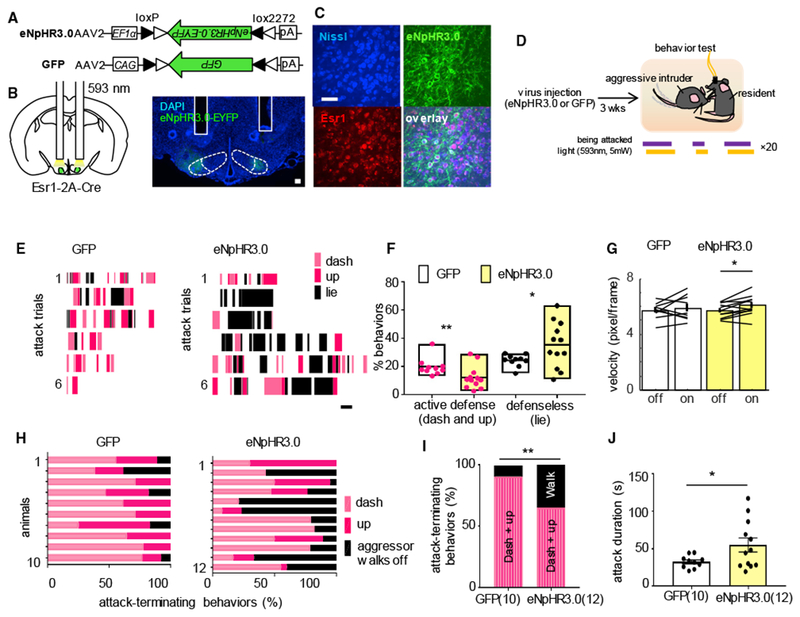
(A) Viral constructs.
(B) Implantation schematics and an image showing the bilateral cannula tracks (white lines) and eNpHR3.0-EYFP expression (green). Blue: DAPI staining. Scale bar: 100 μm.
(c) Images showing overlay between eNpHR3.0-EYFP (green) and Esr1 (red) in the VMHvl. Blue: Nissl staining. Scale bar: 50 μm.
(D) Experimental schedule.
(E) Raster plots showing the behaviors of representative GFP (left) and eNpHR3.0 (right) mice when they were being attacked. Scale bar: 1 s.
(F) Percentage of time animals showed active defensiveness (dash and up) and defenselessness (lying) during the agonistic interaction with the aggressor. Wilcoxon rank-sum test, dash and up, p = 0.0092. Unpaired t test, lie, p = 0.043, n = 10 animals for the GFP group, n = 12 animals for the eNpHR3.0 group. Left: rank-sum test, **p < 0.01. Right: unpaired t test, *p < 0.05.
(G) Movement velocity during light-on and light-off periods when GFP and eNpHR3.0 mice were alone in the cage. Paired t test, p = 0.48, n = 10 animals for the GFP group, and p = 0.013, n = 12 animals for the eNpHR3.0 group. *p < 0.05.
(H) Behaviors that terminated episodes of attack in GFP and eNpHR3.0 animals.
(I) Average percentage of attacks that ended with the aggressor walking away versus the test animals dashing away or rearing up. Wilcoxon rank-sum test, p = 0.0085, n = 10 animals for the GFP group, n = 12 animals for the eNpHR3.0 group. *p < 0.05.
(J) Average duration of attack episodes, which presumably reflects how effective the test mice can terminate attacks. Unpaired t test, p = 0.0374, n = 10 animals for the GFP group, n = 12 animals for the eNpHR3.0 group. *p < 0.05.
Activating VMHvl Esr1+ Cells Induces Both Defensive and Aggressive Behaviors
Optogenetic activation of VMHvl Esr1+ cells has been reported to elicit attack and mounting (Hashikawa et al., 2017; Lee et al., 2014). We next tested whether activation of these cells can also elicit defensive behaviors. We injected AAV2-Ef1α-DIO-hChR2(H134R)-EYFP into the aVMHvl (bregma: −1.4 mm) or pVMHvl (bregma: −1.9 mm) bilaterally and implanted cannulas above the injection sites in adult male Esr1-2A-Cre mice (Figures 4A and 4B). Histological analysis confirmed the overlap between ChR2-EYFP and Esr1 expression (Figure 4C). Three weeks after the surgeries, bilateral optic fibers were inserted through cannulas to activate the VMHvl, one side at a time. The light pulses (20 ms, 20 Hz) started at 0.5 mW and increased gradually until clear behavioral changes were observed or when the light intensity reached 4 mW (Figure 4D). For each animal, only results from one side of the VMHvl (typically the side with clear behavioral changes) were used for final analysis to ensure the independence of all data points. In the presence of a female intruder, 8 of 20 animals attacked the female upon the light stimulation, supporting a role of VMHvl Esr1+ cells in driving aggressive behaviors (Figures 4E and 4F). In the remaining 12 animals that did not show light-induced attack, defense-like behaviors were observed (Figures 4E–4H). Upon stimulation, test mice spent more time assuming upright postures and were more likely to dash away from the female (Figures 4G and 4H). When we carefully examined the videos from the animals that showed light-induced attack, defense-like behaviors, such as upright postures and dashing, were also observed during the light delivery (Figures 4E, 4G, and 4H). In five mCherry-expressing control animals, light-induced defense or attack was not observed (Figure S5).
Figure 4. Optogenetic Activation of VMHvl Esr1+ Cells Elicits Defensive Behaviors.

(A) Virus construct and dual cannula placement.
(B) Cannula track and expression of ChR2-EYFP in the VMHvl. Scale bar: 100 μm.
(C) Images showing overlap between Esr1 (red) and ChR2-EYFP (green). Blue: Nissl staining. Scale bar: 50 μm.
(D) Experimental schedule.
(E) Raster plots from two example animals. One showed light-induced attack and defensive behaviors (left), and the other showed only light-induced defensive behaviors (right). Scale bar: 10 s.
(F) Accumulated probability of attack from 60 s before light onset to light offset. Time 0 indicates light onset.
(G) Percentage of upright posture (left) and latency to upright posture (right) for light-induced attackers versus non-attackers. Left: p = 0.0036, n = 8 animals for the attacker group; p = 0.0029, n= 12 for non-attacker group. Right: p = 0.0002, n = 8 animals for the attacker group; p= 1.63 × 10⁻⁵, n = 12 for non-attacker group.
(H) Percentage of trials that animals dashed (left) and latency to dash (right) for light-induced attackers versus non-attackers. Left: p = 0.0068, n = 8 animals for the attacker group; p = 1.05 × 10⁻⁵, n = 12 for non-attacker group. Right: p = 0.011, n = 8 animals for the attacker group; p = 7.74 × 10⁻⁵, n = 12 for non-attacker group.
(I) Images showing light stimulation-induced c-Fos (red) in the VMHvl. Scale bar: 100 μm.
(J) Total number of c-Fos-expressing cells in the VMHvl of the light-stimulated side versus the unstimulated side. p = 3.39 × 10⁻⁵, n = 17 animals.
(K) Distribution of the number of light-induced c-Fos+ cells in the anterior versus posterior VMHvl. Purple dots indicate light-induced attackers. Paired t test in (G), (H), and (J). *p < 0.05, **p < 0.01, ***p < 0.001. Error bars ± SEM.
See also Figure S5.
To understand the precise site of activation during light delivery, we induced c-Fos 1 h before sacrificing the animals by delivering light to the VMHvl in the absence of an intruder (Figure 4D). In comparison to the unstimulated side, the c-Fos significantly increased at the stimulated side (Figures 4I and 4J). Most aVMHvl-targeted animals (9 of 10) showed anteriorly biased c-Fos, and all pVMHvl-targeted animals (10 of 10) showed posteriorly biased c-Fos. Among the 11 animals that showed pVMHvl-biased c-Fos, 7 showed light-induced attack, whereas only 1 of 9 aVMHvl-biased animals showed light-evoked attack (Fisher’s exact test, p = 0.028) (Figure 4K). Thus, consistent with our previous findings (Hashikawa et al., 2017; Lin et al., 2011), these results support the role of pVMHvl in driving aggression and revealed a previously unappreciated role of VMHvl Esr1+ cells in driving active defense against conspecifics.
Differential Projection Patterns of the aVMHv1 versus pVMHvl Esr1+ Cells
The optical recording and optogenetic activation results suggested that aVMHvl differs from pVMHvl in its behavioral relevance and in vivo responses. We next asked whether aVMHvl also differs from pVMHvl in its connectivity. We first examined the overall projections of VMHvl Esr1+ neurons by injecting Cre-dependent GFP into the VMHvl of Esr1-2A-Cre mice and found that VMHvl Esr1+ cells project anteriorly to the lateral septum (LS), MPOA, anterior hypothalamic nucleus (AHN), and PVN and posteriorly to the dorsal and lateral parts of the periaqueductal gray (dPAG and lPAG) (Figure S6). Next, we injected retrograde herpes simplex virus (HSV) expressing Cre-dependent fluorescent protein into various downstream regions of the VMHvl Esr1+ cells using Esr1-2A-Cre mice and examined the distribution of fluorescence protein-labeled cells in the VMHvl (Figure 5A). We found that when the injection was located at the lPAG, regardless of its rostral or caudal portion, a higher percentage of Esr1+ cells was labeled in the aVMHvl than in the pVMHvl (Figures 5B–5D). In contrast, when the injection targeted the LS, MPOA, and PVN, a significantly higher percentage of Esr1+ cells was labeled in pVMHvl than in the aVMHvl (Figures 5B–5D). Injection into the AHN resulted in a comparable percentage of Esr1+ cells being labeled in aVMHvl and pVMHvl (Figures 5B–5D). These results suggest that aVMHvl and pVMHvl have differential projection patterns, with aVMHvl Esr1+ cells projecting primarily caudally and pVMHvl Esr1+ cells projecting rostrally.
Figure 5. Differential Projection Patterns of the Anterior VMHvl and Posterior VMHvl Esr1+ Cells.

(A) Viral construct and experimental schematics.
(B) Left column shows the targeted brain structures indicated by red dashed lines. Right column shows example images containing the injection sites that are marked by the co-injected fluorescent microsphere (red arrows).
(C) Example images showing retrogradely labeled cells in the aVMHvl and pVMHvl.
(D) Percentage of anterior VMHvl (A) and posterior VMHvl (P) Esr1+ populations that are retrogradely labeled after targeting various brain regions. LS: p = 0.0045, n = 8 animals; MPOA: p = 0.0023, n = 5 animals; AHN: p = 0.4204, n = 7 animals; PVN: p = 0.0175, n = 4 animals; rPAG: p = 0.0223, n = 6 animals; cPAG: p = 0.0451, n = 8 animals.
LS, lateral septum; MPOA, medial preoptic area; AHN, anterior hypothalamic nucleus; PVN, paraventricular nucleus of hypothalamus; rPAG and cPAG, rostral and caudal periaqueductal gray. All scale bars: 100 μm. Paired t test, *p < 0.05, **p < 0.01.
See also Figure S6.
DISCUSSION
Our study identified an important role of VMHvl Esr1+ cells in driving active defense against attacks from conspecifics and revealed functional and anatomical heterogeneity of the cells in VMHvl. We found that Esr1+ cells, especially those situated at the anterior portion of the VMHvl, are significantly excited when animals actively defend themselves against ongoing or potential attacks. Inhibiting the VMHvl Esr1+ cells compromises animals’ ability to defend, whereas activation of the cells induces defense-like behaviors even in the face of a non-threatening female mouse. Furthermore, the aVMHvl cells differ from the pVMHvl cells in their projection pattern. While the aVMHvl cells strongly project to the PAG, the pVMHvl cells primarily project rostrally.
Possibly inspired by the high level of c-Fos in the VMHvl after social defeat, two studies have investigated the role of VMHvl in social fear. In one study, Silva et al. (2013) found that defeat induced social fear, as measured by the duration of immobility and risk assessment toward a confined distant aggressor, was reduced when the VMHvl was inactivated. In a second study, Sakurai et al. (2016) used an elegant viral approach, CANE, to capture the VMHvl cells that were activated during defeat and then manipulated the captured cells during non-agonistic social interaction. They found that inhibiting the defeat-induced c-Fos+ VMHvl cells reduced social avoidance toward a non-aggressor, whereas activating the captured cells reduced social contact and increased fear-like cornering behaviors (Sakurai et al., 2016). Thus, these two studies concluded that the VMHvl is essential for driving social fear after defeat experience. Here, our in vivo recording revealed that the VMHvl cells are most active during active defense against ongoing attacks, whereas the cell activity after defeat is relatively low. Guided by the response patterns of the VMHvl, we inhibited the VMHvl cells during agonistic encounters and revealed an essential role of the cells in driving active defense against conspecific attacks. VMHvl Esr1+ cells do not appear to be activated by the presence of a natural predator, the rat, suggesting a potential specific role of the VMHvl in social behaviors. This result is consistent with previous studies showing that the dorsomedial part of the ventromedial hypothalamus (VMHdm), instead of VMHvl, is relevant for predator defense (Silva et al., 2013; Wang et al., 2015). However, in our experiment, the hand-held rat was not allowed to initiate attack toward the recording mice; thus, it remains possible that the VMHvl cells are relevant to active defense against a predator’s attack.
Active defense and social fear are fundamentally different. The former is composed of intensive movements to fend off attacks, while the latter is an emotional state that is often characterized by relatively low-intensity movement or lack thereof (e.g., freezing) to avoid a social target. While it might be beneficial to reduce social fear toward a benign conspecific, suppressing social defense will have a devastating effect on the survival of an individual. Our studies strongly suggest that the main function of the VMHvl in the context of aggressor interaction is to drive active defensive behaviors to escape from attacks, which include dashing and pushing the aggressor both preemptively and during attacks. Although we did not examine the functional role of the VMHvl in social fear specifically, we found that the VMHvl cell activity is low when the defending animals freeze in the corner between attacks. Given that freezing is a common indication of fear in rodents (Valentinuzzi et al., 1998), a lack of responses of VMHvl Esr1+ cells during freezing argues against a role of VMHvl in encoding the overall fearful state of the defeated animal.
The VMHvl has been shown to drive at least four types of social behaviors: close investigation, mount, attack, and active defense. VMHvl cells increase activity in all these behaviors, and artificial activation of the VMHvl can elicit all these behaviors (Falkner et al., 2016; Lee et al., 2014; Lin et al., 2011; Yang et al., 2013). How are these diverse behaviors being mediated by the approximately 10,000 cells in the VMHvl? On the one hand, VMHvl appears to contain compartments that preferentially drive specific behaviors. Here, we demonstrated that the aVMHvl cells are particularly relevant for social defense. Their response during social defense is significantly higher than that during other social behaviors, and activation of the aVMHvl in naive animals leads to defensive behaviors exclusively. This finding is consistent with a previous immediate-early gene study showing that the defeat-induced c-Fos+ cells are largely distinct from those induced by aggression (Sakurai et al., 2016). In a separate study in females, we found that two functionally distinct compartments exist in the pVMHvl: the medial compartment mediates aggression, while the lateral compartment mediates sexual behaviors (Hashikawa et al., 2017). Thus, some cells in the VMHvl appear to be developmentally hardwired for specific behavioral functions. On the other hand, certain social behaviors, such as social investigation and attack, are likely driven by largely overlapping VMHvl cells. In both male and female mice, electrophysiological recording revealed highly correlated responses of VMHvl cells during social investigation and attack, although the activity increase during attacks is generally higher (Falkner et al., 2014; Hashikawa et al., 2017; Lin et al., 2011). Consistent with these response patterns, low-intensity stimulation of the VMHvl Esr1+ cells induces social investigation, whereas high-intensity stimulation induces attack in both sexes (Hashikawa et al., 2017; Lee et al., 2014). Therefore, the VMHvl cells likely employ both frequency coding and identity coding to drive this diverse set of innate social behaviors.
The pathways downstream of the VMHvl that mediate aggression and social defense remain largely unclear. The high responses of the aVMHvl during social defense and its strong projection of the PAG suggests a potentially important role of the VMHvl to PAG pathway in mediating social defense. Consistent with this hypothesis, Depaulis et al. (1989) injected kainic acid into the PAG in rats in the presence of a conspecific and found that the PAG activation induced backward locomotion, upright postures, or dashing upon being investigated by a partner. These behaviors, as noted by the authors, are seemingly identical to the rat’s natural reactions to attacks by a conspecific aggressor, supporting a role of the PAG in active social defense (Depaulis et al., 1989). However, several lines of evidence also support a role of PAG in aggression. c-Fos was consistently found to be elevated in the PAG after aggressive behaviors (Halász et al., 2002; Haller et al., 2006; Hashikawa et al., 2017; Lin et al., 2011). One in vivo electrophysiological report identified attack-responsive cells in cats (Adams, 1968). Direct electric stimulation of PAG in rats could elicit attack, although the induced behavior was accompanied by motor disturbance (Mos et al., 1982). Conversely, electric lesion of PAG transiently impaired aggression in rats (Mos et al., 1983). Given a likely role of PAG in aggression, does the VMHvl to PAG projection also play a role in driving attack? Our cell-type-non-specific retrograde labeling suggests that at least some VMHvl to PAG projectors express c-Fos after aggression, supporting a possible role of the VMHvl to PAG pathway in aggression (D.L., unpublished data). However, the pVMHvl cells project mainly to hypothalamic regions anterior to the VMHvl, suggesting a relevance of those anterior structures to aggression. Consistent with this hypothesis, microinjection of picrotoxin or vasopressin into the AHN induced kick and bite in rodents (Adams et al., 1993; Ferris et al., 1997). RNAi knockdown of vasoactive intestinal polypeptide in the AHN of zebra finch reduced territory aggression (Goodson et al., 2012). Electric stimulation of medial preoptic areas can elicit attacks, although the success rate is low (Siegel et al., 1999). Those anterior structures presumably control the motor output of attack through their descending projections to midbrain and brainstem structures, and PAG represents a main target for both MPOAand AHN (Risold et al., 1994;Simerly and Swanson, 1988). The di-synaptic VMHvl to PAG pathway may be beneficial in that these anterior structures receive substantial extrahypothalamic inputs (e.g., from LS, hippocampus, and prefrontal cortex) and thus will allow stronger top-down control of the aggression initiation (Biro et al., 2018; Simerly and Swanson, 1986). In contrast, the strong direct projection from the aVMHvl to PAG may be essential for the split-second reactions that allow the animals to defend against conspecific attacks.
STAR★METHODS
CONTACT FOR REAGENT AND RESOURCE SHARING
Further information and requests for resources and reagents should be directed to and will be fulfilled by the Lead Contact, Dayu Lin (dayu.lin@nyulangone.org).
EXPERIMENTAL MODEL AND SUBJECT DETAILS
Animals
All procedures were approved by the IACUC of NYULMC in compliance with the NIH guidelines for the care and use of laboratory animals. Mice were housed under a 12 h light-dark cycle (12 p.m. to 12 a.m. light), with food and water available ad libitum. Test animals were adult C57BL/6 wild-type animals or Esr1-2A-Cre male mice with C57BL/6 background (> 10 weeks). The Esr1-2A-Cre mice were originally provided by D.J. Anderson (Lee et al., 2014) and now available from Jackson Laboratory (Stock No. 017911). Stimulus animals were single-housed, sexually experienced C57BL/6 and Swiss Webster males (aggressor) and group housed BALB/c and C57BL/6 male mice (non-aggressors) purchased from commercial vendors. After surgery, all the test animals were single-housed. All experiments were performed during the dark cycle of the animals. The stimulus rat was a single-housed wild-type male Long-Evans rat (15 weeks) originally purchased from Charles River.
METHOD DETAILS
Behavioral analysis
Animal behaviors in all experiments were video recorded from both the side and top of the cage using two synchronized cameras (Basler, acA640-100 gm) and a commercial video acquisition software (StreamPix 5, Norpix) in a semi-dark room with infrared illumination at a frame rate of 25 frames/s. Behavioral annotation and tracking was performed on a frame-by-frame basis using custom software written in MATLAB (https://pdollar.github.io/toolbox/) (Lin et al., 2011). During aggressor interaction, we defined seven behaviors of the test mice, including dash/jump, upright/push, lie, drag, freeze, cage jump and sniff, and two behaviors of the aggressor, including approach and attack. During non-aggressor interaction, we defined two behaviors of the test mice, including sniff and attack. During rat interaction, we defined two behaviors of the test mice, including close interaction and move away. “Sniff” was defined as close contact to any part of the intruder’s body. “Attack” was defined as a suite of intense actions aiming at harming the target mouse, including pushes, lunges, bites, tumbling, and fast locomotion episodes between such movements. “Dash/jump” was defined as quick and sudden movement away from the aggressor. “Upright/push” was defined as sudden assumption of an upright posture that is often followed by pushing with front paws. “Drag” was defined as crawling forward while being bitten on the back. “Lie” was defined as lying on the back or stomach with no obvious movement while being attacked. “Freeze” was defined as a lack of any obvious movement of any body parts and usually occurs after the animal is attacked. “Approach” of an aggressor was defined as continuous movement toward a stationary resident mouse until the center mass of the two animals are below 100 pixels. “Cage jump” was defined as upward jumping facing the cage wall, likely in an attempt to escape from the cage. When being attacked, dash/Jump and upright/push were considered as active defensive behaviors while lie was considered as a defenseless action. For fiber photometry analysis, we combined all behaviors except lie that occurred when being attack as defense given that the exchange of those behaviors were faster than the GCaMP6f kinetics. Dash and upright that occurred upon aggressor’s approach were analyzed separately. For the rat exposure experiment, an anesthetized rat was held by hand and positioned in front of the test mouse for 20 s-30 s at a time for 10 times. “Close interaction” was defined as any contact between the recording animal’s front end and the rat body. “Move away” was defined as the quick turning and moving away from the rat. Freeze, dash and approach were first determined based on center mass velocity and distance of the animals and then refined with manual inspection (Wang et al., 2015). All other behaviors were annotated manually frame-by-frame.
Immediate early gene mapping
All experimental animals were C57BL/6 wild-type males. They were divided into five groups. Animals in the “alone” group were left undisturbed in their home cages. Animals in the “attack” groups interacted with a non-aggressive C57BL/6 male or a BALB/c male intruder for 10 min and attacked the intruder for at least 10 times. Animals in the “defeat” group interacted with an aggressive C57BL/6 or a Swiss Webster male intruder for 10 min and were attacked by the aggressor for at least 10 times during that period. 90 min after removal of the intruder, the resident mouse was sacrificed, and brain was harvested for histological analysis.
Fiber photometry
Each test mouse was injected with 80 nL AAV1.CAG.FLEX.GCaMP6f.WPRE.SV40 into one side of the aVMHvl (AP: −1.4 mm, ML: ± 0.75 mm, DV: 5.55 mm) and 80 nL of the same virus into the contralateral pVMHvl (AP: −1.9 mm, ML: ± 0.75 mm, DV: 5.75 mm) through a glass capillary using a nanoinjector (World Precision Instruments, Nanoliter 2000) at 30 nl/min. Control mice were injected with AAV1.CAG.FLEX.EGFP.WPRE.bGH into the aVMHvl unilaterally. After injection, a custom made optic fiber assembly (Thorlabs, FT200EMT, CFLC230-10) was implanted approximately 500 μm above each injection site and secured using dental cement (C&B Metabond, S380). Three weeks after the surgery, each implanted optic fiber was connected with a matching 200 μm optic fiber using a ceramic split mating sleeve (Thorlabs, ADAL1). A second set of animals were injected with 80 nL of AAV2.CAG.Flex.GCaMP 6f.WPRE.SV40 virus and implanted with 400 μm optic fiber (Thorlabs, BFH48-400 and CF440-10), targeting 300 μm above the middle of the VMHvl (AP: −1.7 mm, ML: ± 0.75 mm, DV: 5.75 mm).
The fiber photometry setup was constructed following basic specifications as previously described (Falkner et al., 2016; Hashikawa et al., 2017). Briefly, 390-Hz and 273-Hz sinusoidal blue LED light (30 μW) (LED light: M470F1; LED driver: LEDD1B; both from Thorlabs) were bandpass filtered (passing band: 472 ± 15 nm, FF02-472/30-25, Semrock) and delivered to each of the two sides of the brain to excite GCaMP6f. The emission light from each recording site traveled back through the same optic fiber, bandpass filtered (passing bands: 535 ± 25 nm, FF01-535/505, Semrock), passed through an adjustable zooming lens (Thorlab, SM1NR01 and Edmund optics, #62-561), detected by a Femtowatt Silicon Photoreceiver (Newport, 2151) and recorded using a real-time processor (RZ5, TDT). The envelope of the 390-Hz and 273-Hz signals reflected the intensity of the GCaMP6f and were extracted in real time using a custom TDT program. The signal was low pass filtered with a cut-off frequency of 5 Hz.
Prior to each recording, high intensity light (1 mW) was passed through the 200 μm optic fibers for 1 h to reduce the fluorescence background caused by the optic fiber itself. 400 μm optic fibers have low fluorescence background and thus do not require prebleach. During recording, the animals were first alone in its home cage for 5-10 min, and then sequentially encountered a BALB/c non-aggressive intruder and a C57BL/6 aggressor, each for at least 10 min. For Figure S4s, animals were defeated by an aggressive C57BL/6 intruder for 10 min per day for 12 days and the recording data from the last day of defeat was used for analysis. On a separate day, the same set of animals were exposed to an anesthetized hand-held rat for 10 min in 10 trials, each for 20-30 s. To analyze the recording data, the MATLAB function “msbackadj” with a moving window of 25% of the total recording duration was first applied to obtain the instantaneous baseline signal. The instantaneous ΔF/F was calculated as (Fraw−Fbaseline)/Fbaseline. The average fluorescence signals during baseline, with a non-aggressor and with an aggressor were calculated as the mean ΔF/F value of each period. The Z scored ΔF/F of the entire recording session was calculated using MATLAB “zscore” function. The peri-event histogram (PETH) of a given behavior was constructed by aligning the Z scored ΔF/F signal to the onset of the behavior. Only trials that were not preceded by any analyzed behaviors within the four seconds before the onset of the trial were included. The acute response during a behavior was calculated as the average Z score from 0 to 1 s after the onset of the behavior. For Figure 2I, to calculate the relative response across behaviors, we divided the responses during each behavior to the maximum response of that animal across all behaviors and then calculated the average normalized responses across animals.
Optogenetic inhibition
Test Esr1-2A-Cre animals were injected with 70 nL AAV2-EF1a-DIO-eNpHR3.0-EYFP bilaterally into the aVMHvl (AP: −1.4 mm, DV: 5.55 mm, ML: 0.75 mm) at 30 nl/min. Control animals were injected with AAV2-CAG-DIO-GFP using the same condition. After injection, a bilateral guide cannula (Plastics One, center to center distance =1.5 mm) was inserted 0.65 mm above the VMHvl and was secured using dental cement (C&B Metabond, S380). Three weeks later and before the experiments, two 200 μm optic fibers (Thorlabs, FT200EMT) were inserted into the cannula and secured with a matching cap (PlasticsOne). The ends of optic fibers were flush with the cannula ends. The optic fibers were connected to a 593 nm laser (Shanghai Dream Laser) through a light splitter (Font Canada). During test, an aggressive C57BL/6 male mouse was introduced into the home cage of the test animal and allowed to attack the resident for approximately 20 trials. At the onset of each attack, the yellow laser was turned on to deliver the light through the optic fibers until the end of the attack episode.
Optogenetic activation
The viral injection, cannula implantation, and fiber connection procedures are similar to those described for the optogenetic inhibition experiment except that optic fibers were connected to a 473 nm laser (Shanghai Dream Lasers Technology). Half of animals were targeted at the aVMHvl (AP: −1.4 mm, DV: 5.55 mm, ML: 0.75 mm) and half were targeted at the pVMHvl targeted (AP: −1.9 mm, DV: 5.75 mm, ML: 0.75 mm). Three weeks later, during the test, a female was introduced to the home cage of the experimental mouse and they freely interacted for approximately 3 min. Then, the light was delivered unilaterally through the optic fiber for 60 s at 20 Hz, 20 ms for every 3 min. The light intensity started at 0.5 mW and increased gradually until animals showed clear behavior changes (optimal intensity) or up to 5 mW. At the optimal light intensity, we conducted six stimulation trials. Between the two sides of the VMHvl for each animal, the side from which clearer behavioral change could be induced was selected for c-Fos induction and final analysis. One day after the behavior test, we delivered blue light at the optimal intensity to the selected side of the VMHvl (60 s, 20 Hz, 20 ms light every 3 min for 30 min) in the absence of any intruder. 70 min after the light delivery, we perfused the animals, harvested the brains and performed immunohistochemistry to stain for c-Fos.
Tracing
For the anterograde tracing, we injected 8 to 20 nL AAV2-CAG-DIO-GFP into the aVMHvl or pVMHvl of Esr1-2A-Cre male mice and harvested the brains four weeks later. However, the virus spread to the entire VMHvl in all but one animals and thus the anterograde tracing results were not analyzed quantitatively and only used for guiding retrograde tracing experiments. In the retrograde experiments, HSV-hEF1α-LS1L-GFP or HSV-hEF1α-LS1L-mCherry was mixed with blue fluorescent polymer microspheres (Thermo Fisher Scientific, B0100) in 1000:1 ratio and injected into various brain regions, including LS (40 nl, AP: 0.3 mm, DV: 3.2 mm, ML: 0.45 mm), anterior hypothalamus (40 nl, AP: −0.8 mm, DV: 5.0 mm, ML: 0.35 mm), anterior PAG (25 nl, AP: −3.5 mm, DV: 2.0 mm, ML: 0.3 mm), posterior PAG (25 nl, AP:−4.2 mm, DV: 2.0 mm, ML: 0.3 mm), periventricular hypothalamic nucleus (50 nl, AP: −0.5 mm, DV: 4.4 mm, ML: 0.6 mm), and MPOA (100 nl, AP: 0.10 mm, ML: 0.3 mm, DV: 4.8 mm). The brains were harvested for histological analysis two weeks after the viral injection.
Immunnohistochemistry
For immediate early gene mapping, tracing and identifying the viral expression and optic fiber location, animals were deeply anesthetized with a mixture of ketamine (100 mg/kg) and xylazine (10 mg/kg) and transcardially perfused with 20 mL of PBS, followed by 20 mL of 4% paraformaldehyde in PBS. After perfusion, brains were harvested, soaked in 30% of sucrose in PBS for 24 h at 4 °C and then embedded with O.C.T compound (Fisher Healthcare). 50 μm thick coronal brain sections were cut using a cryostat (Leica). Brain sections were washed with PBS and PBST (0.3% Triton X-100 in PBS, 3 × 10 min), blocked in 5% normal donkey serum (NDS, Jackson Immuno Research) in PBST for 30 min at room temperature (RT), and then incubated with primary antibodies in 5% NDS in PBST overnight at RT (about 18 h). Sections were then washed with PBST (3 × 10 min), incubated with secondary antibodies in 5% NDS in PBST for 4 h at RT, washed with PBST (2 × 10 min) and PBS (1 × 10 min). Slides were coverslipped using mounting medium with DAPI (Southern Biotech).
For experiments with the need to analyze Esr1 expression, fresh floating sections were prepared. Animals were deeply anesthetized with a mixture of ketamine (100 mg/kg) and xylazine (10 mg/kg) and transcardially perfused with 20 mL of PBS, followed by 40 mL of 4% paraformaldehyde (PFA). Brains were post-fixed for 1-2 h in 4% PFA and transferred to PBS with 0.05% sodium azide (Sigma) at 4 °C until sectioning. 60 μm thick coronal sections were obtained using a vibratome (Leica, VT1200). Sections were stored in PBS with 0.05% sodium azide at 4 °C until use. Sections were washed with PBS (3 × 5 min) and then blocked in 10% NDS in PBST (0.3% Triton) for 2 h at RT, followed by incubation with primary antibodies (1:500 rabbit anti-Esr1 and 1:200 goat anti-c-Fos) in 10% NDS in PBST (0.3% Triton) for 72 h at 4 °C. Sections were washed with PBST (0.3% Triton, 3 × 30 min), incubated with secondary antibodies in 10% NDS in PBST (0.3% Triton) and NeuroTrace 435/455 Blue Fluorescent Nissl Stain (Life Technologies, 1:200) for 2 h at RT, washed with PBST (2 × 15 min) and PBS (2 × 15 min), mounted on slides and coverslipped with mounting medium (Vector Laboratories). In Figure 2, the slides were counterstained with DAPI (1:10000 in PBST, Thermo Fisher Scientific) before being cover-slipped with mounting medium (Electron Microscopy Sciences).
The primary antibodies used were: rabbit anti-Esr1 (1:500, Santa Cruz, sc-542, Lot #F1715. Unspecific staining was occasionally observed using other lots.) and goat anti-c-Fos (1:250, Santa Cruz, sc52-g). The secondary antibodies used were: donkey anti-goat Alexa 488 (1:500, Life Technologies, A11055), donkey anti-goat Alex Fluor 647 (1:500, Jackson Immuno Research, 705-605-147), donkey anti-rabbit CY3 (1:500, Jackson Immuno Research, 711-165-152) and donkey anti-rabbit Alexa Fluor 488 (1:500, Jackson Immuno Research, 711-545-152).
The 2.5× or 5× fluorescent images were acquired to determine the overall viral expression pattern and cannula and optic fiber placements. For counting c-Fos, Esr1, and retrogradely labeled cells, 20× fluorescent confocal images (Zeiss LSM 800) were acquired using the tiling function of the Zeiss software (Zeiss, ZEN 2.3 system).and counted manually using Neurolucida (MBF bioscience).
QUANTIFICATION AND STATISTICAL ANALYSIS
Comparisons between two groups were performed by paired t test if the comparison was within animal. If not, comparison were performed by unpaired t test if both groups were normally distributed or by rank-sum test if at least one group was not normally distributed. The normality was calculated with Lilliefors test. Comparisons among three or more groups were performed with one-way ANOVA, followed by multiple comparison. All error bars or error shades represent ± SEM. *, p < 0.05; **, p < 0.01; ***, p < 0.001.
DATA AND SOFTWARE AVAILABILITY
Custom MATLAB codes used for data analysis are available upon request to Lead Contact, Dayu Lin (dayu.lin@nyulangone.org).
Supplementary Material
KEY RESOURCES TABLE
| REAGENT or RESOURCE | SOURCE | IDENTIFIER |
|---|---|---|
| Antibodies | ||
| Rabbit anti-Esr1 | Santa Cruz | sc-542, Lot #F1715, RRID:AB_631470 |
| Goat anti-c-Fos | Santa Cruz | sc52-g, RRID:AB_2629503 |
| Donkey anti-goat Alexa 488 | Life Technologies | A11055, RRID:AB_142672 |
| Donkey anti-rabbit CY3 | Jackson Immuno Research | 711-165-152, RRID:AB_2307443 |
| Donkey anti-rabbit Alexa Fluor® 488 | Jackson ImmunoResearch | 711-545-152, RRID:AB_2313584 |
| Donkey anti-goat Alexa Fluor® 647 | Jackson ImmunoResearch | 705-605-147, RRID:AB_2340437 |
| Bacterial and Virus Strains | ||
| AAV1-CAG.FLEX.GCaMP6f.WPRE.SV40 | Upenn vector core | AV-1-PV2816 |
| AAV2-CAG.FLEX.GCaMP6f.WPRE.SV40 | Upenn vector core | Custom |
| AAV1-CAG.FLEX.EGFP.WPRE.bGH | Addgene | 51502-AAV1 |
| AAV2-EF1α-DIO-eNpHR3.0-EYFP | UNC vector core | AAV-EF1α-DIO-eNpHR3.0-EYFP |
| AAV2-CAG-FLEX-GFP | UNC vector core | AAV-CAG-FLEX-GFP |
| AAV2-EF1α-DIO-hChR2(H134R)-EYFP | UNC vector core | AAV-EF1α-DIO-hChR2(H134R)-EYFP |
| AAV2-hSyn-DIO-mCherry | UNC vector core | AAV2-hSyn-DIO-mCherry |
| HSV-hEF1α-LS1L-GFP | MIT vector core | hEF1α-LS1L-GFP |
| HSV-hEF1α-LS1L-mCherry | MIT vector core | hEF1α-LS1L-mCherry |
| Chemicals, Peptides, and Recombinant Proteins | ||
| Blue fluorescent polymer microspheres | Thermo Fisher Scientific | B0100 |
| DAPI | Thermo Fisher Scientific | 62248 |
| Mounting medium with DAPI | Southern Biotech | 0100-20 |
| Mounting medium without DAPI | Electron Microscopy Sciences | 17985-10 |
| VECTASHIELD® antifade mounting Medium | Vector Laboratories | H-1000 |
| NeuroTrace 435/455 Blue Fluorescent Nissl | Life Technologies | N21479 |
| Experimental Models: Organisms/Strains | ||
| Mouse: Balb/C | Jackson Laboratory | Stock #. 000651 |
| Mouse: B6N.129S6(Cg)-Esr1tm1.1(cre)And/J | Jackson Laboratory | Stock #. 017911 |
| Mouse: Swiss Webster | Taconic | Model #SW |
| Mouse: C57BL/6N | Charles River | Stain # 027 |
| Rat: Long-Evans | Charles River | Stain # 006 |
| Software and Algorithms | ||
| StreamPix 5 | NorPix | https://www.norpix.com/ |
| MATLAB | MathWorks | https://www.mathworks.com/ |
| Prism | Graphpad | https://www.graphpad.com/ |
| ImageJ | NIH | https://imagej.nih.gov/ij/ |
| NeuroLucida | MBF Bioscience | https://www.mbfbioscience.com/neurolucida |
| Other | ||
| Nanoinjector | World Precision Instruments | Nanoliter 2000 |
| Optic fibers (200 um) | Thorlabs | FT200EMT, CFLC230-10 |
| Optic fibers (400 um) | Thorlabs | BFH48-400 and CF440-10 |
| Ferrule | Thorlabs | CFLC230-10 |
| Ferrule | Thorlabs | CF440-10 |
| Ceramic split matching sleeves | Thorlabs | ADAL1 |
| Dental cement | C&B Metabond | S380 |
| Blue LED light | Thorlabs | M470F1 |
| LED driver | Thorlabs | LEDD1B |
| Bandpass filter (472 ± 15 nm) | Semrock | FF02-472/30-25 |
| Bandpass filter (535 ± 25 nm) | Semrock | FF01-535/505 |
| Adjustable lens tube | Thorlab | SM1NR01 |
| Lens | Edmund optics | #62-561 |
| Femtowatt silicon photoreceiver | Newport | 2151 |
| Real-time processors | TDT | RZ5 |
| Bilateral guide cannulae | Plastics1 | C2002GS-5-1.5/6mm |
| Fiber cap | Plastics1 | 230/OFC |
| Housing | Plastics1 | C2002H |
| Dummy Cannula | Plastics1 | C2002DCS-5/6mm |
| 593 nm laser | Shanghai Dream Lasers Technology | SDL-593-050 |
| 473 nm laser | Shanghai Dream Lasers Technology | SDL-473-100 |
| Light splitter | Font Canada | Custom |
Highlights.
VMHvl, especially its anterior part, is highly excited during active social defense
Inhibiting the VMHvl Esr1+ cells compromises active defense against an aggressor
Activating the anterior VMHvl Esr1+ cells elicits defense-like behaviors
Anterior and posterior VMHvl Esr1+ cells show differential projection patterns
ACKNOWLEDGMENTS
We thank N. Leal for assistance with video annotation. We thank A.H. Au and C Haddaway for genotyping and maintaining the mouse colony. We thank F. Wang, N.S. Canteras, M. Long, K. Hashikawa, A.L. Falkner and Y. Senzai for commenting on the paper and C. Haddaway for editing the paper. This research was supported by a Uehara postdoctoral fellowship (to T.O.), the Alfred P. Sloan Foundation, the Mathers Foundation, the Irma T. Hirschl Trust, the McKnight Foundation, and NIH R01MH101377 and R21MH105774 (to D.L.).
Footnotes
DECLARATION OF INTERESTS
The authors declare no competing interests.
SUPPLEMENTAL INFORMATION
Supplemental Information includes six figures and three videos and can be found with this article online at https://doi.org/10.1016/j.celrep.2019.01.078.
REFERENCES
- Adams DB (1968). Cells related to fighting behavior recorded from midbrain central gray neuropil of cat. Science 159, 894–896. [DOI] [PubMed] [Google Scholar]
- Adams DB, Boudreau W, Cowan CW, Kokonowski C, Oberteuffer K, and Yohay K (1993). Offense produced by chemical stimulation of the anterior hypothalamus of the rat. Physiol. Behav 53, 1127–1132. [DOI] [PubMed] [Google Scholar]
- Biro L, Sipos E, Bruzsik B, Farkas I, Zelena D, Balazsfi D, Toth M, and Haller J (2018). Task division within the prefrontal cortex: distinct neuron populations selectively control different aspects of aggressive behavior via the hypothalamus. J. Neurosci 38, 4065–4075. [DOI] [PMC free article] [PubMed] [Google Scholar]
- Blanchard RJ, and Blanchard DC (1989). Attack and defense in rodents as ethoexperimental models for the study of emotion. Prog. Neuropsychopharmacol. Biol. Psychiatry 13 (Suppl), S3–S14. [DOI] [PubMed] [Google Scholar]
- Blanchard RJ, O’Donnell V, and Blanchard DC (1979). Attack and defensive behaviors in the albino mouse. Aggress. Behav 5, 341–352. [Google Scholar]
- Chen TW, Wardill TJ, Sun Y, Pulver SR, Renninger SL, Baohan A, Schreiter ER, Kerr RA, Orger MB, Jayaraman V, et al. (2013). Ultrasensitive fluorescent proteins for imaging neuronal activity. Nature 499, 295–300. [DOI] [PMC free article] [PubMed] [Google Scholar]
- Cui G, Jun SB, Jin X, Pham MD, Vogel SS, Lovinger DM, and Costa RM (2013). Concurrent activation of striatal direct and indirect pathways during action initiation. Nature 494, 238–242. [DOI] [PMC free article] [PubMed] [Google Scholar]
- Depaulis A, and Vergnes M (1985). Elicitation of conspecific attack or defense in the male rat by intraventricular injection of a GABA agonist or antagonist. Physiol. Behav 35, 447–453. [DOI] [PubMed] [Google Scholar]
- Depaulis A, Bandler R, and Vergnes M (1989). Characterization of pretentorial periaqueductal gray matter neurons mediating intraspecific defensive behaviors in the rat by microinjections of kainic acid. Brain Res 486, 121–132. [DOI] [PubMed] [Google Scholar]
- Falkner AL, Dollar P, Perona P, Anderson DJ, and Lin D (2014). Decoding ventromedial hypothalamic neural activity during male mouse aggression. J. Neurosci 34, 5971–5984. [DOI] [PMC free article] [PubMed] [Google Scholar]
- Falkner AL, Grosenick L, Davidson TJ, Deisseroth K, and Lin D (2016). Hypothalamic control of male aggression-seeking behavior. Nat. Neurosci 19, 596–604. [DOI] [PMC free article] [PubMed] [Google Scholar]
- Ferris CF, Melloni RH Jr., Koppel G, Perry KW, Fuller RW, and Delville Y (1997). Vasopressin/serotonin interactions in the anterior hypothalamus control aggressive behavior in golden hamsters. J. Neurosci 17, 4331–4340. [DOI] [PMC free article] [PubMed] [Google Scholar]
- Goodson JL, Kelly AM, Kingsbury MA, and Thompson RR (2012). An aggression-specific cell type in the anterior hypothalamus of finches. Proc. Natl. Acad. Sci. USA 109, 13847–13852. [DOI] [PMC free article] [PubMed] [Google Scholar]
- Gunaydin LA, Grosenick L, Finkelstein JC, Kauvar IV, Fenno LE, Adhikari A, Lammel S, Mirzabekov JJ, Airan RD, Zalocusky KA, et al. (2014). Natural neural projection dynamics underlying social behavior. Cell 157, 1535–1551. [DOI] [PMC free article] [PubMed] [Google Scholar]
- Halász J, Liposits Z, Kruk MR, and Haller J (2002). Neural background of glucocorticoid dysfunction-induced abnormal aggression in rats: involvement of fear- and stress-related structures. Eur. J. Neurosci 15, 561–569. [DOI] [PubMed] [Google Scholar]
- Haller J, Tóth M, Halasz J, and De Boer SF (2006). Patterns of violent aggression-induced brain c-fos expression in male mice selected for aggressiveness. Physiol. Behav 88, 173–182. [DOI] [PubMed] [Google Scholar]
- Hashikawa K, Hashikawa Y, Tremblay R, Zhang J, Feng JE, Sabol A, Piper WT, Lee H, Rudy B, and Lin D (2017). Esr1+ cells in the ventromedial hypothalamus control female aggression. Nat. Neurosci 20, 1580–1590. [DOI] [PMC free article] [PubMed] [Google Scholar]
- Kollack-Walker S, Watson SJ, and Akil H (1997). Social stress in hamsters: defeat activates specific neurocircuits within the brain. J. Neurosci 17, 8842–8855. [DOI] [PMC free article] [PubMed] [Google Scholar]
- Lee H, Kim DW, Remedios R, Anthony TE, Chang A, Madisen L, Zeng H, and Anderson DJ (2014). Scalable control of mounting and attack by Esr1+ neurons in the ventromedial hypothalamus. Nature 509, 627–632. [DOI] [PMC free article] [PubMed] [Google Scholar]
- Lin D, Boyle MP, Dollar P, Lee H, Lein ES, Perona P, and Anderson DJ (2011). Functional identification of an aggression locus in the mouse hypothalamus. Nature 470, 221–226. [DOI] [PMC free article] [PubMed] [Google Scholar]
- Mitra SW, Hoskin E, Yudkovitz J, Pear L, Wilkinson HA, Hayashi S, Pfaff DW, Ogawa S, Rohrer SP, Schaeffer JM, et al. (2003). Immunolocalization of estrogen receptor beta in the mouse brain: comparison with estrogen receptor alpha. Endocrinology 144, 2055–2067. [DOI] [PubMed] [Google Scholar]
- Mos J, Kruk MR, Vanderpoel AM, and Meelis W (1982). Aggressive-behavior induced by electrical-stimulation in the midbrain central gray of male-rats. Aggress. Behav 8, 261–284. [Google Scholar]
- Mos J, Lammers JHCM, Vanderpoel AM, Bermond B, Meelis W, and Kruk MR (1983). Effects of midbrain central gray lesions on spontaneous and electrically induced aggression in the rat. Aggress. Behav 9, 133–155. [Google Scholar]
- Motta SC, Goto M, Gouveia FV, Baldo MV, Canteras NS, and Swanson LW (2009). Dissecting the brain’s fear system reveals the hypothalamus is critical for responding in subordinate conspecific intruders. Proc. Natl. Acad. Sci. USA 106, 4870–4875. [DOI] [PMC free article] [PubMed] [Google Scholar]
- Musatov S, Chen W, Pfaff DW, Kaplitt MG, and Ogawa S (2006). RNAi-mediated silencing of estrogen receptor alpha in the ventromedial nucleus of hypothalamus abolishes female sexual behaviors. Proc. Natl. Acad. Sci. USA 103, 10456–10460. [DOI] [PMC free article] [PubMed] [Google Scholar]
- Pan Y, Xu L, Young KA, Wang Z, and Zhang Z (2010). Agonistic encounters and brain activation in dominant and subordinate male greater long-tailed hamsters. Horm. Behav 58, 478–484. [DOI] [PMC free article] [PubMed] [Google Scholar]
- Risold PY, Canteras NS, and Swanson LW (1994). Organization of projections from the anterior hypothalamic nucleus: a Phaseolus vulgaris-leucoagglutinin study in the rat. J. Comp. Neurol 348, 1–40. [DOI] [PubMed] [Google Scholar]
- Sakurai K, Zhao S, Takatoh J, Rodriguez E, Lu J, Leavitt AD, Fu M, Han BX, and Wang F (2016). Capturing and manipulating activated neuronal ensembles with CANE delineates a hypothalamic social-fear circuit. Neuron 92, 739–753. [DOI] [PMC free article] [PubMed] [Google Scholar]
- Siegel A, Roeling TAP, Gregg TR, and Kruk MR (1999). Neuropharmacology of brain-stimulation-evoked aggression. Neurosci. Biobehav. Rev 23, 359–389. [DOI] [PubMed] [Google Scholar]
- Silva BA, Mattucci C, Krzywkowski P, Murana E, Illarionova A, Grinevich V, Canteras NS, Ragozzino D, and Gross CT (2013). Independent hypothalamic circuits for social and predator fear. Nat. Neurosci 16, 1731–1733. [DOI] [PMC free article] [PubMed] [Google Scholar]
- Simerly RB, and Swanson LW (1986). The organization of neural inputs to the medial preoptic nucleus of the rat. J. Comp. Neurol 246, 312–342. [DOI] [PubMed] [Google Scholar]
- Simerly RB, and Swanson LW (1988). Projections of the medial preoptic nucleus: a Phaseolus vulgaris leucoagglutinin anterograde tract-tracing study in the rat. J. Comp. Neurol 270, 209–242. [DOI] [PubMed] [Google Scholar]
- Spiteri T, Musatov S, Ogawa S, Ribeiro A, Pfaff DW, and Agmo A (2010). The role of the estrogen receptor alpha in the medial amygdala and ventromedial nucleus of the hypothalamus in social recognition, anxiety and aggression. Behav. Brain Res 210, 211–220. [DOI] [PubMed] [Google Scholar]
- Takahashi LK, and Blanchard RJ (1982). Attack and defense in laboratory and wild Norway and black rats. Behav. Processes 7, 49–62. [DOI] [PubMed] [Google Scholar]
- Valentinuzzi VS, Kolker DE, Vitaterna MH, Shimomura K, Whiteley A, Low-Zeddies S, Turek FW, Ferrari EA, Paylor R, and Takahashi JS (1998). Automated measurement of mouse freezing behavior and its use for quantitative trait locus analysis of contextual fear conditioning in (BALB/cJ × C57BL/6J)F2 mice. Learn. Mem 5, 391–403. [PMC free article] [PubMed] [Google Scholar]
- Wang L, Chen IZ, and Lin D (2015). Collateral pathways from the ventromedial hypothalamus mediate defensive behaviors. Neuron 85, 1344–1358. [DOI] [PMC free article] [PubMed] [Google Scholar]
- Yang CF, Chiang MC, Gray DC, Prabhakaran M, Alvarado M, Juntti SA, Unger EK, Wells JA, and Shah NM (2013). Sexually dimorphic neurons in the ventromedial hypothalamus govern mating in both sexes and aggression in males. Cell 153, 896–909. [DOI] [PMC free article] [PubMed] [Google Scholar]
- Yang T, Yang CF, Chizari MD, Maheswaranathan N, Burke KJ Jr., Borius M, Inoue S, Chiang MC, Bender KJ, Ganguli S, and Shah NM (2017). Social control of hypothalamus-mediated male aggression. Neuron 95, 955–970.e4. [DOI] [PMC free article] [PubMed] [Google Scholar]
Associated Data
This section collects any data citations, data availability statements, or supplementary materials included in this article.
Supplementary Materials
Data Availability Statement
Custom MATLAB codes used for data analysis are available upon request to Lead Contact, Dayu Lin (dayu.lin@nyulangone.org).