Abstract
This study considers the response of household electricity consumption to social nudges during peak load events. Our investigation considers two social nudges. The first targets conservation during peak load events, while the second promotes aggregate conservation. Using data from a natural field experiment with 42,100 households, we find that both social nudges reduce peak load electricity consumption by 2 to 4% when implemented in isolation and by nearly 7% when implemented in combination. These findings suggest an important role for social nudges in the regulation of electricity markets and a limited role for crowd out effects.
Keywords: energy, nudge, experiment, economics, conservation
Economists have traditionally advocated for market-based regulation to promote the conservation of natural resources (1–4). However, an important series of studies shows that interventions based on insights from social psychology and sociology, so-called social nudges, can be more cost-effective than market-based regulatory instruments (5, 6). Yet, existing work on social nudges has exclusively evaluated their effectiveness in isolation. While this research has led to tremendous insight, it is unclear whether and how one can use the results from such studies to inform the decisions of a policymaker tasked with selecting a portfolio of regulatory instruments to achieve multiple policy objectives. There is little empirical evidence exploring the effectiveness of nudges within this broader context of multiple instruments and objectives.
In this study, we explore whether social nudges succumb to crowd out effects. Such effects have important consequences for policy. For example, if social nudges are susceptible to crowd out effects, then earlier studies may overstate the effect of social nudges when included as part of a portfolio of regulatory instruments based upon behavioral insights. Despite the policy importance of this question, existent research offers little guidance on the nature and extent of crowd out in prosocial behavior. For example, research in social psychology finds that prosocial behavior can increase (7) or decrease (8) if the researcher has already made a request of the decision maker. Similarly, another strand of research in social psychology finds that prosocial choices in one time period can cause decision makers to behave more or less selfishly in subsequent time periods (9, 10).
With an eye toward policy consequences, we set forth to explore whether the effectiveness of a social nudge is attenuated by the earlier receipt of a distinct social nudge. Using a natural field experiment, we assess the question of crowd out by estimating the effect of two social nudges in isolation and combination. Both nudges use the psychological concept of a social comparison, where the choices of a nudge’s recipient are compared with the behavior of other households (11). Although we focus on energy conservation, social comparisons have been applied across a broad spectrum of behaviors, including voter participation (12), charitable giving (13, 14), and tax compliance (15), among others. The first nudge, which we call the peak energy report (PER), targets household electricity consumption during peak load events that periodically occur when demand for electricity is high. The closest analog to the PER that has been studied is the nudge examined in ref. 16, which utilizes moral suasion instead of social comparison to promote conservation during peak load events. Efforts to curb peak load feature prominently in energy policy because there generally is a mismatch between wholesale and retail prices within and across days in the energy sector, and moving consumption temporally can have large effects on emissions and social welfare (17–19). Studies targeting peak load typically focus on the consequences of price changes (20–22). The second nudge, the home energy report (HER), targets aggregate household electricity consumption and has been studied widely (23–29).
Conducted in Southern California during the summer of 2014, the experiment randomly assigned 42,100 households to receive either no communications, the HER, the PER, or both the HER and PER. Combining information on treatment assignment with more than 30 million observations of hourly household electricity consumption, we identify the conservation effect of each social nudge in isolation and in combination.
Our analysis focuses on estimating the extent to which the HER crowds out the effect of the PER during three peak load events that occurred over a 2-mo period in the summer of 2014. To assess crowd out, we relate the effect of receiving both social nudges during these peak load events to the sum of the conservation effects caused by the HER and PER treatments in isolation. If the combined effect is less than the sum of the isolated effects, then receipt of a social nudge crowds out the effectiveness of a subsequent social nudge.
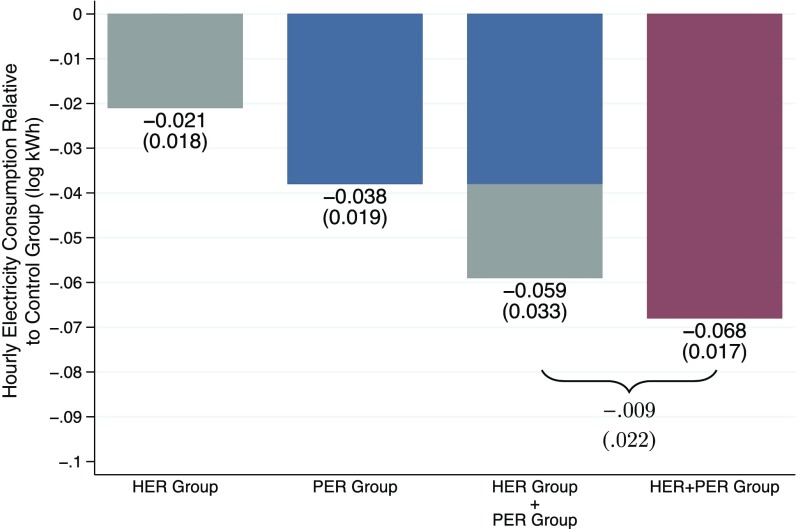
We find that receipt of the PER causes a 3.8% reduction in electricity consumption during a peak load event and receipt of the HER causes a 2.1% reduction. When received in combination, the two social nudges cause households to reduce their electricity consumption by 6.8%. To put these effects into perspective, the price of electricity would have to be increased by nearly 70% during peak load events to achieve the electricity savings of receiving both the HER and PER. Experimental variation in the price of electricity during peak load events finds an own-price elasticity of −0.1 (16, 20–22). Thus, to achieve the same reductions in consumption caused by the isolated effect of the HER and PER, prices during peak load events would have to be raised by 20 to 40%. To achieve the reductions caused by the combined effect of the HER and PER, electricity prices would have to be increased by nearly 70%. Furthermore, these findings suggest that the effect of the PER is not crowded out when households are already assigned to receive the HER. While we make no claim that these estimates will generalize across locations and domains, they provide evidence on the dynamics of nudging to achieve multiple policy targets in the market for electricity.
The remainder of this study is organized as follows. First, we discuss the experimental design in greater detail and assess balance. Second, we present results, after which we conclude.
Experimental Design
Our data come from a natural field experiment designed and implemented by Opower with 42,100 households serviced by a water and power utility in Southern California. The experiment was implemented in two phases, which are summarized in Fig. 1. In the first phase, households were randomly assigned to a treatment or control group, where the treatment group periodically received a HER. In the second phase, the same households were cross-randomized into a treatment group that received a social nudge called the PER that mimics the HER but targets consumption during peak load events or into a control group. Thus, each household was assigned randomly to one of four mutually exclusive groups:
-
i)
HER+PER group: received both the HER and PER
-
ii)
HER group: received only the HER
-
iii)
PER group: received only the PER
-
iv)
Control group: received no correspondence
Fig. 1.
Overview of treatment assignment in the experiment.
Henceforth, we refer to the reports themselves as the HER and PER and households that received these reports as members of the HER group, PER group, or HER+PER group.
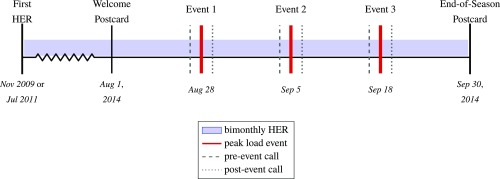
The timing of the experiment is summarized in Fig. 2 and went as follows. Households in the HER group and HER+PER group received the HER bimonthly beginning in either 2009 or 2011. Then, at the start of August 2014, households in the PER group and HER+PER group received a notification about peak load event days in the future, which can be seen in SI Appendix, Fig. S1. Thereafter, households in the PER group and HER+PER group received the PER on peak load event days that occurred during August and September of 2014.
Fig. 2.
Overview of timeline and procedures in the experiment. The random assignment to a bimonthly HER took place in November 2009 or July 2011. In the summer of 2014, households were randomly assigned to the PER within each treatment arm. The PER is delivered around 3 d with peak load events in the summer of 2014. Each PER consists of three elements: (i) a preevent call on the day before the event, (ii) the peak load event day itself, and (iii) a postevent call on the following day. Additional documents include a welcome postcard (SI Appendix, Fig. S1) on August 1 and an end-of-season postcard (SI Appendix, Fig. S2) on September 30. HERs are delivered every other month throughout the period.
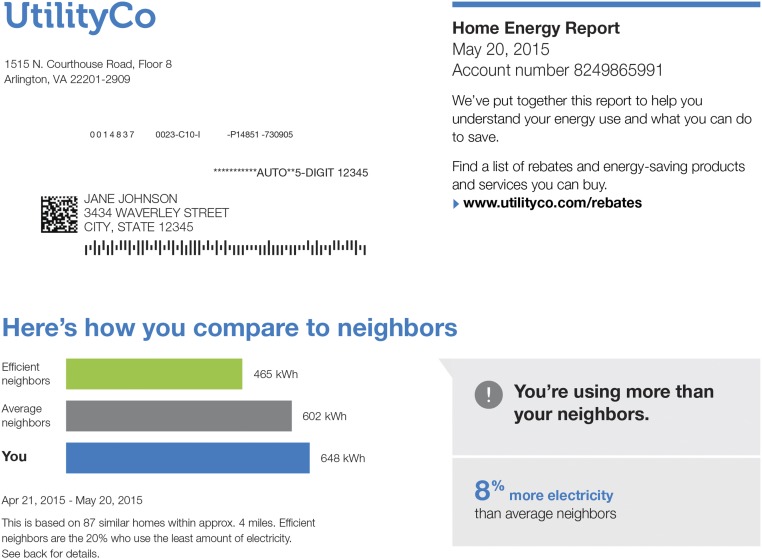
The contents of the HER are illustrated in Fig. 3 with an example report. In the report, electricity consumption by the recipient is compared with the average usage of households in the recipient’s neighborhood group and with the average consumption of the efficient homes in that same group, where efficient homes are defined as homes in the bottom 20% of usage in a neighborhood group. The HER also contains several other components, such as historical usage data, conservation tips, and information about utility rebate programs. An example of a complete report is provided in SI Appendix, Fig. S3.
Fig. 3.
Example social comparison module of the HER. A full report is provided in SI Appendix, Fig. S3.
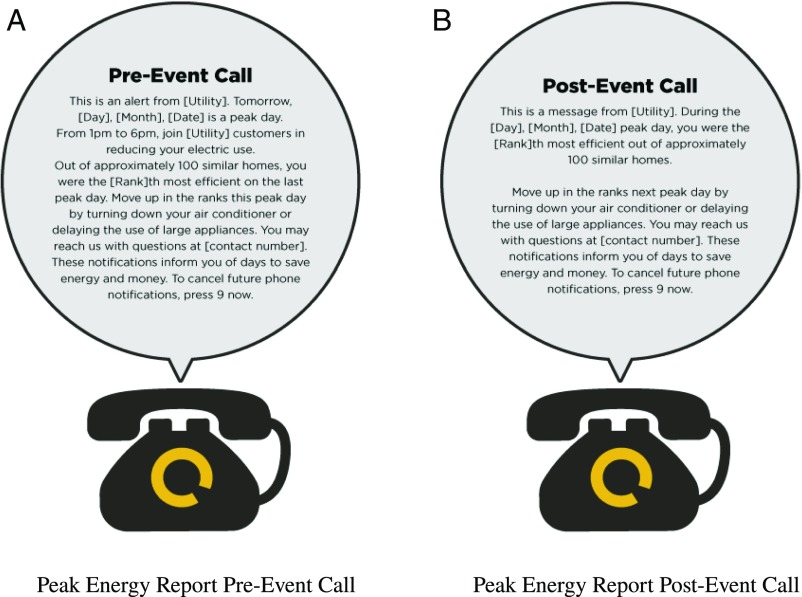
An example also helps illustrate the contents of the PER in Fig. 4. To allow for content generation and delivery on short notice of a peak load event day, households received the PER via an automated telephone call to the main account holder. Some customers also received an email version that contained similar content. The email was delivered to the main contact email address if an email address was on file at the beginning of August 2014. In our analyses, we control for whether a household received both a telephone call and an email. If the customer did not pick up the telephone, the automated call was left as a voice mail. Unfortunately, we do not observe whether a call was answered or if the voice mail was accessed by a customer. Around each event day, Opower made two calls containing information that mimics the HER’s social comparison module. On the afternoon of the day immediately preceding a peak event, customers were notified of the upcoming event, the hours to conserve electricity, a social comparison of their electricity consumption, and conservation tips. [Customers in the top five of their comparison group received calls in which this achievement was specifically highlighted (SI Appendix, Fig. S4). All other content was identical. Furthermore, because the social rank was based on past peak event behavior, social rank information was unavailable for the first call.] Then, on the day immediately following the peak load event, customers received another call that provided a social comparison of their electricity consumption behavior during the peak load event. Fig. 4 provides example scripts for these calls. In the summer of 2014, peak load events were called from 1300 to 1800 hours on August 28, September 5, and September 16.
Fig. 4.
Example telephone scripts of the PER. Households received a preevent telephone call (A) on the day before the peak load event and a postevent telephone call (B) on the day after the peak load event. The scripts of telephone calls that households received on the day of the first peak load event and for households in the top five of their comparison group are provided in SI Appendix, Fig. S4.
In response to these two social nudges, we observe the hourly electricity consumption for all 42,100 households from August 1, 2014 to September 30, 2014. Following Opower’s standard eligibility test, the experiment only contains residential customers who have at least 12 mo of preexperiment consumption data. This rule is intended to ensure that neighborhood comparisons can be constructed reliably, and preexperiment usage is used to balance treatment groups. While we observe a remarkably fine level of consumption data for households in our sample, we do not observe additional cross-sectional covariates that may influence energy usage, such as income or property size. However, given that households are randomized into one of the four treatment groups, we can still identify effects, and the high-frequency nature of the data allow us to control for time-varying and time-invariant effects in the empirical specifications.
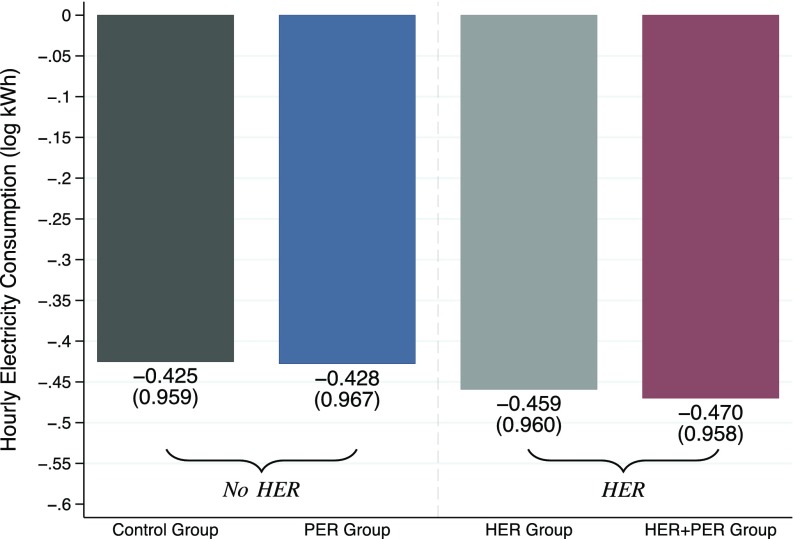
We conclude this section by assessing the validity of the randomization conducted by Opower with a comparison of electricity consumption during the baseline period before the first peak load event. While we observe electricity consumption decisions before the PER is administered, we do not observe the choices of households before their receipt of the HER. As a result, our examination of Opower’s randomization focuses exclusively on assignment to the PER. Fig. 5 presents results from this examination by plotting average electricity consumption in log kilowatt hours (log kWh) for each treatment group. Therein, we see that before the PER is administered, households assigned to the control group and PER group consume indistinguishable levels of electricity in terms of log kWh. Furthermore, we see the same relationship holds for households assigned to the HER group and HER+PER group. While Fig. 5 just reports the SDs of log kWh for each treatment group, we point readers interested in a more formal test of balance to the results in SI Appendix, Table S1.
Fig. 5.
Treatment balance in log electricity consumption in the baseline period, from August 1–27, 2014, for the peak hours from 1300 to 1800 hours. Bar labels represent the averages, and we report corresponding SDs in parentheses. A more comprehensive set of summary statistics and balance tests is presented in SI Appendix, Table S1.
Additionally, Fig. 5 highlights the effect of the HER on electricity consumption during the baseline period. In particular, comparing the HER group and HER+PER group with the control group, we see the HER caused a 3–4% reduction in electricity consumption. SI Appendix, Table S1B presents a more formal series of estimates of the HER in these two groups, and for both groups, the HER effect is significant at traditional levels of statistical significance.
Results
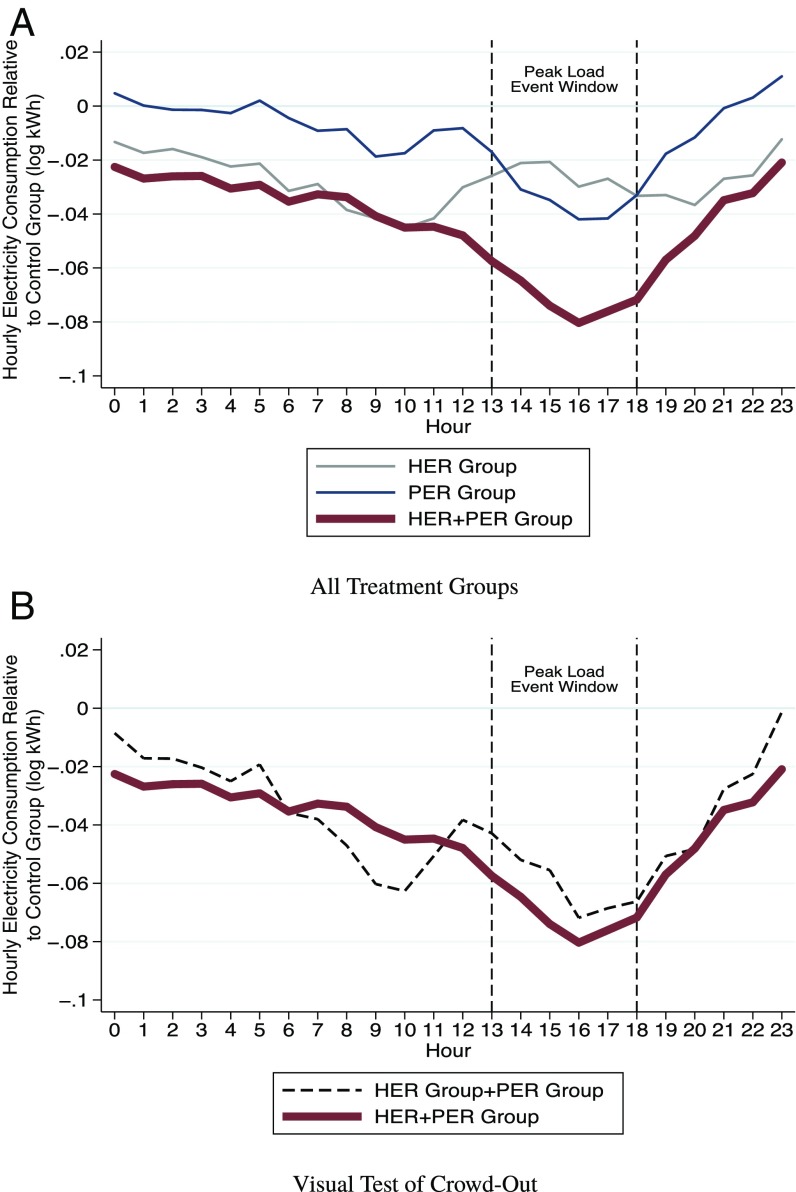
We start our empirical analysis by considering the hourly effect of assignment to each of the treatment groups over the course of the three peak load event days in our sample. Fig. 6A plots these effects in log kWh. Several trends emerge. First, the PER appears to have its intended effect. Households assigned to the PER group and control group start and end their day indistinguishable from each other; however, during the peak load event window, the PER group consumes 2–4% less electricity than the control group. Second, the HER delivers electricity savings over the entire course of the peak load event day, with the HER group consuming about 1–4% less electricity than the control group. Third, combining the HER and PER leads to the best of both worlds, with a 2–4% effect for the HER+PER group at the start and end of a peak load event day and savings as large as 8% during the peak load event window. Fig. 6B presents a visual depiction of our test for crowd out by comparing the effect for the HER+PER group against the sum of the effects for the HER group and the PER group. The extent to which these two lines track one another is remarkable, suggesting little in the way of crowd out. Finally, we point readers to SI Appendix, Fig. S5 to see the same presentation of electricity consumption in the week leading up to the first peak load event.
Fig. 6.
(A) We plot the differences in the log of electricity use between each treatment group and the control group on the 3 d with peak load events. (B) We compare the difference between the control group and the HER+PER group with the summation of the individual differences between the control group and the HER group and PER group. Vertical lines indicate the peak hours from 1300 to 1800 hours.
To formalize the results that emerge in Fig. 6, we estimate the effect of assignment to each of the treatment groups using ordinary least squares. To conduct inference on these estimates, we utilize SEs that are robust to heteroskedasticity and arbitrary within household autocorrelations (30). Furthermore, to improve precision, these estimates control for each hour in the sample, the HER deployment wave, and the medium used to communicate the PER.
Fig. 7 plots the estimated treatment effects and their SEs. (The full set of estimates from our empirical model is provided in SI Appendix, Table S2. Furthermore, the estimated treatment effects with 95% confidence intervals are plotted in SI Appendix, Fig. S7.) Across the estimates, we see that the trends observed in Fig. 6 remain, with the HER group and PER group reducing their electricity consumption by 2.1% and 3.8%, respectively, and the HER+PER group consumption falling by 6.8%. The estimated effect of the HER lines up well with other estimates in the literature, which report HER effects ranging from 1–3% (23–29). While the PER has not been previously assessed, its effect is smaller than the peak load social nudge studied in ref. 16, which assesses a social nudge that utilizes moral suasion instead of social comparison. Over the first three peak load events in their sample (16), these authors find their nudge causes an 8.3% reduction in peak load electricity consumption; however, this effect rapidly attenuates after the first three event days.
Fig. 7.
Average treatment effects during peak hours (1300–1800 hours) from a regression of log electricity use on treatment indicators and controls for each hour in the sample, the HER deployment wave, and the medium used to communicate the PER. We plot the total treatment effects on the 3 d with peak load events in the summer of 2014. Bar labels represent the point estimates, and we report corresponding SEs in parentheses. We also test the hypothesis of no crowd out by comparing the treatment effect of the HER+PER group and a summation of the treatment effects of the HER group and the PER group. We report the difference and corresponding SE.
Pricing experiments provide another useful benchmark upon which to relate the estimated effects in Fig. 7. For example, several researchers (16, 20–22) experimentally vary the price of electricity during peak load events and find an own-price elasticity around −0.1. To mirror reductions in consumption caused by the isolated effect of the HER and PER, prices during peak load events would have to be increased by 20–40%. Furthermore, to match the reductions caused by the combined effect of the HER and PER, electricity prices would have to be raised by nearly 70%. Interestingly, these price effects implied by the effects of the HER and PER line up well with the price changes induced in critical peak pricing experiments (16, 20–22).
Fig. 7 also presents results of our investigation into the crowd out effects of social nudges. There, we see that the effect of the HER and PER for the HER+PER group exceeds the sum of the HER and PER effects for the HER group and the PER group. If anything, this comparison suggests crowd in, as opposed to crowd out; however, the difference between the two estimates is not statistically distinguishable from a null effect, suggesting no crowd out effect for households in our experiment.
Before concluding, we describe five additional results from our empirical investigation, which are featured in SI Appendix. First, we consider whether the effects described above are robust to changing the outcome variable to electricity consumption in kilowatt hours, excluding households that moved during the experiment, allowing our hour by hour control variables to vary by HER deployment wave, and including household fixed effects. Across these robustness checks, which can be seen in SI Appendix, Tables S3–S6, we see that our main conclusions hold. Second, we consider whether the PER causes overall reductions in electricity consumption or merely prompts households to intertemporally substitute their electricity consumption. Such substitution effects have been found in response to peak load pricing experiments (16, 20–22); however, columns 2 and 3 in SI Appendix, Tables S2C, S7C, and S8C show that no such dynamic exists with the PER group in our data. Third, SI Appendix, Table S8 considers whether the effect of the PER persists after the intervention ends. Therein, we find no evidence of the treatments effects persisting in our data. Fourth, we compare the treatment effects for households above and below our sample’s median baseline electricity consumption. SI Appendix, Table S9 reports that there is no heterogeneity driving our main conclusions. Fifth, we consider the heterogeneity over the peak load event days in our sample. SI Appendix, Fig. S6 shows that there is no clear trend that emerges, especially given the imprecision in estimates. (Additionally, these same estimates are plotted with 95% confidence intervals in SI Appendix, Fig. S8.)
Conclusion
In this study, we consider the role of two different social nudges in the market for electricity during peak load events. Our investigation focuses on the conservation effect of these social nudges in isolation and in combination. We find that social nudges play an important role in household demand for electricity during peak load events, causing a 2.1–6.8% reduction in consumption, depending on implementation. Furthermore, our investigation also considers the extent to which there may be hidden costs, or crowd out effects, that could arise among households that receive both social nudges. We find no evidence of crowd out. If anything, our data suggest a complementarity or crowd in effect, as the effect of the two social nudges in combination marginally exceeds the combined effect of the two social nudges in isolation. It would be naive, however, to assume that this dynamic would hold over any possible combination of nudges. Further research will be needed to uncover the scale at which social nudging leads to diminishing marginal returns and whether the types of behaviors that are being nudged influence how social nudges interact. Moreover, our results suggest that more research is warranted to understand the underlying mechanisms predicting crowding in and out, as they could have large implications relative to future policies aimed at securing a sustainable energy system. Finally, we have only considered crowd out in terms of treatment effects. Given the importance of welfare effects that are not captured by a treatment effect estimate, future work should consider extending the approach of ref. 31 for assessing crowd out in social nudges.
Supplementary Material
Acknowledgments
We thank Justin Holz; David Novgorodsky; and participants of the Economic Science Association North America Conference 2016, the Advances in Field Experiments Conference 2016, the Association of Environmental and Resource Economists Summer Conference 2017, and the Northeastern Agricultural and Resource Economics Association Annual Meeting 2017 for helpful comments.
Footnotes
The authors declare no conflict of interest.
This paper results from the Arthur M. Sackler Colloquium of the National Academy of Sciences, “Economics, Environment, and Sustainable Development,” held January 17–18, 2018, at the Arnold and Mabel Beckman Center of the National Academies of Sciences and Engineering in Irvine, CA. The complete program and video recordings of most presentations are available on the NAS website at www.nasonline.org/economics-environment-and.
This article is a PNAS Direct Submission.
This article contains supporting information online at www.pnas.org/lookup/suppl/doi:10.1073/pnas.1802874115/-/DCSupplemental.
References
- 1.Boiteux M. Peak-load pricing. J Bus. 1960;33:157–179. [Google Scholar]
- 2.Kahn AE. The Economics of Regulation: Principles and Institutions. Vol 1 Wiley; New York: 1970. [Google Scholar]
- 3.Montgomery WD. Markets in licenses and efficient pollution control programs. J Econ Theory. 1972;5:395–418. [Google Scholar]
- 4.Baumol WJ, Oates WE. The Theory of Environmental Policy. Cambridge Univ Press; Cambridge, UK: 1988. [Google Scholar]
- 5.Allcott H, Mullainathan S. Energy. Behavior and energy policy. Science. 2010;327:1204–1205. doi: 10.1126/science.1180775. [DOI] [PubMed] [Google Scholar]
- 6.Benartzi S, et al. Should governments invest more in nudging? Psychol Sci. 2017;28:1041–1055. doi: 10.1177/0956797617702501. [DOI] [PMC free article] [PubMed] [Google Scholar]
- 7.Freedman JL, Fraser SC. Compliance without pressure: The foot-in-the-door technique. J Pers Soc Psychol. 1966;4:195–202. doi: 10.1037/h0023552. [DOI] [PubMed] [Google Scholar]
- 8.Cann A, Sherman SJ, Elkes R. Effects of initial request size and timing of a second request on compliance: The foot in the door and the door in the face. J Pers Soc Psychol. 1975;32:774–782. doi: 10.1037//0022-3514.32.5.774. [DOI] [PubMed] [Google Scholar]
- 9.Monin B, Miller DT. Moral credentials and the expression of prejudice. J Pers Soc Psychol. 2001;81:33–43. [PubMed] [Google Scholar]
- 10.Zhong C-B, Liljenquist K. Washing away your sins: Threatened morality and physical cleansing. Science. 2006;313:1451–1452. doi: 10.1126/science.1130726. [DOI] [PubMed] [Google Scholar]
- 11.Festinger L. A theory of social comparison processes. Hum Relat. 1954;7:117–140. [Google Scholar]
- 12.Gerber AS, Green DP, Larimer CW. Social pressure and voter turnout: Evidence from a large-scale field experiment. Am Polit Sci Rev. 2008;102:33–48. [Google Scholar]
- 13.Frey BS, Meier S. Social comparisons and pro-social behavior: Testing ‘conditional cooperation’ in a field experiment. Am Econ Rev. 2004;94:1717–1722. [Google Scholar]
- 14.Shang J, Croson R. A field experiment in charitable contribution: The impact of social information on voluntary provision of public goods. Econ J (Lond) 2009;119:1422–1439. [Google Scholar]
- 15.Hallsworth M, List JA, Metcalfe RD, Vlaev I. The behavioralist as tax collector: Using natural field experiments to enhance tax compliance. J Public Econ. 2017;148:14–31. [Google Scholar]
- 16.Ito K, Ida T, Tanaka M. Moral suasion and economic incentives: Field experimental evidence from energy demand. Am Econ J Econ Policy. 2018;10:240–267. [Google Scholar]
- 17.Borenstein S. The trouble with electricity markets: Understanding California’s restructuring disaster. J Econ Perspect. 2002;16:191–211. [Google Scholar]
- 18.Borenstein S. The long-run efficiency of real-time electricity pricing. Energy J. 2005;26:93–116. [Google Scholar]
- 19.Joskow PL. Creating a smarter U.S. electricity grid. J Econ Perspect. 2012;26:29–48. [Google Scholar]
- 20.Wolak FA. Do residential customers respond to hourly prices? Evidence from a dynamic pricing experiment. Am Econ Rev. 2011;101:83–87. [Google Scholar]
- 21.Faruqui A, Sergici S. Household response to dynamic pricing of electricity: A survey of 15 experiments. J Regul Econ. 2010;38:193–225. [Google Scholar]
- 22.Jessoe K, Rapson D. Knowledge is (less) power: Experimental evidence from residential energy use. Am Econ Rev. 2014;104:1417–1438. [Google Scholar]
- 23.Allcott H. Social norms and energy conservation. J Public Econ. 2011;95:1082–1095. [Google Scholar]
- 24.Allcott H. Site selection bias in program evaluation. Q J Econ. 2015;130:1117–1165. [Google Scholar]
- 25.Costa DL, Kahn ME. Energy conservation ‘nudges’ and environmentalist ideology: Evidence from a randomized residential electricity field experiment. J Eur Econ Assoc. 2013;11:680–702. [Google Scholar]
- 26.Ayres I, Raseman S, Shih A. Evidence from two large field expeirments that peer comparison feedback can reduce residential energy usage. J Law Econ Organ. 2013;29:992–1022. [Google Scholar]
- 27.Allcott H, Rogers T. The short-run and long-run effects of behavioral interventions: Experimental evidence from energy conservation. Am Econ Rev. 2014;104:3003–3037. [Google Scholar]
- 28.List JA, Metcalfe RD, Price MK, Rundhammer F. 2017 doi: 10.1073/pnas.1802874115. Harnessing policy complementarities to conserve energy: Evidence from a natural field experiment (National Bureau of Economic Research, Cambridge, MA). Available at www.nber.org/papers/w23355. Accessed July 26, 2018. [DOI] [PMC free article] [PubMed]
- 29.Brandon A, Ferraro PJ, Metcalfe RD, Price MK, Rundhammer F. 2017 Do the effects of social nudges persist? Theory and evidence from 38 natural field experiments (National Bureau of Economic Research, Cambridge, MA). Available at www.nber.org/papers/w23277. Accessed July 26, 2018.
- 30.Cameron AC, Miller DL. A practitioner’s guide to cluster-robust inference. J Hum Resour. 2015;50:317–372. [Google Scholar]
- 31. Allcott H, Kessler JB, The welfare effects of nudges: A case study of energy use social comparisons. Am Econ J Appl Econ, in press.
Associated Data
This section collects any data citations, data availability statements, or supplementary materials included in this article.


