Significance
Lipid vesicles such as liposomes are widely present in biological systems and drug delivery applications. Numerous studies have focused on their roles in intercellular communication, signaling, and trafficking. Little is known, however, about the correlation between temperature and transport rate of these vesicles in biological media. Here, we report a temperature- and rigidity-mediated rapid transport mechanism by which liposomes attain optimal diffusivity near a phase transition temperature. Remarkably, liposomes with phase transition temperature around the body temperature are observed to overcome multiple biological barriers and show substantial improvement in drug delivery efficacy.
Keywords: lipid nanovesicle, liposome, phase transition temperature, diffusion, biological hydrogels
Abstract
Lipid nanovesicles are widely present as transport vehicles in living organisms and can serve as efficient drug delivery vectors. It is known that the size and surface charge of nanovesicles can affect their diffusion behaviors in biological hydrogels such as mucus. However, how temperature effects, including those of both ambient temperature and phase transition temperature (Tm), influence vehicle transport across various biological barriers outside and inside the cell remains unclear. Here, we utilize a series of liposomes with different Tm as typical models of nanovesicles to examine their diffusion behavior in vitro in biological hydrogels. We observe that the liposomes gain optimal diffusivity when their Tm is around the ambient temperature, which signals a drastic change in the nanovesicle rigidity, and that liposomes with Tm around body temperature (i.e., ∼37 °C) exhibit enhanced cellular uptake in mucus-secreting epithelium and show significant improvement in oral insulin delivery efficacy in diabetic rats compared with those with higher or lower Tm. Molecular-dynamics (MD) simulations and superresolution microscopy reveal a temperature- and rigidity-mediated rapid transport mechanism in which the liposomes frequently deform into an ellipsoidal shape near the phase transition temperature during diffusion in biological hydrogels. These findings enhance our understanding of the effect of temperature and rigidity on extracellular and intracellular functions of nanovesicles such as endosomes, exosomes, and argosomes, and suggest that matching Tm to ambient temperature could be a feasible way to design highly efficient nanovesicle-based drug delivery vectors.
Lipid nanovesicles consisting of a lipid bilayer structure enclosing an aqueous interior are ubiquitous in living cells (1), with examples including endosomes, lysosomes, exosomes, and synaptic vesicles (2, 3). Nanovesicles play many important roles in cell activities including intracellular trafficking (4–6), intercellular transport (7), and communication (8), and they carry proteins, lipids, and nucleic acids around in various biological environments (9, 10). The properties of nanovesicles ensure accurate and efficient transport of “cargo” molecules (11, 12). In particular, rigidity and phase transition of nanovesicles play crucial roles in their transport behavior (13), and these two properties can often be tuned through temperature (14, 15), pressure (16), and composition (17–19).
As a typical model for nanovesicles, synthetic liposomes are promising candidates for drug delivery due to their high biocompatibility and ease of manipulation with respect to size, surface property, and composition (20–22). The stability, size, and shape of liposomes could be modulated by the phase behavior of lipids, which in turn could be adjusted by temperature. Studies have shown that when the ambient temperature is above a phase transition temperature (Tm), the liposome membrane transforms from a solid-like gel phase to a liquid-crystalline phase (23). For example, it has been shown that ThermoDox, a thermosensitive liposome currently under phase III clinical evaluation, could rapidly deliver drugs to a locally heated tumor (∼40–45 °C) while keeping the payload at body temperature (∼37 °C) (24). This suggests that temperature is an important factor that could be modulated for improved drug delivery. In pure solvents and hydrogels, increasing temperature tends to promote the diffusion of rigid nanoparticles (NPs) according to the Stokes–Einstein relation. For deformable liposomes, however, there is currently little knowledge on how temperature affects their diffusion in biological hydrogels.
We synthesized liposomes with different values of phase transition temperature Tm (from −16.0 to 55.0 °C) to evaluate the effect of ambient temperature on their diffusion capacity and therapeutic efficacy. Surprisingly, we observed the existence of an optimal ambient temperature near Tm for liposomal diffusion in biological hydrogels both in vitro and ex vivo. Orally administered, insulin-loaded liposomes with Tm around body temperature generated a prominent hypoglycemic response and ∼11-fold higher absorption than orally administered free insulin in diabetic rats. Using molecular simulations, atomic force microscopy (AFM), and stimulated emission depletion (STED) microscopy, we found that liposomes with Tm around the ambient temperature adopt ellipsoid shapes that facilitate a rapid diffusion mechanism in hydrogels. Above Tm, the deformable liposomes increasingly conform to the polymeric network in the hydrogel, resulting in increased affinity and reduced diffusivity.
Results
Diffusion of Liposomes in Hydrogel at Different Temperatures.
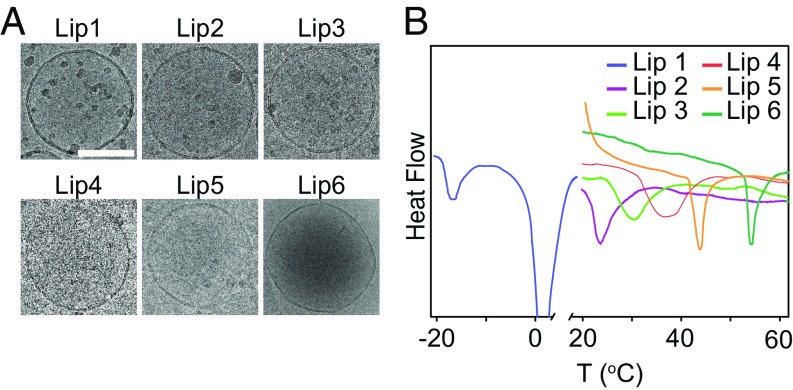
As reported in previous studies, the phase behaviors of the lipid membrane can be tuned by the lipid types. Briefly, the Tm of the lipid membrane increases with chain length and saturation of the lipid tails (25–28). Inspired by these properties, we prepared six kinds of liposomes with different Tm by changing the combination of lipids (denoted as Lip1 to Lip6 with detailed compositions shown in SI Appendix, Table S1). All of the liposomes exhibited a typical unilamellar vesicle structure with bilayer morphology and spherical shape as assessed by cryogenic transmission electron microscopy (cryo-TEM) (Fig. 1A). In addition, these liposomes all had similar hydrodynamic diameters (∼200 nm) and neutral surface charges (SI Appendix, Table S1). We next examined the Tm of these liposomal formulations by differential scanning microcalorimetry and found that the Tm ranged from −16.0 to 55.0 °C (Fig. 1B and SI Appendix, Table S1). For example, Lip1 had the lowest Tm since its main component is unsaturated lipid 1,2-dioleoyl-sn-glycero-3-phosphoethanolamine (DOPE). As the average length of the hydrophobic tail of the lipids increased, which could be achieved by either increasing the percentage of lipids with long tails (e.g., Lip3, Lip4, and Lip5) or changing the component of the liposome (e.g., Lip2 and Lip6), the synthesized liposome would have a higher Tm. In addition, incubating in medium with a pH range from 1.2 to 7.4 revealed that all of the liposomes were stable in particle size and polydispersity [polydispersity index (PDI)] over the investigated time duration (SI Appendix, Fig. S1).
Fig. 1.
Liposomal characterizations. (A) Cryo-TEM images of liposomes. (Scale bar, 100 nm.) (B) Differential scanning calorimetry (DSC) scan of liposomal formulations.
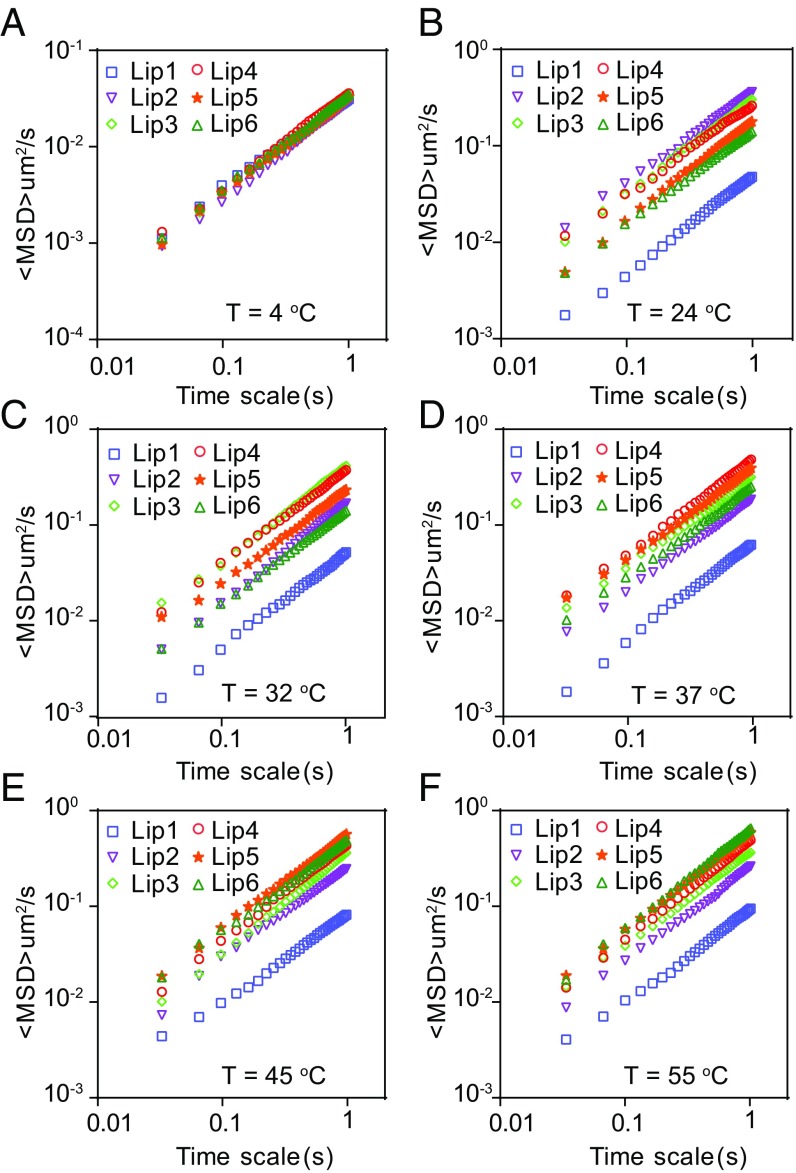
To explore how the temperature influences the diffusion of liposomes in biological hydrogels, we first tracked the movement of liposomes in poly(ethylene oxide) (PEO) hydrogel via multiple-particle tracking at 4, 24, 32, 37, 45, and 55 °C (Fig. 2 and SI Appendix, Figs. S2–S4). Generally, the overall diffusion capacity of liposomes was hindered due to the mesh structure of the PEO hydrogel compared with that in water. At 4 °C, all of the liposomes exhibited confined particle trajectories. However, they displayed Brownian-like trajectories when the temperature rose above 24 °C (SI Appendix, Fig. S2), and the covered diffusion areas increased as the temperature increased from 24 to 55 °C. Interestingly, we observed that there is an optimal temperature for each kind of liposome, that is, liposomes have the highest diffusivity in the hydrogel when the ambient temperature is around their Tm. The ensemble-averaged mean-squared displacement (<MSD>) of each liposome increases as the temperature increases from 4 °C to Tm, above which the diffusivity starts to decrease (Fig. 2). The results showed that at 24, 32, 37, 45, and 55 °C, the liposome possessing the highest diffusivity is Lip2, Lip3, Lip4, Lip5, and Lip6, respectively (Fig. 2 and SI Appendix, Figs. S3 and S4). These results indicated that the ambient temperature plays a key role in the diffusion of liposomes in hydrogels.
Fig. 2.
Mobility of liposomes in PEO hydrogel at different temperatures. Typical MSD values for liposomes plotted against time on log–log scales at (A) 4 °C, (B) 24 °C, (C) 32 °C, (D) 37 °C, (E) 45 °C, and (F) 55 °C, respectively.
Liposome Movement in Rat Intestinal Mucus ex Vivo.
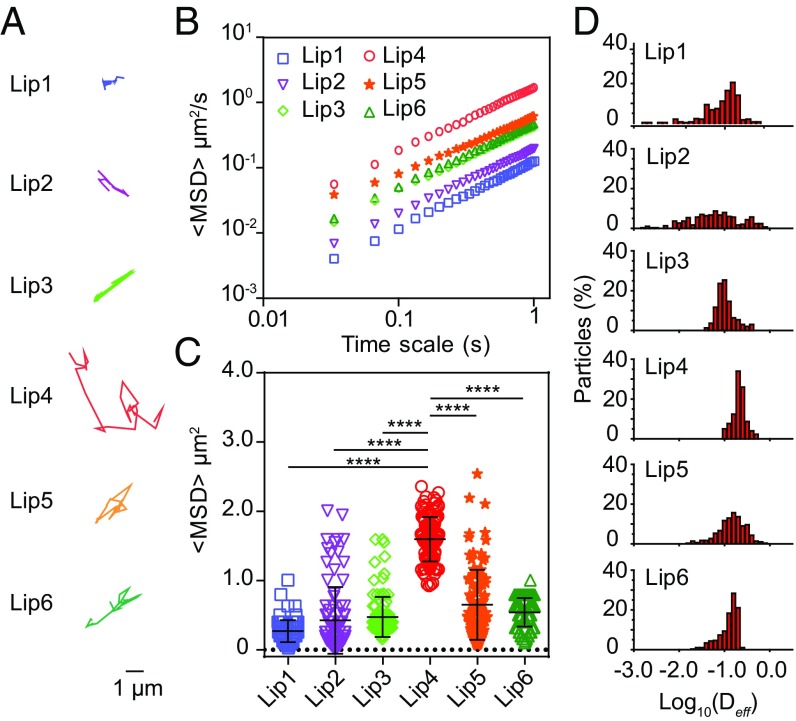
We then investigated the diffusion of liposomes in fresh rat intestinal mucus, a typical example of biological hydrogels (29), to explore their efficacy in oral drug delivery. Representative trajectories are shown in Fig. 3A. The liposome with the highest Tm (e.g., Lip6) moved in a moderate area in mucus. The liposomes with decreased Tm showed increased mobility (e.g., Lip4 and Lip5). However, the liposomes with further decreased Tm showed restricted movement (e.g., Lip1, Lip2, and Lip3). Lip4 displayed the highest diffusion capacity compared with the others. We calculated the MSD on a timescale of 1 s (Fig. 3B) and found that, on average, the MSD of Lip4 is ∼13.4- and 3.5-fold higher than that of Lip1 and Lip6, respectively (Fig. 3C and SI Appendix, Table S1). The distribution of effective diffusivities (Deff) shown in Fig. 3D also demonstrated that Lip4 has the highest diffusivity among all of the other liposomal formulations. Furthermore, to verify that the effect of Tm on the diffusion of liposomes in mucus is lipid composition independent, we synthesized liposomes with a similar Tm but with different lipid compositions (denoted as Lip7, Lip8, and Lip9; SI Appendix, Table S2). We confirmed that liposomes with Tm around the ambient temperature (i.e., 37 °C) displayed superior mucus penetration (SI Appendix, Fig. S5). We also tracked the motion of liposomes in mucus at 4 and 45 °C and obtained results similar to those observed in the PEO hydrogel (SI Appendix, Fig. S6). Altogether, these results confirmed that ambient temperature plays a key role in the diffusion of liposomes across mucus.
Fig. 3.
Mobility of liposomes in fresh rat intestinal mucus at 37 °C. (A) Representative trajectories of particle motion in 1 s. (B) MSD values as a function of time. (C) Typical MSD values for liposomes at 1 s. (D) Distribution of the logarithms of individual particle effective diffusivities on a timescale of 1 s. The data represent three independent experiments, and each experiment tracks 100 particles. The data are shown as the means ± SD (n = 3). **P < 0.01; ****P < 0.0001.
In addition, we also compared the size and Tm effects on the movement of liposomes. Decreasing the size of liposomes resulted in a moderate enhancement of PEGylated liposomal diffusivity (SI Appendix, Fig. S7 and Table S3). Nevertheless, when modulating the Tm of liposomes from 54 to 36 °C, the MSD values gained approximately a 3.5-fold enhancement, suggesting that the diffusion of liposomes in mucus could be significantly improved by tuning the Tm of liposomes.
Liposome Diffusion Mechanisms in Biological Hydrogels.
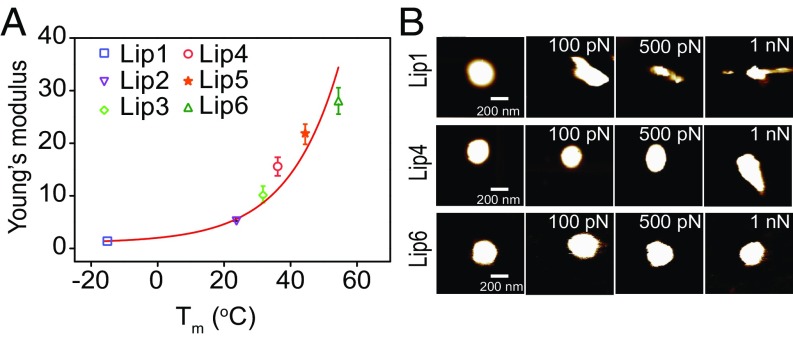
A detailed understanding of the mechanism underlying the diffusion process is critical to the design of effective delivery particles. As mentioned above, the ambient temperature could influence the phase behavior of lipids, that is, at Tm, the lipids undergo a transition from the gel phase to the liquid phase, which would influence the rigidity of the lipid membrane and eventually the deformability of the liposome. To confirm the relationship between Tm and rigidity of the liposome at a certain temperature, an AFM-based approach was conducted to evaluate the rigidities of liposomes with different Tm. Because the effective Young’s modulus is a physical parameter reflecting the deformability of liposomes, we used this parameter to indirectly reflect the rigidity of the liposomes. The results showed that the Young’s moduli of the liposomes increase monotonically with Tm (Fig. 4A) but decrease with the ambient temperature (SI Appendix, Fig. S8). This result indicated that liposomes with high Tm are more difficult to deform than those with low Tm. In particular, the Young’s modulus of Lip6 is ∼15.0- and 1.5-fold higher than those of Lip1 and Lip4, respectively. This result was also confirmed by the topographies of the liposomes with different Tm in response to the loaded force (Fig. 4B). With the increase of the loading force, the liposome with the lowest Tm deforms irregularly (Lip1), while the liposome with the highest Tm maintains a spherical shape (Lip6). Liposomes with intermediate Tm deform into an ellipsoidal shape (Lip4). These results indicate that the rigidity of the liposome is affected by its Tm, which further influences the deformability of the liposome.
Fig. 4.
(A) The Young’s moduli of the liposomes characterized by AFM. The data represent three independent experiments. (B) AFM images of liposomes with different Tm and the corresponding deformation images of the liposomes subjected to forces of different magnitudes. (Scale bar, 200 nm.)
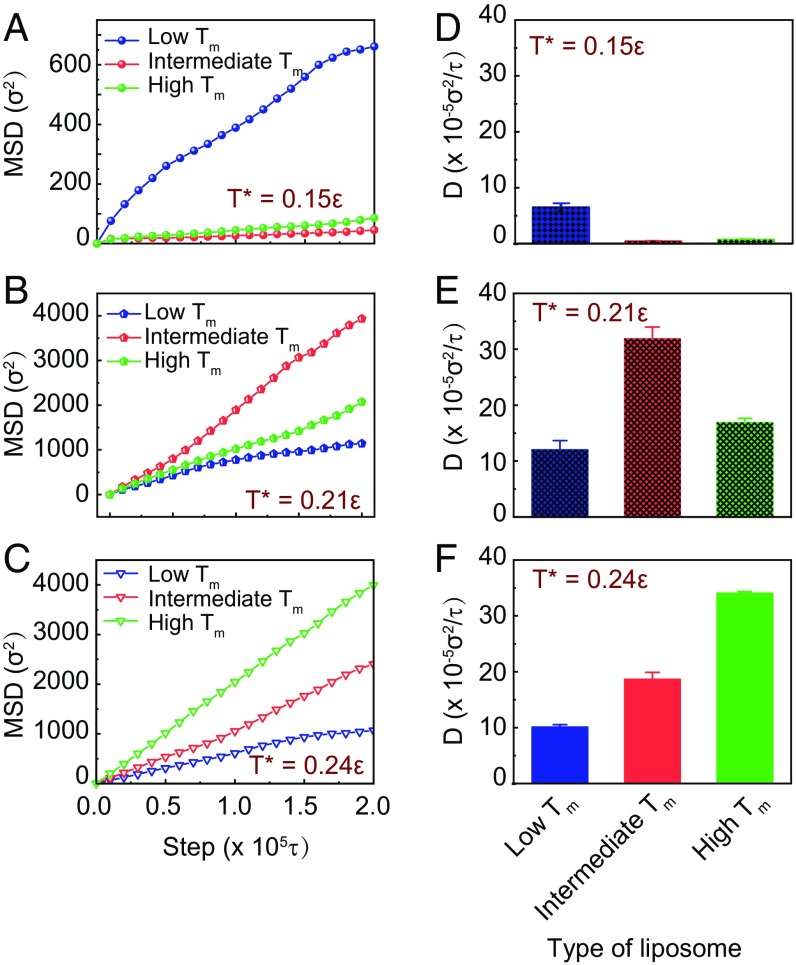
To elucidate the mechanism underlying the superior hydrogel-penetrating ability of liposomes at Tm, we next conducted coarse-grained (CG) molecular-dynamics (MD) simulations, which could provide insights into the detailed correlation between the physical parameters of NPs (such as size and shape) and their penetration efficiency (30, 31). As discussed above, the deformability of the liposome is influenced by its Tm. We thus hypothesized that the diffusivity of liposomes with different Tm may be affected by the deformability of the liposomes. To verify this hypothesis, we constructed a model system consisting of liposome models with tunable deformability and polymer networks (see Materials and Methods for more details). In this model, we constructed three types of liposomes with different rigidities, corresponding to the liposomes with different Tm (namely Lip1 for low Tm, Lip4 for intermediate Tm, and Lip6 for high Tm) in the experiment. In the simulations these liposomes were put into cubic boxes comprising cross-linked polymers and water. The simulations were conducted at three different temperatures, for example, T* = 0.15, 0.21, 0.24ε, where ε is the unit of energy and related to the temperature through . We found that the movement and diffusion of the liposomes increase with the simulation temperature, especially when the temperature increases from T* = 0.15ε to T* = 0.21ε; the traveling trajectories of the liposomes at high temperature (T* = 0.21ε) cover more area than those at low temperature (T* = 0.15ε) (SI Appendix, Figs. S11–S13). We repeated each simulation five times with different starting configurations and obtained MSD values for the three types of liposomes at different simulation temperatures (Fig. 5 A–C). At low temperature (T* = 0.15ε), the simulation results showed that soft liposome (lowest Tm, Lip1) has higher MSD value than the semisoft (intermediate Tm, Lip4) and the hard (highest Tm, Lip6) liposomes (Fig. 5A). However, when the simulation temperature increases to T* = 0.24ε, Lip6 has the largest MSD value (Fig. 5C). At intermediate temperature (T* = 0.21ε), the semisoft liposome has higher MSD than the soft and the hard liposomes (Fig. 5B). These simulation results are consistent with our experimental results. The calculated diffusivity of the NPs showed that, at relatively low temperature, the liposomes are confined and hard to diffuse (Fig. 5D). As the temperature increases, the diffusion is activated and the diffusivity of semisoft liposome is ∼1.8- and 2.7-fold higher than the hard and the soft liposomes, respectively (Fig. 5E). When the temperature further increases to T* = 0.24ε, the diffusivity of hard liposome is ∼1.7- and 3.3-fold higher than those of the semisoft and soft liposomes, respectively (Fig. 5F). The results confirmed that liposome has the fastest diffusion when the ambient temperature is around its Tm.
Fig. 5.
(A–C) Representative MSD values for the three types of liposomes in a polymer network at different simulation temperature T*. (D–F) The diffusivities of the liposomes in the polymer network at different simulation temperature T*. The blue, red, and green labels represent liposomes with low Tm, intermediate Tm, and high Tm, respectively.
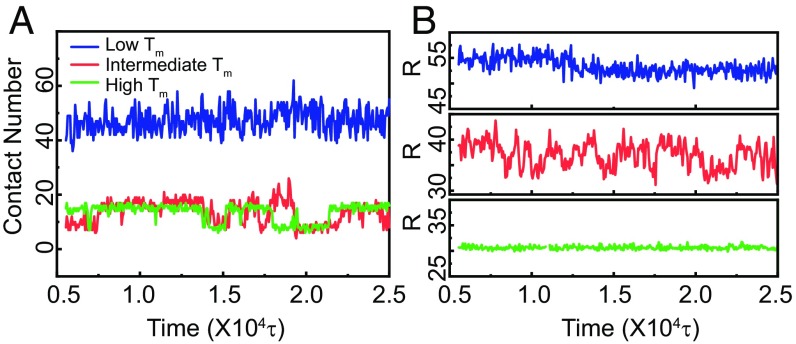
To explain why a liposome exhibits the fastest diffusion when the ambient temperature is around its Tm, we fixed the simulation temperature at T* = 0.21ε and examined the liposome/polymer interaction during the diffusion process. In the simulations, we used the parameter contact number to represent the interacting frequency of liposomes in a polymer network, which in turn reflects their interaction strength. When the distance between one polymer bead and one liposome bead is less than a cutoff rc, we say that the liposome has made one contact with the polymer network. A high contact number corresponds to a strong attraction between the liposome and the polymer. Fig. 6A shows that the contact number of soft liposome is three times higher than that of the semisoft and hard liposomes, which means that the soft liposomes have a much stronger attraction for the polymer than the semisoft and hard liposomes. Interestingly, the contact number of the semisoft liposome is similar to that of the hard liposome on average but with higher local fluctuations. The different diffusivities between the semisoft and hard liposomes may be attributed to these fluctuations. We then calculated the major axial length of the liposome, which relates to the deformation of the liposome (Fig. 6B and SI Appendix, Fig. S14). The results showed that, during the diffusion process, the major axial length of the soft and hard liposomes remains constant, while that for semisoft liposomes fluctuates around its initial radius. In addition, the major axial length of the soft liposome is much higher than its initial value (∼30σ), while that of the hard liposome is equal to its initial radius. These results confirmed that the shape of the soft liposome changes dramatically, while the hard liposome remains a sphere during diffusion in the hydrogel. The semisoft changes its shape frequently during the diffusion process.
Fig. 6.
(A) Number of beads in each liposome making contact with the polymer network in hydrogel. (B) Representative lengths of the major axis of liposomes in the hydrogel. The blue, red, and green labels represent liposomes with low Tm, intermediate Tm, and high Tm, respectively. The simulation temperature is taken as T* = 0.21ε.
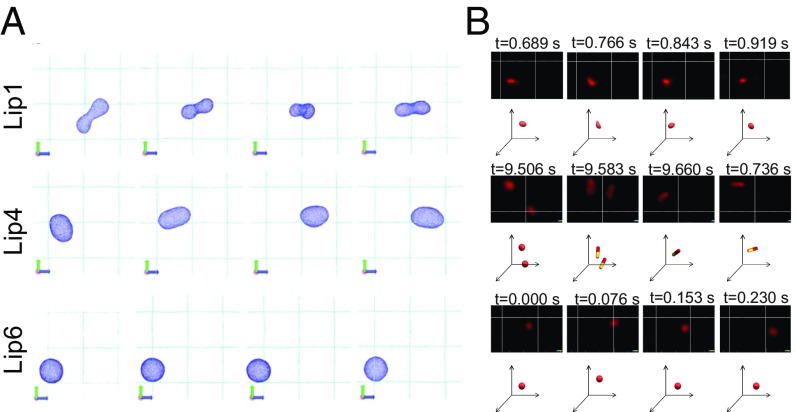
Therefore, we concluded that the soft liposome (with low Tm) is apt to undergo large deformation, which increases its contact area with the hydrogel network, resulting in increased affinity and decreased diffusivity. Snapshots from the simulation showed that the soft liposome changes its shape to conform to the corner of the polymer network of the hydrogel, maintaining a stable state in the simulation (Fig. 7A and Movie S1). The hard liposome (with high Tm) tends to be trapped in the corner of the hydrogel because of the high attraction density in that area, and these molecules oscillate around the corner without shape change (Fig. 7A and Movie S2). The semisoft liposome (with intermediate Tm) will first attract to one corner of the network, and then the liposome shape will deform into an ellipsoid due to its attraction to another corner of the network. Due to the competition between the attractions from two corners, as well as the elastic deformation energy of the liposome, the semisoft liposome has the chance to move from one corner to another. Through this process, the semisoft liposomes exhibit superior diffusivity compared with that of the soft and hard liposomes (Fig. 7A and Movie S3).
Fig. 7.
(A) Representative snapshots of liposomal structures from the simulation at T* = 0.21ε. (B) Snapshots and trajectory analysis of liposomal formulations in mucus as imaged by STED. A volume of 5 μL of DiI-labeled liposomes (Lip1, Lip4, and Lip6) was added to 200 μL of mucus. The images of liposomes (red) were acquired using 530-nm excitation and 565-nm emission for 10 s. Corresponding 3D schematic drawings of the position and deformation of the liposomes in panel (xyz-axis) are drawn below the STED images.
We also applied STED microscopy, a type of superresolution optical microscopy, to identify and characterize the diffusion mechanisms of liposomes with low, intermediate, and high Tm in rat intestinal mucus. As shown in Fig. 7B and Movies S1–S6, the three liposomes undergo different deformation patterns and thus display different diffusive capacities. Lip6 remains spherical in shape and exhibits moderate displacement. Lip1 shows an amorphous shape at different time points and has restricted mucus diffusion. The Lip4 deforms into an ellipsoid and displays rotational motion in the mucus.
Cellular Uptake of Liposomes.
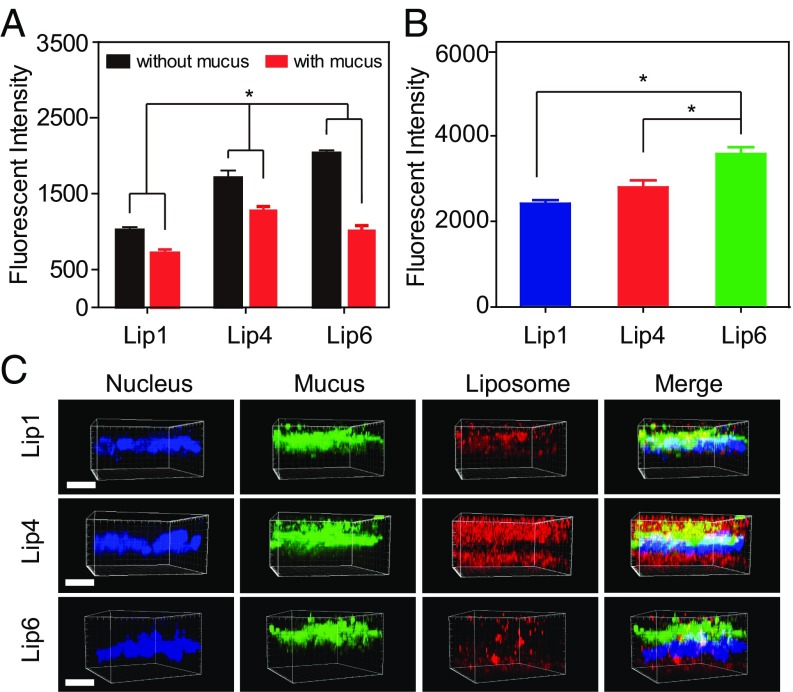
We then selected liposomes with low, intermediate, and high Tm, that is, Lip1, Lip4, and Lip6, respectively, for in vitro evaluations. E12 cells were used to mimic the mucosal tissues, which comprise the secreted mucus layer and absorptive epithelial cells (32). As shown in Fig. 8A, Lip4 exhibited significantly higher cellular internalization than Lip1 and Lip6. We hypothesized that because Lip4 diffuses faster than Lip1 and Lip6 in mucus, more Lip4 reaches the vicinity of the cell surface, leading to superior E12 uptake. We also removed the secreted mucus layer using N-acetylcysteine (NAC) for comparison. After removing the secreted mucus layer, Lip6 entered the cells more efficiently than Lip1 and Lip4 (Fig. 8A). These results were further corroborated using Caco-2 cells, which do not produce mucus (Fig. 8B). Finally, we visualized liposome mucus penetration and cellular internalization in E12 cell monolayers using confocal laser-scanning microscopy (CLSM), followed by 3D image reconstruction (Fig. 8C). As expected, more Lip4 was observed in both the mucus and cell layers compared with Lip1 and Lip6, indicating the superior diffusion capacity through the mucus and higher cellular uptake of Lip4.
Fig. 8.
Cellular uptake of liposomes in vitro. (A) Internalization of liposomes by E12 cells in the presence or absence of mucus. (B) Internalization of liposomes by non–mucus-producing Caco-2 cells. (C) CLSM 3D images showing liposome localization in E12 cell monolayers. DiI-labeled liposomes are shown in red, mucus stained with Alexa Fluor 488-wheat germ agglutinin (WGA) is shown in green, and cell nuclei stained with Hoechst stain are shown in blue. (Scale bar, 20 μm.) The data are shown as the means ± SD (n = 3). *P < 0.05.
Absorption of Liposomes Across Intestinal Villi ex Vivo and in Vivo.
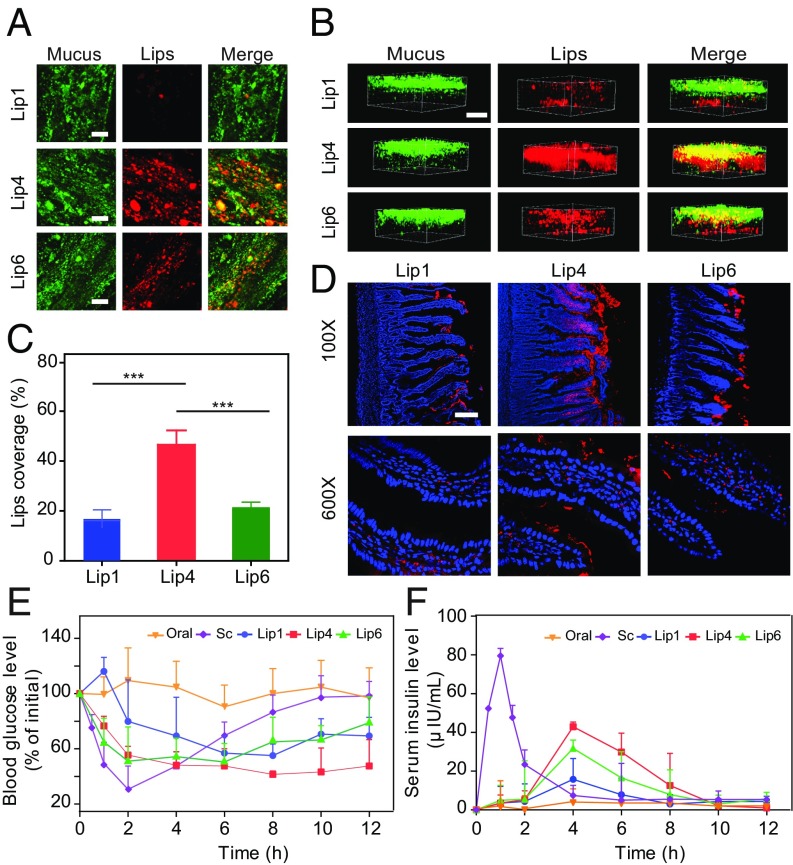
Next, to evaluate the significance of our results in tissues, we analyzed the distribution of Lip1, Lip4, and Lip6 in rat small intestine loops ex vivo by 2D and 3D scanning. All of the liposomal formulations displayed considerable mucus penetration, probably because these molecules were all modified with PEG, which enhances the diffusion of particles in mucus (33, 34). However, Lip4 was found to diffuse broader and deeper into intestinal villi (Fig. 9 A–C).
Fig. 9.
Oral delivery of liposomes to rats. The mucus-penetrating ability of liposomes was examined via (A) 2D CSLM scanning and (B) 3D CSLM scanning. To analyze the distribution of liposomes in mucus, Alexa Fluor 488-WGA was used to label the mucin fibers. The DiI-labeled liposomes were then injected into intestinal loops, followed by incubation for 30 min with gentle agitation. (Scale bar, 20 μm.) (C) Quantification of liposome coverage in the mucus shown in A. The data are shown as the means ± SD (n = 3). ***P < 0.001. (D) Distribution of DiI-labeled liposomes in middle intestinal sections at 1 h. Fasted Sprague-Dawley rats were orally administered DiI-labeled liposomes, and the middle intestinal sections were collected for CLSM analysis. Red fluorescence refers to liposomes, and blue fluorescence refers to cell nuclei. (Scale bar, 100 μm.) (E and F) Blood glucose levels (E) and plasma insulin concentrations (F) in diabetic rats following the oral administration of insulin (oral, 30 IU/kg), the s.c. injection of insulin (Sc, 5 IU/kg), and via insulin-loaded liposomes (Lip1, Lip4, and Lip6) (mean ± SD; n = 5).
We further assessed the intestinal penetration of liposomes in vivo. After oral administration, a segment of the small intestine was sliced for imaging. As shown in Fig. 9D, only a small amount of Lip1 and Lip6 was found in the luminal face of the gastrointestinal tract (GIT), with some liposomes found in the intestinal epithelium. In contrast, Lip4 was uniformly and widely distributed along the surface of the intestinal villi. These findings showed that liposomes with Tm near body temperature (∼37 °C) are more efficiently internalized by intestinal cells than liposomes with low or high Tm.
Use of Liposomes for Oral Delivery of Insulin.
Finally, we investigated the drug delivery capability of these liposomal formulations in vivo. Liposome formulations (Lip1, Lip4, and Lip6) were used to orally deliver insulin to diabetic rats. The oral delivery of insulin remains the “Holy Grail” of diabetes management because of the very limited oral bioavailability of insulin (<1%) caused by its low permeability across the intestinal mucosa and rapid degradation in the GIT (35). As shown in Fig. 9E, the oral administration of free insulin solution failed to reduce the blood glucose levels in rats, whereas all of the liposomal formulations generated significant hypoglycemic responses. The administration of Lip4 exhibited a remarkable hypoglycemic response with a maximal glucose level reduction of ∼50%, which persisted for more than 8 h. Lip1 and Lip6 reduced the blood glucose level to a lesser extent. The serum insulin levels achieved by the different liposomal formulations compared with those achieved by the s.c. injection of free insulin are shown in Fig. 9F and Table 1. The s.c. injection of free insulin solution resulted in a rapid increase in the serum insulin concentration with a maximum at 1 h postinjection. The oral administration of liposomal formulations resulted in a slow rise in the serum insulin concentration, which reached the maximum value at 4 h. However, compared with Lip1 and Lip6, a significantly higher serum insulin concentration was obtained with Lip4, and the area under the curve (AUC) for Lip4 was ∼172.02 μIU⋅h/mL with a relative bioavailability (F%) of 13.65%, indicating a more efficient delivery of insulin with Lip4.
Table 1.
Pharmacokinetic parameters of insulin in diabetic rats
| Formulation | Dose, IU/kg | AUC, μIU⋅h/mL | F, % |
| Insulin sol (s.c.) | 5 | 210.30 ± 27.29 | 100 |
| Insulin sol (oral) | 30 | 15.54 ± 10.63 | 1.23 |
| Lip1 | 30 | 75.92 ± 38.09 | 5.95 |
| Lip4 | 30 | 172.04 ± 13.19 | 13.65 |
| Lip6 | 30 | 122.18 ± 5.59 | 9.68 |
AUC, Area under the curve; F, relative bioavailability.
Discussion
Temperature is an important factor in determining the rate of diffusion. According to the Stokes–Einstein equation, the rate of Brownian motion of the particles increases with temperature. Here, we experimentally and theoretically demonstrated that temperature also governed the biological hydrogel penetration efficacy of liposomes with different phase transition temperatures Tm. Combining experiments and computer simulations, we confirmed that the diffusion of liposomes in hydrogels with temperatures around Tm was superior compared with that at low or high ambient temperatures. The underlying mechanism for the observed optimal diffusivity around Tm during hydrogel penetration is the deformation of liposomes. When the temperature is near their Tm, the liposomes deform into an ellipsoidal shape frequently, and this deformation facilitates their rapid diffusion.
Tissues covered with biological hydrogels, such as GIT, eye, nose, lung, and tumor tissues, are the major targets for drug delivery. However, the success of drug delivery is dramatically hampered by sequential barriers, including biological hydrogels and cellular layers. Recent reports have shown that the properties that the NPs required for hydrogel diffusion often impede cellular internalization (32, 36–38). For example, to efficiently cross the biological hydrogel, NPs should be neutrally charged or hydrophilic (39–41), while enhanced cellular internalization requires NPs to be hydrophobic or positively charged. Therefore, designing a carrier targeted to tissues covered with biological hydrogels is a challenging task. Here, we demonstrated that liposomes with moderate rigidity displayed enhanced diffusivity through mucus and thus achieved an oral insulin delivery efficacy superior to that of both their soft and hard counterparts. These findings suggest that the deformability of NPs may be an important parameter that can be leveraged to overcome multiple drug delivery barriers, such as mucosal and tumor delivery.
In summary, we rationally produced liposomes with different Tm by varying their lipid compositions. Experimental and simulation results showed that liposomes have different diffusivities at different ambient temperatures and display superior diffusion when the ambient temperature is around liposomal Tm. More importantly, we demonstrated the potential applicability of these results by using liposomes for the oral delivery of insulin in vivo. Mechanistic studies revealed that liposomes with different Tm gain different rigidities and further transform into various shapes, which results in different diffusion capacities. These findings provide insight into the role of ambient temperature on the transportation of liposomes. Our results might help in the development of much-needed strategies to improve the efficiency of liposome-based drug delivery systems.
Materials and Methods
Materials.
1,2-Dioleoyl-sn-glycero-3-phosphoethanolamine (DOPE) and 1,2-dimyristoyl-sn-glycero-3- phosphocholine (DMPC) were purchased from Lipoid. 1-Palmitoyl-2-stearoyl-sn-glycero-3-phosphocholine (HSPC), 1,2-distearoyl-sn-glycero-3-phosphocholine (DSPC), 1,2-dihexadecanoyl-rac-glycero-3-phosphocholine (DPPC), and 1,2-distearoyl-sn-glycero-3-phosphoethanolamine-N-[methoxy(polyethylene glycol)-2000] (DSPE-PEG2000) were purchased from AVT Corporation. 1,2-Dioleoyl-sn-glycero-3-phosphoethanolamine-[methoxy(polyethylene glycol)-2000] (DOPE-PEG2000) was purchased from Avanti. Hydroxycamptothecin (HCPT) was purchased from J&K China Chemical. 2-(4-Amidinophenyl)-1H-indole-6-carboxamidine (DAPI) and 1,1′-dioctadecyl-3,3,3′,3′-tetramethylindocarbocyanine perchlorate (DiI) were purchased from Beyotime Biotechnology. Alexa Fluor 488-conjugated wheat germ agglutinin (WGA) was obtained from Sigma-Aldrich. Chloroform and glycerin were purchased from the Sinopharm Chemical Reagent Company.
Male Sprague-Dawley rats (275 ± 25 g) were obtained from the Animal Experiments Center of the Shanghai Institute of Materia Medica (Shanghai, China). The animals had free access to rat chow and tap water ad libitum. Diabetes was induced in male Sprague-Dawley rats, and the rats were injected with streptozotocin (65 mg/kg) dissolved in a 10 mM citrate buffer (pH 4.5), as previously described. A glucose meter (On Call EZ; Acon Biotechnology) was used to determine the blood glucose level. Rats were regarded as diabetic when the glycemia level was higher than 300 mg/dL at 1 wk after injection. All animal procedures performed in this study were evaluated and approved by the Animal Ethics Committee of Shanghai Institute of Materia Medica, Chinese Academy of Sciences (Institutional Animal Care and Use Committee certification number 2016-05-GY-23).
HT29-MTX-E12 (E12) cells (52nd to 56th passages) cultured for 14–18 d were supplied by the ADME Department of Novo Nordisk. The human colon adenocarcinoma cell lines (Caco-2) were obtained from the American Type Culture Collection.
Liposome Preparation.
Liposomes were prepared using a thin-film evaporation method (42). Briefly, the lipid mixtures were dissolved in a mixture of chloroform and methanol at the ratio mentioned in SI Appendix, Table S1 (43). The mixtures were evaporated to dryness in a rotatory flask on a rotary evaporator and then hydrated with deionized water/saline solution (2 mL) for 30 min using a vortex. The hydration temperatures of the liposomes are listed in SI Appendix, Table S1. Finally, the liposomal preparations were extruded through 400-, 200-, and 100-nm polycarbonate membranes.
Characterization of Formulation.
The size, size distribution (PDI), and zeta potentials of the prepared liposomes were measured using dynamic light scattering (Nano ZS). AFM images of the lipid bilayers and force measurements using a Bio-Fast Scan scanning probe microscope (Bruker) were obtained in the Peak Force QNM imaging mode. The liposomal suspensions were placed onto a cleaned freshly cleaved mica surface, air-dried at room temperature, and transferred to an 85% humid chamber for 1 h. The samples were imaged with a scan rate of 1 Hz. A cantilever with a deflection sensitivity of 99 nm⋅V−1 and a tip with a spring constant of 0.16 N⋅m−1 were applied. All images and the Young’s modulus of each liposomal preparation were processed using Nanoscope Analysis software (Bruker).
Differential Scanning Calorimetry.
Differential scanning calorimetry (DSC) was performed to measure the Tm of various liposomal preparations. Ten microliters of liposomal preparations was placed on aluminum pans. The pans were then hermetically sealed, followed by heating at a rate of 5 °C⋅min−1. The scans were recorded at temperatures ranging from −20 to 70 °C.
Cryo-TEM.
Cryo-TEM using a Tecnai T12 electron microscope was adopted to visualize the structures of the liposomes. A drop of liposomal suspension was placed onto a carbon-coated copper grid and blotted. The samples were then shock-frozen by rapid immersion into liquid ethane, followed by cooling to 90 K in liquid nitrogen. The specimens were transferred to a Tecnai T12 electron microscope and analyzed at 200 kV.
Stability of Liposomal Preparations.
The in vitro stability of liposomal preparations was measured by monitoring the particle size and PDI in different biorelevant media at 37 °C for 120 min using a constant temperature shaker. The biorelevant media included simulated gastric fluid and simulated intestinal fluid. All media were prepared as described previously (44).
Multiple-Particle Tracking.
For mucus collection, we have adopted a method by the Hanes group (45–48). Briefly, the small intestine was excised after killing the rats, and ∼1.5–2.0 mL of mucus from each fasted rat was collected. The average pore size of the mucus is ∼200 nm, as revealed by scanning electron microscope in our previous work (49). Ten rats were killed to collect mucus for the multiparticle-tracking studies. Liposome formulations (50 μg/mL, 5 μL) were added to fresh rat mucus (100 μL) and equilibrated for 30 min at 37 °C before microscopy analysis. Movies were made at a temporal resolution of 32.6 ms for 10 s using an inverted fluorescence microscope (DMI 4000B; Leica). The tracking resolution was ∼10 nm, determined by gluing microspheres onto microslides and tracking their apparent displacement. The trajectories of the particles (n = 100) were analyzed using ImageJ for each experiment, and three independent experiments were performed. The time-averaged MSD and effective diffusivities (Deff) were calculated using the following equations:
| [1] |
| [2] |
where x and y represent the coordinates of the particle and t = timescale or time lag.
Deformation of Liposomes.
To observe the 3D deformation of liposomes during their diffusion in mucus, images and movies (10 s) were acquired by STED microscopy using a gated STED microscope (Leica TCS SP8 STED 3X; Leica Microsystems) equipped with an HCX PL APO 100×, 1.40 numerical aperture oil objective. The images of liposomes were acquired using 530-nm excitation and 565-nm emission. All images were obtained using LAS X software (Leica). Deconvolution processing was performed using Huygens Professional software (Scientific Volume Imaging). All movies were obtained using Imaris software (Bitplane).
Mucus Penetration on E12 Cells.
To assess the interactions between liposomes and the mucus layer, E12 cells were grown on Transwell filter inserts (Corning) for 14–17 d. Next, 400 μL of DiI-loaded liposomes diluted in PBS was added on the apical side for 60 min. The E12 monolayers were then washed three times with PBS, and the mucus layer was stained with Alexa Fluor 488-labeled WGA (Alexa Fluor 488-WGA; 10 mg/mL) for 10 min at 37 °C. The membranes supporting the cell layers were washed with PBS, and the E12 cells were stained with Hoechst 33342 (1 μg⋅mL−1) for 30 min at 37 °C. The cell layers supporting the membranes of the Transwell inserts were cut from the plastic support without fixation, mounted onto microscope slides, and covered with coverslips. The slides were immediately observed under a confocal microscope (LSCM, FV1000; Olympus). Image visualization and processing were performed using LSM 5 Pa software. To observe the interactions between the different formulations with mucus in a larger view, a 2D image in the middle of the mucus was taken under a confocal microscope using a 63× oil objective lens.
Cellular Uptake of Liposomes.
E12 and Caco-2 cells were seeded onto 12-well plates at a density of 1 × 10⁶ cells per well. The plates were incubated for 3 d under 5% CO2/95% humidity at 37 °C. The E12 monolayers were washed three times with HBSS and then incubated for 1 h with liposomes (400 μg of total lipid⋅mL−1) in 500 μL of culture medium. Following incubation, the cell monolayers were washed again with HBSS and then treated with radioimmunoprecipitation assay (RIPA) lysis buffer for 30 min and suspended in HBSS buffer, followed by centrifugation at 4,000 × g for 10 min. Aliquots (200 μL) of the supernatant were analyzed at 530/565 nm (excitation/emission) using the Synergy H1m microplate reader. Additionally, cell samples were collected for further analysis by flow cytometry or to measure the protein concentration using the bicinchoninic acid protein assay kit.
Liposome Distribution in the Rat Small Intestine.
Sprague-Dawley rats were fasted but were allowed free access to water for 12 h before the experiments. To investigate the intestinal distribution of liposomes, the rats were anesthetized with 20% urethane solution, and the ileum was exposed by a small incision in the abdomen. A 2-cm region was tied off using surgical sutures, and 400 μL of liposomal preparation was injected into the loop (49). After incubation for 1.5 h, the intestine was cut and fixed in 4% paraformaldehyde for 3 h and then transferred into 30% sucrose solution for dehydration overnight. The tissue sections were frozen in optimum cutting temperature compound (OCT), sliced at a depth of 20 μm, stained with DAPI, and embedded in a PBS/glycerol (1:9) mixture for imaging.
In Vivo Pharmacodynamic and Pharmacokinetic Studies.
Diabetic rats were fasted overnight before experiments but were allowed free access to water. The following formulations were administered to the rats orally: free-form insulin (30 IU⋅kg−1 body weight) and insulin-containing liposomal formulations (equivalent to 30 IU insulin⋅kg−1 body weight). Control rats received s.c. injections of insulin solution (5 IU⋅kg−1 body weight). Blood samples were collected from the tail veins of rats before drug administration and at distinct time intervals after dosing. The blood glucose levels were determined using a glucose meter. For analysis of the serum insulin level, blood samples were centrifuged at 1,800 × g for 5 min and subsequently quantified using an insulin ELISA kit (R&D Systems). The area under the serum insulin concentration vs. time curve (AUC) was calculated for each group. The relative bioavailability (F%) of the test liposomes after oral administration was calculated using the following equation:
MD Simulations.
A CG model and MD simulations were used to elucidate the mechanism for the diffusivity of the liposome in hydrogel. To simplify this problem, we constructed a model system comprising cross-linked polymers, water, and liposomes. A regular cross-linked polymer network with a mesh size of was constructed to represent mucin fibers. Each fiber comprised a series of beads spanning the entire simulation box. Different fibers were cross-linked by a node bead to simulate the entanglement and cross-linking of mucin fibers. The bonded interaction between neighboring beads along the polymer network was described by a harmonic spring force. The liposome with a size of was modeled using the one-particle-thick model. The units of length, mass, time, and energy were presented as the bead radius , bead mass , , and respectively. In the simulations, the Lennard–Jones potential was used to describe the nonbonded interactions between two beads, except the interaction of each pair of liposome beads. Following the notation from the original paper, the interparticle interaction between the liposome beads was described by a soft-core pairwise potential with the interaction strength weighed by the relative orientations of the particle pair (50). The details of the setup of the system and the interaction potential are referred to in our previous work (51) and listed in SI Appendix.
During the simulations, we defined contact between the liposome and the polymer network as the condition in which the distance between a liposome bead and a polymer network bead is smaller than . The number of beads contacted by the liposomes was then calculated. The MSD values and effective diffusivities were calculated using the following equations:
| [3] |
| [4] |
where x, y, and z represent the center of mass of a particle, t is the duration of the time lag, and represents the average of the liposome. In this work, we repeated each simulation five times with different initial configurations and obtained the mean MSD of different types of liposomes. In the simulations, we constrained node beads by applying a spring to tether them to their initial positions. The velocity Verlet algorithm was utilized to perform time integration during the simulations. The integration time step was . The simulations were performed in the isothermal-isobaric ensemble (NVT) at temperatures kBT = 0.15ε, 0.21ε, and 0.24ε, where kB is the Boltzmann constant, and T is the temperature. The total simulation time was . After approximately , MSD calculations were performed. The fitting of diffusivity D was performed by linearly fitting the MSD versus time lag from to . The slope of the fitting line was denoted by k; thus, D = k/6. To verify the robustness of our simulation model, we tuned the pore size of the network from to and in the simulations, with results summarized in SI Appendix.
Statistical Analysis.
All of the data are reported as the means ± SD. Intergroup differences were analyzed using Student’s t test when two groups were compared or one-way ANOVA with Tukey’s post hoc test when multiple groups were compared (P > 0.05, ns; *P < 0.05; **P < 0.01; ***P < 0.001; ****P < 0.0001).
Supplementary Material
Acknowledgments
We thank the National Center for Protein Science Shanghai for the cryo-EM, and we are grateful to Zhi Liu for assistance with preparing the EM samples. We also thank the Leica Microscopy Laboratory (Shanghai) for the light microscopy data, and we are grateful to Leica (China) for assistance in obtaining data using the SP8 STED system. The AFM experiments were supported by Huiqin Li from the Instrumental Analysis Center of Shanghai Jiao Tong University. We are grateful for financial support from the National Natural Science Foundation of China [81573378 and 81773651 (to Y.G.); 11422215, 11272327, and 11672079 (to X.S.)], the Strategic Priority Research Program of Chinese Academy of Sciences (XDA01020304), and Shanghai Sailing Program 2017 (17YF1423500). This study is also partly supported by CASIMM0120153020, the K. C. Wong Education Foundation, the Opening Fund of State Key Laboratory of Nonlinear Mechanics, and the New Star Program, Shanghai Institute of Materia Medica, Chinese Academy of Sciences. The computation experiment was mainly supported by the Supercomputing Center of Chinese Academy of Sciences.
Footnotes
The authors declare no conflict of interest.
This article contains supporting information online at www.pnas.org/lookup/suppl/doi:10.1073/pnas.1818924116/-/DCSupplemental.
References
- 1.Vorselen D, MacKintosh FC, Roos WH, Wuite GJ. Competition between bending and internal pressure governs the mechanics of fluid nanovesicles. ACS Nano. 2017;11:2628–2636. doi: 10.1021/acsnano.6b07302. [DOI] [PMC free article] [PubMed] [Google Scholar]
- 2.Schubert U, et al. Proteasome inhibition interferes with gag polyprotein processing, release, and maturation of HIV-1 and HIV-2. Proc Natl Acad Sci USA. 2000;97:13057–13062. doi: 10.1073/pnas.97.24.13057. [DOI] [PMC free article] [PubMed] [Google Scholar]
- 3.Saffarian S, Cocucci E, Kirchhausen T. Distinct dynamics of endocytic clathrin-coated pits and coated plaques. PLoS Biol. 2009;7:e1000191. doi: 10.1371/journal.pbio.1000191. [DOI] [PMC free article] [PubMed] [Google Scholar]
- 4.Shaye DD, Casanova J, Llimargas M. Modulation of intracellular trafficking regulates cell intercalation in the Drosophila trachea. Nat Cell Biol. 2008;10:964–970. doi: 10.1038/ncb1756. [DOI] [PubMed] [Google Scholar]
- 5.Enrich C, Rentero C, Hierro A, Grewal T. Role of cholesterol in SNARE-mediated trafficking on intracellular membranes. J Cell Sci. 2015;128:1071–1081. doi: 10.1242/jcs.164459. [DOI] [PubMed] [Google Scholar]
- 6.van Meer G, Voelker DR, Feigenson GW. Membrane lipids: Where they are and how they behave. Nat Rev Mol Cell Biol. 2008;9:112–124. doi: 10.1038/nrm2330. [DOI] [PMC free article] [PubMed] [Google Scholar]
- 7.Hsu VW, Lee SY, Yang JS. The evolving understanding of COPI vesicle formation. Nat Rev Mol Cell Biol. 2009;10:360–364. doi: 10.1038/nrm2663. [DOI] [PubMed] [Google Scholar]
- 8.Tkach M, Théry C. Communication by extracellular vesicles: Where we are and where we need to go. Cell. 2016;164:1226–1232. doi: 10.1016/j.cell.2016.01.043. [DOI] [PubMed] [Google Scholar]
- 9.Kawamura Y, Yamamoto Y, Sato TA, Ochiya T. Extracellular vesicles as trans-genomic agents: Emerging roles in disease and evolution. Cancer Sci. 2017;108:824–830. doi: 10.1111/cas.13222. [DOI] [PMC free article] [PubMed] [Google Scholar]
- 10.Bitto NJ, et al. Bacterial membrane vesicles transport their DNA cargo into host cells. Sci Rep. 2017;7:7072. doi: 10.1038/s41598-017-07288-4. [DOI] [PMC free article] [PubMed] [Google Scholar]
- 11.van Dongen HM, Masoumi N, Witwer KW, Pegtel DM. Extracellular vesicles exploit viral entry routes for cargo delivery. Microbiol Mol Biol Rev. 2016;80:369–386. doi: 10.1128/MMBR.00063-15. [DOI] [PMC free article] [PubMed] [Google Scholar]
- 12.Zhang P, et al. Genetically engineered liposome-like nanovesicles as active targeted transport platform. Adv Mater. 2018;30:1705350. doi: 10.1002/adma.201705350. [DOI] [PubMed] [Google Scholar]
- 13.Settles EI, Loftus AF, McKeown AN, Parthasarathy R. The vesicle trafficking protein Sar1 lowers lipid membrane rigidity. Biophys J. 2010;99:1539–1545. doi: 10.1016/j.bpj.2010.06.059. [DOI] [PMC free article] [PubMed] [Google Scholar]
- 14.Liu P, Li J, Zhang YW. Pressure-temperature phase diagram for shapes of vesicles: A coarse-grained molecular dynamics study. Appl Phys Lett. 2009;95:143104. [Google Scholar]
- 15.Pan J, Tristram-Nagle S, Kucerka N, Nagle JF. Temperature dependence of structure, bending rigidity, and bilayer interactions of dioleoylphosphatidylcholine bilayers. Biophys J. 2008;94:117–124. doi: 10.1529/biophysj.107.115691. [DOI] [PMC free article] [PubMed] [Google Scholar]
- 16.Purushothaman S, Cicuta P, Ces O, Brooks NJ. Influence of high pressure on the bending rigidity of model membranes. J Phys Chem B. 2015;119:9805–9810. doi: 10.1021/acs.jpcb.5b05272. [DOI] [PubMed] [Google Scholar]
- 17.Pozo Navas B, et al. Composition dependence of vesicle morphology and mixing properties in a bacterial model membrane system. Biochim Biophys Acta. 2005;1716:40–48. doi: 10.1016/j.bbamem.2005.08.003. [DOI] [PubMed] [Google Scholar]
- 18.Et-Thakafy O, et al. Mechanical properties of membranes composed of gel-phase or fluid-phase phospholipids probed on liposomes by atomic force spectroscopy. Langmuir. 2017;33:5117–5126. doi: 10.1021/acs.langmuir.7b00363. [DOI] [PubMed] [Google Scholar]
- 19.Elani Y, et al. Measurements of the effect of membrane asymmetry on the mechanical properties of lipid bilayers. Chem Commun (Camb) 2015;51:6976–6979. doi: 10.1039/c5cc00712g. [DOI] [PubMed] [Google Scholar]
- 20.Kaminskas LM, et al. Doxorubicin-conjugated PEGylated dendrimers show similar tumoricidal activity but lower systemic toxicity when compared to PEGylated liposome and solution formulations in mouse and rat tumor models. Mol Pharm. 2012;9:422–432. doi: 10.1021/mp200522d. [DOI] [PubMed] [Google Scholar]
- 21.Belfiore L, et al. Towards clinical translation of ligand-functionalized liposomes in targeted cancer therapy: Challenges and opportunities. J Control Release. 2018;277:1–13. doi: 10.1016/j.jconrel.2018.02.040. [DOI] [PubMed] [Google Scholar]
- 22.Feeney OM, et al. 50 years of oral lipid-based formulations: Provenance, progress and future perspectives. Adv Drug Deliv Rev. 2016;101:167–194. doi: 10.1016/j.addr.2016.04.007. [DOI] [PubMed] [Google Scholar]
- 23.Takechi-Haraya Y, et al. Atomic force microscopic analysis of the effect of lipid composition on liposome membrane rigidity. Langmuir. 2016;32:6074–6082. doi: 10.1021/acs.langmuir.6b00741. [DOI] [PubMed] [Google Scholar]
- 24.Mura S, Nicolas J, Couvreur P. Stimuli-responsive nanocarriers for drug delivery. Nat Mater. 2013;12:991–1003. doi: 10.1038/nmat3776. [DOI] [PubMed] [Google Scholar]
- 25.Rawicz W, Olbrich KC, McIntosh T, Needham D, Evans E. Effect of chain length and unsaturation on elasticity of lipid bilayers. Biophys J. 2000;79:328–339. doi: 10.1016/S0006-3495(00)76295-3. [DOI] [PMC free article] [PubMed] [Google Scholar]
- 26.Konyakhina TM, Wu J, Mastroianni JD, Heberle FA, Feigenson GW. Phase diagram of a 4-component lipid mixture: DSPC/DOPC/POPC/chol. Biochim Biophys Acta. 2013;1828:2204–2214. doi: 10.1016/j.bbamem.2013.05.020. [DOI] [PMC free article] [PubMed] [Google Scholar]
- 27.Sun L, Böckmann RA. Membrane phase transition during heating and cooling: Molecular insight into reversible melting. Eur Biophys J. 2018;47:151–164. doi: 10.1007/s00249-017-1237-3. [DOI] [PubMed] [Google Scholar]
- 28.Monteiro N, Martins A, Reis RL, Neves NM. Liposomes in tissue engineering and regenerative medicine. J R Soc Interface. 2014;11:20140459. doi: 10.1098/rsif.2014.0459. [DOI] [PMC free article] [PubMed] [Google Scholar]
- 29.Witten J, Ribbeck K. The particle in the spider’s web: Transport through biological hydrogels. Nanoscale. 2017;9:8080–8095. doi: 10.1039/c6nr09736g. [DOI] [PMC free article] [PubMed] [Google Scholar]
- 30.Yang K, Ma YQ. Computer simulation of the translocation of nanoparticles with different shapes across a lipid bilayer. Nat Nanotechnol. 2010;5:579–583. doi: 10.1038/nnano.2010.141. [DOI] [PubMed] [Google Scholar]
- 31.Ding HM, Tian WD, Ma YQ. Designing nanoparticle translocation through membranes by computer simulations. ACS Nano. 2012;6:1230–1238. doi: 10.1021/nn2038862. [DOI] [PubMed] [Google Scholar]
- 32.Shan W, et al. Overcoming the diffusion barrier of mucus and absorption barrier of epithelium by self-assembled nanoparticles for oral delivery of insulin. ACS Nano. 2015;9:2345–2356. doi: 10.1021/acsnano.5b00028. [DOI] [PubMed] [Google Scholar]
- 33.Patil HP, et al. Fate of PEGylated antibody fragments following delivery to the lungs: Influence of delivery site, PEG size and lung inflammation. J Control Release. 2018;272:62–71. doi: 10.1016/j.jconrel.2017.12.009. [DOI] [PubMed] [Google Scholar]
- 34.Huang X, et al. Protein nanocages that penetrate airway mucus and tumor tissue. Proc Natl Acad Sci USA. 2017;114:E6595–E6602. doi: 10.1073/pnas.1705407114. [DOI] [PMC free article] [PubMed] [Google Scholar]
- 35.Pridgen EM, et al. Transepithelial transport of Fc-targeted nanoparticles by the neonatal Fc receptor for oral delivery. Sci Transl Med. 2013;5:213ra167. doi: 10.1126/scitranslmed.3007049. [DOI] [PMC free article] [PubMed] [Google Scholar]
- 36.Ren T, et al. Enhanced oral absorption and anticancer efficacy of cabazitaxel by overcoming intestinal mucus and epithelium barriers using surface polyethylene oxide (PEO) decorated positively charged polymer-lipid hybrid nanoparticles. J Control Release. 2018;269:423–438. doi: 10.1016/j.jconrel.2017.11.015. [DOI] [PubMed] [Google Scholar]
- 37.Wu J, et al. Biomimetic viruslike and charge reversible nanoparticles to sequentially overcome mucus and epithelial barriers for oral insulin delivery. ACS Appl Mater Interfaces. 2018;10:9916–9928. doi: 10.1021/acsami.7b16524. [DOI] [PubMed] [Google Scholar]
- 38.Wang Y, et al. Overcoming multiple gastrointestinal barriers by bilayer modified hollow mesoporous silica nanocarriers. Acta Biomater. 2018;65:405–416. doi: 10.1016/j.actbio.2017.10.025. [DOI] [PubMed] [Google Scholar]
- 39.Lai SK, Wang YY, Hanes J. Mucus-penetrating nanoparticles for drug and gene delivery to mucosal tissues. Adv Drug Deliv Rev. 2009;61:158–171. doi: 10.1016/j.addr.2008.11.002. [DOI] [PMC free article] [PubMed] [Google Scholar]
- 40.Wang YY, et al. Addressing the PEG mucoadhesivity paradox to engineer nanoparticles that “slip” through the human mucus barrier. Angew Chem Int Ed Engl. 2008;47:9726–9729. doi: 10.1002/anie.200803526. [DOI] [PMC free article] [PubMed] [Google Scholar]
- 41.Suk JS, et al. Lung gene therapy with highly compacted DNA nanoparticles that overcome the mucus barrier. J Control Release. 2014;178:8–17. doi: 10.1016/j.jconrel.2014.01.007. [DOI] [PMC free article] [PubMed] [Google Scholar]
- 42.Samad A, Sultana Y, Aqil M. Liposomal drug delivery systems: An update review. Curr Drug Deliv. 2007;4:297–305. doi: 10.2174/156720107782151269. [DOI] [PubMed] [Google Scholar]
- 43.Sierra MB, Pedroni VI, Buffo FE, Disalvo EA, Morini MA. The use of zeta potential as a tool to study phase transitions in binary phosphatidylcholines mixtures. Colloids Surf B Biointerfaces. 2016;142:199–206. doi: 10.1016/j.colsurfb.2016.02.061. [DOI] [PubMed] [Google Scholar]
- 44.Xia F, et al. Size-dependent translocation of nanoemulsions via oral delivery. ACS Appl Mater Interfaces. 2017;9:21660–21672. doi: 10.1021/acsami.7b04916. [DOI] [PubMed] [Google Scholar]
- 45.Ensign LM, et al. Ex vivo characterization of particle transport in mucus secretions coating freshly excised mucosal tissues. Mol Pharm. 2013;10:2176–2182. doi: 10.1021/mp400087y. [DOI] [PMC free article] [PubMed] [Google Scholar]
- 46.Maisel K, Ensign L, Reddy M, Cone R, Hanes J. Effect of surface chemistry on nanoparticle interaction with gastrointestinal mucus and distribution in the gastrointestinal tract following oral and rectal administration in the mouse. J Control Release. 2015;197:48–57. doi: 10.1016/j.jconrel.2014.10.026. [DOI] [PMC free article] [PubMed] [Google Scholar]
- 47.Date AA, Hanes J, Ensign LM. Nanoparticles for oral delivery: Design, evaluation and state-of-the-art. J Control Release. 2016;240:504–526. doi: 10.1016/j.jconrel.2016.06.016. [DOI] [PMC free article] [PubMed] [Google Scholar]
- 48.Ensign LM, Cone R, Hanes J. Oral drug delivery with polymeric nanoparticles: The gastrointestinal mucus barriers. Adv Drug Deliv Rev. 2012;64:557–570. doi: 10.1016/j.addr.2011.12.009. [DOI] [PMC free article] [PubMed] [Google Scholar]
- 49.Yu M, et al. Rotation-facilitated rapid transport of nanorods in mucosal tissues. Nano Lett. 2016;16:7176–7182. doi: 10.1021/acs.nanolett.6b03515. [DOI] [PubMed] [Google Scholar]
- 50.Yuan H, Huang C, Li J, Lykotrafitis G, Zhang S. One-particle-thick, solvent-free, coarse-grained model for biological and biomimetic fluid membranes. Phys Rev E Stat Nonlin Soft Matter Phys. 2010;82:011905. doi: 10.1103/PhysRevE.82.011905. [DOI] [PubMed] [Google Scholar]
- 51.Yu M, et al. Rapid transport of deformation-tuned nanoparticles across biological hydrogels and cellular barriers. Nat Commun. 2018;9:2607. doi: 10.1038/s41467-018-05061-3. [DOI] [PMC free article] [PubMed] [Google Scholar]
Associated Data
This section collects any data citations, data availability statements, or supplementary materials included in this article.


