TimeSignature’s power is that it is highly accurate across transcriptomic platforms and experimental protocols. TimeSignature can be trained using data from a single platform/study and be applied to independent data without additional processing.
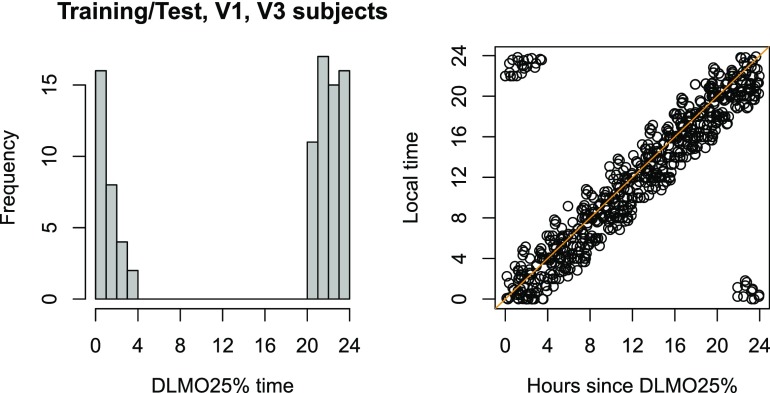
Demonstrating this robustness and generalizability required applying TimeSignature to as diverse a set of studies as possible (i.e., refs. 1–4). Because not all studies had melatonin data, we chose to use draw time as a proxy for melatonin phase. Laing et al. (5) criticize this methodology; however, each of the studies (1–4) selected subjects for whom circadian phase was well aligned with local time. We have confirmed that dim-light melatonin onset (DLMO)25%, the time at which 25% of maximum blood melatonin is reached, is strongly correlated with local time in studies with available melatonin data (1–3) (Fig. 1). As expected, training on local time thus accurately predicts melatonin phase (Fig. 2, oTS).
Fig. 1.
Comparison of circadian and clock time measurements in study subjects. (Left) Distribution of DLMO25% times for all subject-days with melatonin data (n = 89; data from refs. 1–3); the median DLMO25% was 23:10. (Right) Local clock time vs. circadian phase (hours since DLMO25%) for all samples with available melatonin data.
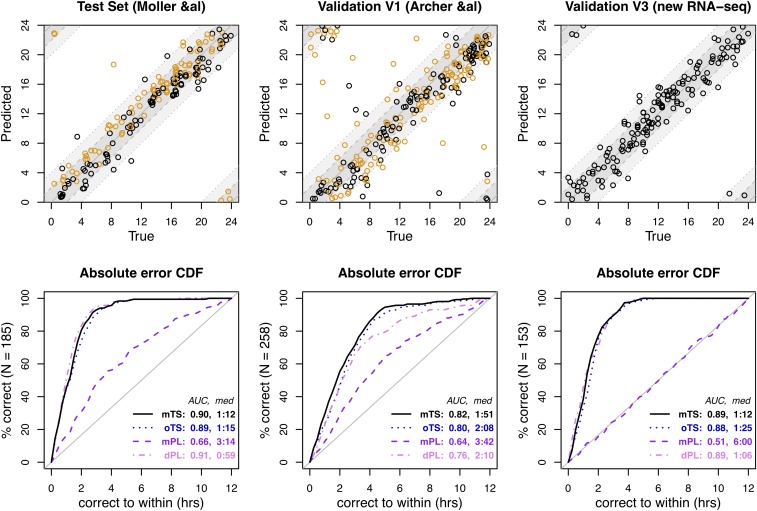
Fig. 2.
TimeSignature predictions of melatonin phase [represented as Time Since DLMO25% (in hours)]. mTS refers to TimeSignature predictions for Time Since DLMO25% when trained using Time Since DLMO25% as the outcome in the training data, whereas oTS refers to TimeSignature predictions for Time Since DLMO25% using the original, local-time-trained predictor reported in ref. 1. Because of the close relationship between local time and DLMO25% (Fig. 1), these predictions are similar, although the melatonin-trained predictor is more accurate (as expected). Also shown are comparisons to the PLSR (mPL) and differential PLSR (dPL) models, both trained on Time Since DLMO25% in the same set of samples used for TimeSignature. Data used to reproduce this figure are available from https://github.com/braunr/TimeSignatR (7).
More importantly, when trained on melatonin phase, TimeSignature predicts melatonin phase even more accurately than our previously published draw-time results (1), with a median absolute error of under 1:20 (Fig. 2, mTS). This demonstrates that the TimeSignature algorithm is a robust and universal method for making predictions of circular variables from transcriptomic data.
In regard to Laing et al.’s (5) second and third points, there are important distinctions between TimeSignature and differential partial least squares regression (dPLSR) (6). While TimeSignature’s normalization uses the average between the time points as a reference, the prediction yields two separate predictions that need not be 180° (12 h) apart. In fact, TimeSignature could articulate circadian asymmetries (e.g., a well-aligned first time point but a delayed second time point). By contrast, dPLSR makes a single prediction for the midpoint of the two samples, and thus could not be used to detect such effects. Although peak accuracy is at 12 h apart, TimeSignature performs accurately even for samples <12 h apart—a significant practical consideration. Plots showing TimeSignature’s superior performance predicting melatonin phase compared to both PLSR and dPLSR are given in Fig. 2.
With respect to conormalization, we are specifically referring to combining samples from different studies (which can exhibit systematically different statistical characteristics) and then normalizing the mixed samples across study subjects. In the PLSR paper (6), data from two studies (2, 3) were mixed in the training and testing sets; quantile normalization was performed across the mixture of studies in the training set, with the same normalization applied to the validation mixture, followed by z scoring across the mixture of samples. This constructs an artificial situation in which the training and application data have the same statistical characteristics (both are equivalent mixtures of the same source studies, normalized to the same reference) and generates dependencies between data from independent studies.
A true test of an algorithm’s performance requires validating the model in truly independent data. Hence, we trained on a subset of samples from a single study (2) and tested against independent studies (1, 3, 4), without any mixing or renormalizing across subjects. Additionally, z scoring across subjects (or any other cross-subject renormalization) creates a situation in which predictions for a given individual will depend on data from other subjects, thus compromising interpretability and reproducibility. TimeSignature avoids this drawback.
We absolutely agree with Laing et al. (5) that progress in this field requires careful validation of any new method.
Footnotes
Data deposition: The data used to reproduce Fig. 2 have been deposited on GitHub and are available at https://github.com/braunr/TimeSignatR.
The authors declare no conflict of interest.
References
- 1.Braun R, et al. Universal method for robust detection of circadian state from gene expression. Proc Natl Acad Sci USA. 2018;115:E9247–E9256. doi: 10.1073/pnas.1800314115. [DOI] [PMC free article] [PubMed] [Google Scholar]
- 2.Möller-Levet CS, et al. Effects of insufficient sleep on circadian rhythmicity and expression amplitude of the human blood transcriptome. Proc Natl Acad Sci USA. 2013;110:E1132–E1141. doi: 10.1073/pnas.1217154110. [DOI] [PMC free article] [PubMed] [Google Scholar]
- 3.Archer SN, et al. Mistimed sleep disrupts circadian regulation of the human transcriptome. Proc Natl Acad Sci USA. 2014;111:E682–E691. doi: 10.1073/pnas.1316335111. [DOI] [PMC free article] [PubMed] [Google Scholar]
- 4.Arnardottir ES, et al. Blood-gene expression reveals reduced circadian rhythmicity in individuals resistant to sleep deprivation. Sleep (Basel) 2014;37:1589–1600. doi: 10.5665/sleep.4064. [DOI] [PMC free article] [PubMed] [Google Scholar]
- 5.Laing EE, Möller-Levet CS, Archer SN, Dijk D.-J. Universal and robust assessment of circadian what? Proc Natl Acad Sci USA. 2019;116:5205. doi: 10.1073/pnas.1817119116. [DOI] [PMC free article] [PubMed] [Google Scholar]
- 6.Laing EE, et al. Blood transcriptome based biomarkers for human circadian phase. eLife. 2017;6:e20214. doi: 10.7554/eLife.20214. [DOI] [PMC free article] [PubMed] [Google Scholar]
- 7.Braun R. 2018 Data from “TimeSignatR.” GitHub. Available at https://github.com/braunr/TimeSignatR. Deposited January 4, 2018.


