

Abstract
Persistent neural activity maintains information bridging past and future events. Models of persistent activity often invoke reverberations within local cortical circuits, but long-range circuits could also contribute. Neurons in mouse anterior lateral motor cortex (ALM) show selective persistent activity that instructs future actions. ALM is connected bi-directionally with parts of the thalamus, including the ventral medial and ventral anterior-lateral nuclei. We recorded spikes from ALM and thalamus during tactile discrimination with a delayed directional response. Similar to ALM neurons, thalamic neurons exhibited selective persistent delay activity that predicted movement direction. Unilateral photoinhibition of delay activity in ALM or thalamus produced contralesional neglect. Photoinhibition of thalamus caused a short-latency and near total collapse of ALM activity. Similarly, photoinhibition of ALM diminished thalamic activity. Our results reveal thalamus as a circuit hub in motor preparation and suggest that persistent activity requires reciprocal excitation across multiple brain areas.
Introduction
Short-term memory is represented by changes in spike rates that are maintained internally, in the absence of sustained sensory input. Neurons in frontal cortex show persistent activity related to different types of short-term memory1-10. Motor preparation is a particular short-term memory that links past events and anticipation of future movements. Motor preparation has been studied extensively using delayed response tasks, in which a sensory stimulus instructs a future action. During the delay epoch, neurons in motor cortex and related structures show persistent and ramping activity related to specific movements, long before movement onset1-5,11. We refer here to persistent activity during the delay epoch as ‘preparatory activity’.
Individual neurons have time constants on the order of ten milliseconds. Persistent activity over seconds is therefore an emergent property of neural circuits, likely involving positive feedback. Circuit models of cortical persistent activity often invoke reverberations within local circuits mediated by excitatory connections12,13. However, persistent activity could also arise from multi-regional interactions. Frontal and parietal cortical areas, together with associated thalamic nuclei, form a network and show persistent activity during memory guided tasks6,14-23. Identifying the critical anatomical substrates for persistent activity is crucial to understand the neural mechanisms underlying short-term memory.
A large fraction of mouse anterior lateral motor cortex (ALM) neurons exhibit direction-selective persistent and ramping preparatory activity in a directional licking task3. Preparatory activity is distributed across both ALM hemispheres24, similar to human premotor cortex25,26. Three types of manipulation experiments show that ALM preparatory activity instructs directed licking in a tactile delayed response task. First, unilateral inactivation of ALM during motor preparation impairs upcoming movements in the contralateral direction3,24,27. Second, brief unilateral activation of ALM pyramidal tract neurons has persistent effects on ALM population activity and biases the direction of future movements towards the contralateral direction27. Third, brief bilateral inactivation destroys selectivity of preparatory activity on average and randomizes future movements; but on a trial-by-trial basis movement direction can still be predicted based on ALM population activity 24. Preparatory activity in one hemisphere remains largely unchanged after perturbation of the other hemisphere, implying that ALM hemispheres can maintain preparatory activity independently24. Here we report that maintenance of persistent activity in ALM requires direct excitation from thalamus and vice versa, revealing thalamus as a key circuit node in motor preparation.
Thalamus is required for motor preparation
Mice performed a discrimination task with a delayed response3,27,28 (Fig. 1a, b). In each trial, mice judged the location of an object with their whiskers. During the subsequent delay epoch (1.2 or 1.3s), mice maintained a memory of the previous sensory experience and planned an upcoming response. Following an auditory ‘go’ cue, mice reported object location with directional licking (left or right, mean percent correct 77.6%; lick-early before ‘go’ cue 10.3%, no response 1.1%).
Figure 1. ALM and thalamus are required for motor preparation.

a. Top, mouse reporting the location of a pole by directional licking. Contra / ipsi refer to the photoinhibited left hemisphere (cyan circle). Bottom, task structure (relevant to b-d).
b. Example behavioral session. Blue, contra licks; red, ipsi licks. Right, trial outcome; green dash, correct; orange dash, incorrect.
c. ALM photoinhibition. Left, schematic of photoinhibition. Right, behavioral performance. Circles,behavioral sessions (n = 84; 11 mice; error bars, standard deviation). ***, P < 0.001, paired t-test.
d. Thalamus photoinhibition (n = 9; 4 mice).
During the delay epoch, neurons in the anterior lateral motor cortex (ALM, centered on 2.5 mm anterior, 1.5 mm lateral3,24) show persistent activity that predicts licking direction (‘preparatory activity’)3,27. Unilateral photoinhibition of ALM during the delay epoch produced an ipsilateral response bias3,27, reducing performance for contralateral trials and increasing performance for ipsilateral trials (P < 0.001; paired t-test, Fig. 1c). These experiments confirm that ALM preparatory activity during the delay epoch is causally involved in motor preparation3.
Preparatory activity could be maintained by recurrent circuits within ALM. Alternatively, additional brain areas, coupled to ALM by long-range excitatory connections, might be required. Inhibiting one of these brain areas might produce a similar behavioral bias as inhibiting ALM. Within cortex, ALM forms reciprocal connections with contralateral ALM24,27, ipsilateral primary motor cortex (M1), and ipsilateral somatosensory cortex (Extended Data Fig. 1a,b,e). However, photoinhibiting cortical locations outside of ALM during the delay epoch (55 locations, covering the dorsal cortex, ∼50% of neocortex), did not produce behavioral effects3,24.
ALM also makes reciprocal excitatory connections with several ipsilateral thalamic nuclei (AP: -1.1 ∼-2.3mm; ML: 0∼1.6mm; DV: 3.3 ∼4.8mm relative to bregma), including ventral medial (VM), and parts of ventral anterior-lateral (VAL), medial dorsal (MD), posterior (PO) and intralaminar nucleus19-22 (Extended Data Fig. 1c,d,e) (we refer to the thalamic nuclei reciprocally connected with ALM together as ‘thalALM’). Within thalALM, the VM/VAL complex was most extensively and consistently labeled in experiments involving injections of multiple types of anterograde and retrograde tracers into ALM (Extended Data Fig. 1f); we therefore focus inactivation experiments on VM/VAL. However, our perturbation methods do not have sufficient resolution to exclude contributions from other thalALM nuclei.
To determine if thalamus plays roles in motor preparation, we photoinhibited thalALM during the delay epoch (Fig. 1d). We injected Cre-dependent ChR2 virus into the thalamic reticular nucleus (TRN) of Gad2-cre transgenic mice29,30. Photostimulating axonal terminals of TRN GABAergic neurons in thalamus reduced spike rates in thalALM (recorded near VM/VAL, to 67.8% during the delay epoch; Extended Data Fig. 2). Similar to ALM, unilateral photoinhibition of thalALM during the delay epoch reduced performance for contralateral trials and caused a small improvement in performance for ipsilateral trials (P < 0.001 for contralateral trials, not significant for ipsilateral trials, paired t-test; Fig. 1d).
We confirmed the behavioral effect of thalALM photoinhibition using pharmacological inhibition (muscimol, 1.8 – 5.9 ng), which has better spatial specificity (approximately 0.5 mm)31. Inhibition near VM/VAL produced ipsilateral bias in the licking response (Extended Data Fig. 3a, b). Inhibition outside of thalALM (1.1 - 1.6 mm anterior or 1.6-1.9 dorsal to VM/VAL) did not cause ipsilateral bias, even at 10-fold higher doses (Extended Data Fig. 3c-f). Thus both ALM and thalALM are required for motor preparation.
Preparatory activity in thalamus
We recorded single-units from ALM or thalALM in behaving mice. In ALM we focused on putative pyramidal neurons (n = 1006/1214 neurons; 10 mice; left ALM; Extended Data Fig. 4; Methods) because they potentially project to thalALM or excite neurons that project to thalALM (Fig. 2a, b). For a majority of neurons, activity differed across trial types (70%, 704/1006; P < 0.05, t-test; Methods). Selectivity for movements emerged in the sample epoch, increased throughout the delay epoch, and reached a maximum at the beginning of the response epoch (Fig. 2b, e, Extended Data Fig. 4c)3,27. ALM neuron responses were diverse: subsets of neurons showed selective preparatory activity (Fig. 2b, left column; Fig. 2e, 145/1006), selective peri-movement activity during the response epoch (Fig. 2b, right column; Fig. 2e, 272/1006), or both (Fig. 2b, middle column; Fig. 2e, 287/1006). Approximately equal numbers of neurons preferred contra- or ipsi-lateral movements (Fig. 2e), consistent with previous recordings3,4,27.
Figure 2. ALM and thalamus show similar neural dynamics.
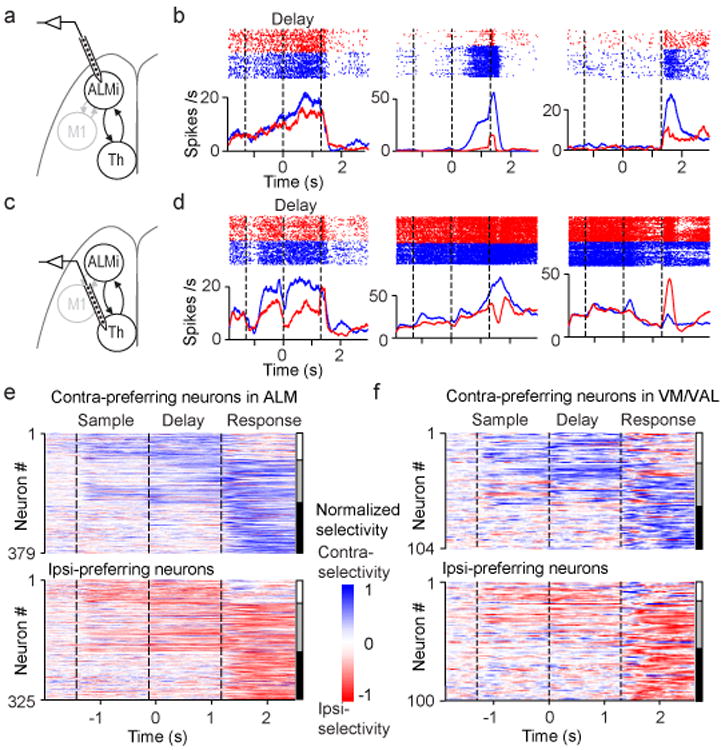
a. Silicon probe recordings in ALM (relevant to b, e).
b. Three example ALM neurons. Top, spike raster. Bottom, peri-stimulus time histogram. Blue, correct contra trials; red, correct ipsi trials. Dashed lines separate behavioral epochs.
c. Silicon probe recordings in VM/VAL (relevant to d, f).
d. Three example VM/VAL neurons. Same format as b.
e. ALM population selectivity (n = 704). Vertical bars on the right; white, neurons with preparatory activity only; grey, both preparatory activity and peri-movement activity; black, peri-movement activity.
f. VM/VALpopulation selectivity (n = 204). Same format as e.
We next recorded single-units from left thalamus (n = 790; 11 mice) (Fig. 2c, d). A subset of these units (n = 295) were in VM/VAL, with the others in surrounding thalamus outside of thalALM (Extended Data Fig. 4). A majority of VM/VAL neurons discriminated trial types (69%, 204/295; indistinguishable from ALM, chi-squared test, P = 0.79). Selectivity emerged in the sample epoch, increased throughout the delay epoch, and reached a maximum during the response epoch (Fig. 2d, f, Extended Data Fig. 4f). VM/VAL neurons exhibited similar selectivity and time-course to ALM (chi-squared test, P > 0.5): subsets of neurons showed selective preparatory activity (Fig. 2d, left column; Fig. 2f, 43/295 neurons), selective peri-movement activity during the response epoch (Fig. 2d, right column; Fig. 2f, 82/295), or both (Fig. 2d, middle column; Fig. 2f, 79/295). VM/VAL neurons thus showed similar preparatory activity to ALM neurons.
Thalamus drives ALM preparatory activity
Our behavioral and electrophysiological data show that ALM and thalALM contribute to motor preparation. We asked if ALM preparatory activity is influenced by thalALM, or vice versa. We recorded from ALM neurons while photoinhibiting ipsilateral thalALM (Fig. 3a; Extended Data Fig. 2, Methods). We photostimulated GABAergic axons near thalALM, using VGAT-ChR2-EYFP mice3,32 in which a larger fraction of GABAergic axons express ChR2, compared to virus-injected mice. Photoinhibition abolished thalALM activity nearly completely (to 2 % of control without photoinhibition) (Fig. 3f) and indirectly also the activity of ALM neurons (Fig. 3b-e). We measured ALM activity for 100 ms, starting 20 ms after light onset of thalALM photoinhibition; this time window excludes the subsequent transient rebound activity in thalALM and ALM observed during prolonged photoinhibition (Extended Data Fig. 2). ThalALM photoinhibition decreased ALM activity to 6% of control, reducing activity in nearly all neurons (Fig. 3c, 309/314 inhibited, 3/314 activated, 155/314 significantly inhibited, 0/314 significantly activated, t-test, P < 0.05), across all cortical layers (Fig. 3d) (neurons showing preparatory activity, peri-movement selectivity or both were equally inhibited; Fig. 3b, P > 0.2, t-test).
Figure 3. Thalamus drives ALM.

a. Recording in ALM during thalamus photoinhibition (panels b-e).
b. Three example neurons. Same format as Fig. 2b.
c. Spike rates during 20-120 ms after photostimulus onset. Filled circles, neurons that were significantly modulated by thalamus photoinhibition (P < 0.05, t-test). Dotted line, unity line. Inset, blow-up of the scatter plot.
d. Number of modulated ALM neurons across cortical depth.
e. Average time-course of ALM neurons during thalamus photoinhibition. Black, control PSTH; blue, photoinhibition (n = 314). Shading, SEM. Arrow, onset of ALM inhibition.
f. Top, recording in thalamus during thalamus photoinhibition. Bottom, average time-course of thalamic neurons (n = 148). Same format as e.
g. Top, whole-cell recording in ALM during thalamus photoinhibition. Bottom, thick lines, time-course of mean membrane potential (Black, control; blue, photoinhibition) (n = 16 cells). Thin lines, individual neurons.
Compared to extracellular recordings, membrane potential measurements provide a more precise time-course of the effects of thalALM photoinhibition in ALM. In addition, membrane potential recordings can distinguish a reduction of excitation from an increase in inhibition as proximal cause for the collapse of ALM activity33. Whole-cell recordings revealed that the average membrane potential of ALM neurons was close to the spike threshold during the delay epoch (action potential threshold - mean basal membrane potential = 12.7 ± 0.7 mV; mean ± SEM, n = 60 cells), consistent with the relatively high spike rates in ALM. ThalALM photoinhibition caused hyperpolarization (Membrane potential, control trials –photoinhibition trials, -18.7 ± 1.1 mV; measured for 100 ms, starting 20 ms after photostimulus onset; mean ± SEM, n = 16 cells), preventing ALM neurons from spiking (Fig. 3g, 4b, Extended Data Fig. 5a, b). Manipulating the membrane potential during recording revealed that hyperpolarization was mainly caused by a reduction in excitation, not an increase in inhibition (Extended Data Fig. 5c-n). This implies that thalALM is a major driver of ALM neurons.
Figure 4. Comparison of thalamic and cortical input.

a. Whole-cell recording in ALM during thalamus photoinhibition (panels b-c).
b. Time-course of mean membrane potential in ALM neurons during thalamus photoinhibition (n = 16 cells). Shading, SEM. Panels e and h follow the same format. Two hundred milliseconds after photostimulation onset, the membrane potential transiently recovered, likely caused by a concomitant rebound in thalALM activity (Extended Data Fig. 2).
c. Mean membrane potential during 20-120 ms after photostimulus onset. Filled circles, neurons that were significantly modulated by photoinhibition (P < 0.05, t-test). Dotted line, the unity line. Panels f and i follow the same format.
d-g. Whole-cell recording in ALM during M1 photoinhibition (n = 11 cells).
g-i. Whole-cell recording in ALM during contralateral ALM photoinhibition (n = 9 cells).
We explored if the reduction of ALM activity is a direct consequence of loss of input from thalALM. Given that thalamic areas near thalALM project to M1, ALM activity could be affected through the thalamus → M1 → ALM pathway. First, we computed the time between loss of thalALM activity and reduction in ALM activity (‘latency difference’). Photoinhibition reduced thalALM activity 2.5 ± 0.8 ms after photostimulus onset (mean ± SEM, activity reduction onset detected by 3 × std, Fig. 3f). Hyperpolarization of ALM neurons and reduction of ALM spike rates were detected 7.9 ± 1.7 ms and 8.2 ± 1.5ms after photostimulus onset, respectively (mean ± SEM, Fig. 3e, g). The latency difference, 5.4 ms, is explained by the thalALM → ALM conduction delay (3.6 ± 1.1 ms) and the delay caused by the time-constant of ALM neurons (at least 1.8 ± 0.7 ms; Extended Data Fig. 6, Supplementary information). The thalamus → M1 → ALM pathway would produce a latency difference of > 14.3 ms, too slow by > 9 ms to explain the hyperpolarization in ALM (Extended Data Fig.6).
Second, direct photoinhibition of M1 during the delay epoch (silencing >90% of spikes in a cortical area of 1 mm radius, Methods) caused only a slight hyperpolarization of the membrane potential and spike rates of ALM neurons (-3.3 ± 1.0 mV; -1.4 ± 0.6 spikes per s; mean ± SEM, n = 11 cells) (Fig. 4d-f). These findings imply that the thalALM → M1 → ALM pathway cannot explain membrane potential changes in ALM during thalALM photoinhibition. We conclude that thalALM drives ALM directly.
We tested if the coupling between ALM and thalALM is stronger than coupling with other reciprocally connected structures (Extended Data Fig. 1d). Photoinhibiting M1, including a large number of ALM-projecting neurons, had a negligible effect on ALM activity (Fig. 4d-f). Similarly, photoinhibiting contralateral ALM, the anatomically strongest input to ALM, barely changed membrane potential (-1.4 ± 0.5 mV; mean ± SEM, n = 9 cells) and has little effect on preparatory activity 24 (Fig. 4g-i). Altogether thalALM drives ALM directly and more strongly than other reciprocally connected structures (cf. Fig. 4b vs Fig. 4e,h).
Thalamus contributes to selectivity in ALM
We asked if thalALM contributes to selectivity in ALM or is simply required to maintain spike rates in ALM without affecting selectivity. Strong silencing of thalamus erased ALM activity (Fig. 3, 4), making contributions of thalamus to ALM selectivity hard to quantify. However, we noticed that the few neurons that maintained activity after thalALM silencing lost selectivity (e.g. Fig. 3b; Neuron 2). We thus searched for conditions where photoinhibition of thalALM has modest effects on activity but larger effects on selectivity. We used 20-fold weaker photostimuli compared to the experiments in Fig. 3 and 4 (stimulating in VGAT-ChR2-EYFP mice, 0.5 mW, 473 nm light). 83 /160 of ALM neurons showed statistically significant changes in mean spike rate during photoinhibition (t-test; average reduction of spike rate, 1.2 ± 0.2 spikes per s, mean ± SEM, n = 160; Fig. 5a, b). A substantial fraction of these neurons (39%, 32/83) showed increases in spike rate, inconsistent with thalamus providing uniform additive drive to ALM.
Figure 5. Thalamic activity maintains selectivity in ALM.

a. Recording in ALM during weak thalamic photoinhibition (panels b-d).
b. Spike rates were measured for 1300 ms during photoinhibition and control conditions. Filled circles, neurons that were significantly modulated by thalamus photoinhibition (P < 0.05, t-test, n = 160).
c. Relationship between selectivity of individual neurons and changes in selectivity due to photoinhibition of thalamus. Dotted line, linear regression (slope = -0.33, Pearson correlation coefficient = -0.75). Filled circles, the same as in b.
d. Three example neurons. Same format as Fig. 2b.
This unequal spike rate change reduced the selectivity of ALM neurons in both contra- and ipsi- preferring neurons (Fig. 5c, d and Extended Data Fig. 7a, b). A reduction in selectivity was seen even for neurons that did not show a change in mean spike rate (e.g. Fig. 5c, white circles; Fig. 5d, cell 2). Altogether, these results support the idea that thalamus is necessary to maintain ALM spike rates and selectivity during motor preparation.
We implemented network models of selective persistent activity (Extended Data Fig. 7c-e, Supplementary information). Our data are inconsistent with linear models with either specific (like-to-like) or non-specific (all-to-all) thalamocortical connectivity. However, our data do not exclude non-linear models with specific or non-specific thalamocortical connectivity (Extended Data Fig. 7d). Methods to manipulate thalamic neurons differentially based on their selectivity will be required to distinguish between architectures of non-linear models.
ALM drives thalamic preparatory activity
We next asked if thalALM activity is influenced by ALM. We recorded from VM/VAL neurons while photoinhibiting the ipsilateral ALM during the delay epoch (Fig. 6a). Photoinhibition of ALM diminished activity of VM/VAL neurons (Fig. 6b). VM/VAL neurons selective during sample, delay or response epochs were equally inhibited (Fig. 6b, P > 0.2, t-test). We measured activity for 100 ms, starting 20 ms after photostimulus onset. ALM photoinhibition decreased activity in a majority of VM/VAL neurons (to 25% of control; 190/201 inhibited, 11/201 activated, 139/201 significantly inhibited, 0/201 significantly activated, P < 0.05, t-test, Fig. 6c). This reduction of activity was mainly limited to VM/VAL (Fig. 6d, Extended Data Fig. 8a-c), in the vicinity of ALM projections (Extended Data Fig. 1).
Figure 6. ALM drivesthalamus.

a. Recording in VM/VAL during ALM photoinhibition (panels b-e).
b. Three example neurons. Same format as Fig. 2b.
c. Top, spike rates during 20-120 ms after photostimulus onset. Filled circles, neurons that were significantly modulated by ALM photoinhibition (P < 0.05, t-test). Dotted line, unity line. Bottom, relationship between change of spike rates due to photoinhibition and delay epoch selectivity. Filled circles, same as in the top. Dotted line, linear regression (slope = -0.73, Pearson correlation coefficient = -0.33). Inset, delay epoch selectivity of significantly (black bar) and non-significantly (white bar) modulated neurons (P = 0.002, t-test).
d. Locations of recorded neurons in thalamus. Neurons were color coded based on their spike rate during ALM photoinhibition normalized by the spike rate without ALM photoinhibition (Methods).
e. Left, time course of VM/VAL activity during ALM photoinhibition (n = 201 neurons). Right, time course of activity in ALM pyramidal neurons during ALM photoinhibition (n = 256 neurons). Same format as Fig. 3e.
A small fraction of neurons in VM/VAL was not changed by ALM photoinhibition. These neurons also showed significantly less selectivity (Fig. 6c, P = 0.002, t-test). In contrast, VM/VAL neurons with strongly reduced activity after ALM photoinhibition carried trial type information (Fig. 6c). This suggests that selectivity in VM/VAL requires ALM input.
We next determined if the reduction in thalALM activity is caused by loss of excitation from ALM pyramidal neurons. We considered three alternatives. First, photoinhibiting the nearby vibrissal primary motor cortex (vM1), which projects to parts of VA/VL, did not cause a reduction in thalALM activity (Extended Data Fig. 8d-g), excluding the ALM → vM1 → thalALM pathway. Second, GABAergic neurons in ALM do not project to thalALM (Extended Data Fig. 8h, i), excluding direct photoinhibition of thalALM.
Third, the basal ganglia nucleus substantia nigra reticulata (SNr) inhibits thalALM through GABAergic projections34 (Extended Data Fig. 9). ALM could potentially decrease thalALM activity by increasing the activity of SNr neurons via the striatum or subthalamic nucleus34. However, recordings from SNr neurons during ALM photoinhibition argue against this possibility (Extended Data Fig. 10, Methods). Together these experiments imply that ALM drives VM/VAL directly.
Discussion
Local recurrent connectivity is often invoked as a mechanism for persistent activity12,13,35. Our results show that persistent preparatory activity cannot be sustained by recurrent excitation within cortical circuits alone29, but in addition require recurrent excitation through cortico-thalamocortical loop. In activation of thalALM resulted in strong hyperpolarization of ALM neurons. The mechanisms underlying this powerful driving influence of thalALM over ALM, compared to the influence of cortical areas, represent an important area for future investigation.
We further identify frontal cortex (ALM) as a major source of driving excitation to higher-order thalamus (thalALM)36-38. Thalamus also receives input from the deep cerebellar nuclei, the superior colliculus and the SNr (Extended Data Fig. 9), and these subcortical structures in turn receive direct or indirect input from ALM27. The precise roles of these more complex loops during motor preparation and movement initiation remain to be elucidated37,39. Thalamus may work as a hub to convey subcortical signals to ALM.
Besides VM/VAL, ALM interacts with the posterior, intralaminar and midline thalamic nuclei (Extended Data Fig. 1). These nuclei project axons widely across the cerebral cortex and have been implicated in attention, awareness, arousal, consciousness, memory, voluntary movements and other functions40-43. Dissecting the distinct roles of these different nuclei will require manipulating specific nuclei using molecular methods. Given the wide-spread reciprocal connectivity between the frontal cortex and thalamus20,21,44 persistent activity in cortical areas outside of ALM in different behavioral contexts likely also depend on thalamocortical loops.
Methods
Mice
This study is based on data from 71 mice (age > P60, we used both male and female) (Supplementary Table 1, 2). We used six transgenic mouse lines: PV-IRES-Cre45, Ai32 (Rosa-CAG-LSL-ChR2(H134R)-EYFP-WPRE, JAX 012569)46, VGAT-ChR2-EYFP32, Gad2-IRES-Cre (a gift from Boris Zemelman), Ai35D (Rosa-CAG-LSL-Arch-GFP-WPRE, JAX 012735)46, and Olig3-cre47.
All procedures were in accordance with protocols approved by the Janelia Institutional Animal Care and Use Committee. Detailed information on water restriction, surgical procedures and behavior have been published3,28. All surgical procedures were carried out aseptically under 1-2 % isofluorane anesthesia. Buprenorphine HCl (0.1 mg/kg, intraperitoneal injection; Bedford Laboratories) was used for postoperative analgesia. Ketoprofen (5 mg/kg, subcutaneous injection; Fort Dodge Animal Health) was used at the time of surgery and postoperatively to reduce inflammation. After the surgery, mice were allowed free access to water for at least three days before start of water restriction. Mice were housed in a 12:12 reverse light:dark cycle and behaviorally tested during the dark phase. A typical behavioral session lasted 1 to 2 hours and mice obtained all of their water in the behavior apparatus (approximately 1 ml per day; 0.3 ml was supplemented if mice drank less than 0.5 ml). On other days mice received 1 ml water per day.
Mice were implanted with a titanium headpost 28. For ALM photoinhibition, mice were implanted with a clear skull cap3. Optical fibers for photostimulation or cannulae for muscimol infusion were implanted during the headpost surgery or after behavioral training. Craniotomies for recording were made after behavioral training. All coordinates are given with respect to bregma (anterior-posterior, AP; medial-lateral, ML; dorso-ventral, DV).
Behavior
A metal pole (diameter, 0.9 mm) was presented in one of two locations3,28 (Fig. 1). The two pole locations were 8.58 mm apart along the anterior-posterior axis. The posterior pole position was 5 mm from the whisker pad. Whiskers made contacts with the object at both pole locations, more strongly in the posterior location. A two-spout lickport (4.5 mm between spouts) was used to record licking events and deliver water rewards.
At the beginning of each trial, the pole moved within reach of the whiskers (0.2 s travel time) (Fig. 1a) for 1 second, after which it was retracted (0.2 s retraction time). The sample epoch (1.3 s total) was the time from onset of pole movement to 0.1 s after the pole started to retract (Fig. 1a). The delay epoch lasted for another 1.2 seconds after completion of pole retraction (1.3 s or 1.2 s total). An auditory ‘go’ cue separated the delay and the response epochs (pure tone, 3.4 kHz, 0.1 s). Licking early during the trial (‘lick early’ trials) was punished by an ‘alarm’ sound (siren buzzer, 0.05 s duration), followed by a timeout (1-1.2 s). After the ‘go’ cue licking the correct lickport produced a water reward (approximately 3 μL); licking the incorrect lickport triggered a timeout (0-5 s). Trials in which mice did not lick within 1.5 seconds after the ‘go’ cue (‘no response’ trials) were rare and typically occurred at the end of behavioral sessions. These ‘no response’ trials and ‘lick early’ trials were excluded from analyses (Fig. 1-6).
Virus and tracer injection
ALM (AP 2.5 mm; ML 1.5mm; diameter 1.5 mm) is the cortical area that produced behavioral effects with photoinhibition during the delay epoch 3,24. For the thalamic reticular nucleus the coordinate was AP -0.7, ML 1.6, DV 3.7 - 3.3 mm, as retrograde labeling from thalALM showed labeling in this sector of the thalamic reticular nucleus (Extended Data Fig. 9). Virus and tracer were injected through the thinned skull using a volumetric injection system (modified from Mo-10 Narishige) 48. Glass pipettes (Drummond) were pulled and beveled to a sharp tip (outer diameter ∼ 20 - 30 μm), back-filled with mineral oil and front-loaded with viral suspension immediately before injection. The injection rate was 15 nl/min. See Supplementary Table 2 for description of viruses and injection coordinates used for each experiment. We used the following viruses and tracers: AAV2/1-CAG-EGFP (Penn vector Core, University of Pennsylvania), AAV2/10 CAG-flex-ChR2(H134R)-tdTomato (Penn vector Core, University of Pennsylvania), AAV1-CAG-mRuby2-FLAG49, WGA-Alexa Fluor® 555 (Thermo Fisher Scientific)50 (WGA555), and Red RetroBeads (Lumafluor).
Histology
For anterograde and retrograde anatomy27,51 (Extended Data Fig. 1, 8 and 9) mice were perfused transcardially with PBS followed by 4% PFA / 0.1 M PB. The brains were fixed overnight and transferred to 20 % sucrose before sectioning on a freezing microtome. Coronal 50 μm free-floating sections were processed using standard fluorescent immunohistochemical techniques. All sections were stained with NeuroTrace® 435/455 Blue Fluorescent Nissl Stain (Thermo Fisher Scientific, N21479). Slide-mounted sections were imaged on a Zeiss microscope with a Ludl motorized stage controlled with Neurolucida software (MBF Bioscience). Imaging was done with a 10× objective and a Hamamatsu Orca Flash 4 camera. Each coronal section was made up of 80–200 tiles merged with Neurolucida software.
To reconstruct recording and photostimulation locations (Extended Data Fig. 2, 4), mice were perfused transcardially with PBS followed by 4% PFA / 0.1 M PB. The brains were fixed overnight and sectioned on a microtome at 100 um thickness. Images were acquired on a macroscope (Olympus MVX10). Electrode tracks labeled with DiI were used to determine the recording locations. Tissue damage caused by optical fibers was used to determine photoinhibition locations.
For cell counting (Extended Data Fig. 1d), neurons labeled with WGA555 were detected using Neurolucida software (MBF Bioscience, Williston, VT). The whole brain image stack was registered to the Allen Institute Common Coordinate Framework (CCF) of the mouse brain using a Matlab based script (Mike Economo, Janelia Farms). The coordinates of detected WGA555 labeled neurons were counted in the brain structures annotated in the Allen reference atlas.
We used Fluorender52 to create 3D reconstructed images of anterograde and retrograde signal (Extended Data Fig. 1e). GFP signals and densities of retrogradely labeled cells were overlaid. Cell densities were based on the cell counts described above. For individual retrogradely labeled neurons, number of other surrounding retrogradely labeled neurons within ±100 μm cube were counted to estimate cell density.
Muscimol infusion
Cannulas (26GA, PlasticsOne) were implanted bilaterally near VM/VAL and control locations (Extended Data Fig. 3; cannula coordinates, Supplementary Table 1). An injection needle was inserted into the guiding cannula, projecting 1.7 mm beyond the cannula tip. Muscimol∙HBr (3 - 100 ng, Sigma-Aldrich) dissolved in 50 nl cortex buffer (125 mM NaCl, 5 mM KCl, 10 mM glucose, 10 mM HEPES, 2 mM MgSO4, 2 mM CaCl2. Adjust pH to 7.4) was injected through the volumetric injection system. The control solution was cortex buffer without muscimol.
Control behavior was paused after mice performed 120-200 trials in a session and muscimol was infused for 4.5±0.7 mins (mean ± SD, n = 50), after which behavior resumed. As the infusion step requires pausing behavior, which by itself can increase behavioral variability, identical procedures were also performed without infusion. After the last session of muscimol infusion, fluorescent muscimol bodipy (100 ng in 100 nl DMSO) was infused and mice were perfused immediately. Fluorescence and tissue damage caused by the injection needle were used to identify muscimol infusion locations. Each muscimol concentration was tested once per injection site.
For muscimol infusions near VM/VAL, the ipsilateral bias lasted for the whole session (Extended Data Fig. 3b). After mice were released from head-fixation, ipsilateral circling was scored in the home cage. With the small dose of muscimol tested (1.8 - 5.9 ng), we did not observe circling (data not shown)53.
Photoinhibition
Supplementary Table 1 provides coordinates and photostimulus power for each experiment. Photoinhibition was deployed on 25% (Fig. 1, 3a-f, 6) or 25-50% (Fig. 3g, 4) behavioral trials. To prevent mice from distinguishing photoinhibition trials from control trials using visual cues, a ‘masking flash’ (40 × 1ms pulses at 10 Hz) was delivered using 470 nm LEDs (Luxeon Star) near the eyes of the mice throughout the trial. Trimming whiskers prevents mice from performing this task3.
Photostimuli from a 473 nm laser (Laser Quantum) were controlled by an acousto-optical modulator (AOM; Quanta Tech) and a shutter (Vincent Associates). Photoinhibition of ALM was performed through the clear-skull cap (beam diameter at the skull: 400 μm at 4 σ). We stimulated parvalbumin-positive interneurons in PV-IRES-Cre mice crossed to Ai32 reporter mice expressing ChR2 (Fig. 1 and 6, Extended Data Fig. 8, 10). Behavioral and electrophysiological experiments showed that photoinihibition in the PV-IRES-Cre × Ai32 mice was indistinguishable from the VGAT-ChR2-EYFP mice (data not shown)3.
To silence cortex during the delay epoch (Fig. 1, 6, Extended Data Fig. 8, 10), we photostimulated for 1.3 s, including the 100 ms ramp, starting at the beginning of the epoch. Photoinhibition silences a cortical area of 1 mm radius (at half-max) through all cortical layers. We used 40 Hz photostimulation with a sinusoidal temporal profile (1.5mW average power) and a 100 ms linear ramp during the laser offset (this reduced rebound neuronal activity)3. The light transmission through the intact skull is 50%3. See Supplementary Table 1 for the animals, coordinate and power used for each experiments.
To silence thalamus, the photostimuli were delivered through a 200 μm diameter optical fiber (Thorlabs). We used a continuous photostimulus with a 100 ms linear ramp at the offset (Fig. 1d, 3-5). The photostimulus was applied for 1.2 - 1.3 s, including the 100 ms ramp, starting at the beginning of the delay epoch and terminating at the end of delay epoch. Photoinhibition reduced activity (0.5-1.1 mm from the tip of the optical fiber) to 15.9 ± 9.3% (Mean ± SEM, Extended Data Fig. 2d).
Based on retrograde labeling (Extended Data Fig. 1), we silenced at least 16,558 ALM-projecting thalamic neurons. For M1 silencing, we silenced at least 26,599 ALM-projecting neurons within a 1 mm radius from the laser center. In contralateral ALM we silenced at least 38,062 neurons projecting to the recorded side of ALM (Extended Data Fig. 1d).
To silence thalamus for behavioral experiments (Fig. 1) and current injection experiments (Extended Data Fig. 5), we avoided stimulating any uncharacterized GABAergic projection neurons. We expressed ChR2 selectively in the TRN, by injecting AAV2/10 CAG-flex-ChR2(H134R)-tdTomato into TRN of Gad2-IRES-Cre mice. We implanted an optical fiber over VM/VAL, but other thalamic nuclei projecting to ALM were also likely affected (Extended Data Fig. 2).
Extracellular electrophysiology
Recordings were made from the left hemisphere. Recording locations were deduced from electrode tracks (Histology; Extended Fig. 4). For ALM recordings, a small craniotomy (diameter, 1 mm) was made one day prior to the recording session3. Extracellular spikes were recorded using NeuroNexus silicon probes (Part# A4×8-5mm-100-200-177) or Janelia silicon probes (Part# A2×32-8mm-25-250-165). The 32 or 64 channel voltage signals were multiplexed, recorded on a PCI6133 board at 312.5 kHz or 400 KHz (National instrument), and digitized at 14 bit. The signals were demultiplexed into the 32 or 64 voltage traces, sampled at 19531.25 or 25000 Hz respectively and stored for offline analyses. 3-5 recording sessions were obtained per craniotomy. Recording depth was inferred from manipulator readings and verified based on histology3. The craniotomy was filled with cortex buffer and the brain was not covered. The tissue was allowed to settle for at least ten minutes before the recording started.
For VM/VAL recordings, a small craniotomy was made over the dorsal medial somatosensory cortex (center, bregma AP -1.5 mm, ML 1.8 mm). For optrode recording from VM/VAL, we used NeuroNexus silicon optrodes (A4×8-5mm-100-400-177 with a 105 μm diameter optical fiber placed 200 μm above recording sites on the inner right shank). For SNr recordings, a small craniotomy was made over the visual area (center, bregma AP -3.5 mm, ML 3 mm). Electrodes were driven down about 4.5 mm to reach SNr. Retrobeads injected near VM/VAL labeled SNr extensively in the caudal-rostral and medial-lateral directions (Extended Data Fig. 9)54. Our recording probes (spanning medial lateral 600 μm) sampled a large region of SNr (medial, lateral, rostral and caudal). The effects of ALM photoinhibition on SNr activity did not vary spatially and the data where pooled.
In vivo whole-cell recording (also see Supplementary information)
Whole-cell recordings were made using pulled borosilicate glass (Sutter instrument, CA)55. A small craniotomy (100 - 300 μm diameter) was created over ALM or M1 (bregma AP 0.0 mm, ML 2.0 mm) under isofluorane anesthesia and covered with cortex buffer during recording. Whole-cell patch pipettes (7-9MΩ) were filled with internal solution (in mM): 135 K-gluconate, 4 KCl, 10 HEPES, 0.5 EGTA, 10 Na2-phosphocreatine, 4 Mg-ATP, 0.4 Na2-GTP and 0.3% Biocytin (293-303 mOsm, pH 7.3). The membrane potential was amplified (Multiclamp 700B, Molecular Devices) and sampled at 20 kHz using WaveSurfer (wavesurfer.janelia.org). Membrane potentials were not corrected for liquid junction potential. After the recording the craniotomy was covered with Kwik-Cast (World Precision Instruments). Each animal was used for 2-3 recording sessions. Recordings were made from 350 to 850 μm below the pia. Neuronal responses to thalamic or cortical inactivation were similar across depths and were pooled for analysis.
To obtain mean membrane potential dynamics of each neuron (Fig. 3g, 4, Extended Data Fig. 5, 6), we clipped off action potentials. We found the point in the membrane potential where the derivative passed 3× times standard deviation from the baseline (‘kink’). Baseline and standard deviations were calculated from 2.5 ms to 1.5 ms before the spike peak. Points from -0.5 - 5 ms around the ‘kink’ were interpolated. The standard error of the mean (SEM) of the membrane potential was estimated by bootstrapping. The action potential threshold was defined as the difference between baseline membrane potential (0 - 0.5 sec before onset of each behavioral trial) and the spike threshold. Whole-cell recordings with more than 20 behavioral trials were pooled to calculate action potential thresholds and membrane time constants (n = 60).
The onset of the membrane potential change after photoinhibition (Fig. 3g and Extended Data Fig. 6b, e and f) was the time when the membrane potential changed by more than 3 standard deviations from the baseline. The baseline and standard deviation were calculated from 20 ms before the photostimulus onset until 2 ms after onset of the photostimulation trials. A similar procedure was used to estimate the onset of membrane potential change after thalamus photoactivation (Extended Data Fig. 6c). The standard error of mean of the onsets was determined based on bootstrapping.
Behavioral data analysis
Behavioral performance was the fraction of correct trials, excluding ‘lick early’ and ‘no response’ trials. We separately computed the performance for contra- and ipsi- trials relative to the manipulation side (Fig. 1, Extended Data Fig. 3). Behavioral effects of photoinhibition were quantified by comparing the performance with photoinhibition with control performance (Fig. 1c, d). Significance of the performance change was determined using student's t-test. Photoinhibition of ALM or thalamus caused only small changes in ‘lick early’ rates, ‘no response’ rates, and licking latency (Supplementary Information).
The performance change due to muscimol silencing was computed as the fraction of correct trials after infusion (the 100 trials immediately after muscimol infusion) relative to the fraction of correct trials before muscimol infusion (the 100 trials right before muscimol infusion). Performance change in muscimol condition was compared with that during control condition. Significance was determined using student's t-test (Extended Data Fig. 3). Muscimol infusion did not increase the ‘lick early’ rates (P > 0.1; paired t-test) and slightly increased the ‘no response’ rate from 0 to 1% (i.e. from no ‘no response’ trial to 1 ‘no response’ trial in a session, P = 0.02).
Electrophysiology data analysis
Detailed spike sorting procedures have been described3. Recording depths were estimated from histology3 (Extended Fig. 4). The extracellular recording traces were band-pass filtered (300-6k Hz). Events that exceeded an amplitude threshold (4 standard deviations of the background) were subjected to manual spike sorting to extract single units. For the weak thalamus inactivation experiments (Fig. 5), spikes were sorted using JRclust (program by James Jaeyoon Jun, APIG, Janelia Farm). Spikes were binned by 1ms and averaged over 200ms (Fig. 2, 3, 5, 6)
In ALM, 1214 single units were recorded across 57 behavioral sessions. Spike widths were computed as the trough-to-peak interval in the mean spike waveform. The distribution of spike widths was bimodal (Extended Data Fig. 4); units with width < 0.4 ms were defined as putative fast-spiking (FS) neurons (166/1214) and units with width > 0.6 ms as putative pyramidal neurons (1006/1214). This classification was previously verified by optogenetic tagging of GABAergic neurons3. Units with intermediate spike widths (0.4 - 0.6 ms, 42/1214) were excluded from our analyses. We concentrated our analyses of ALM on putative pyramidal neurons (Fig. 2, 3, 5).
In thalamus, 790 single units were recorded across 73 behavioral sessions. Unit locations were determined from the locations of the relevant recording sites, which in turn were reconstructed from histology (Extended Data Fig. 4). All units were recorded in a narrow range of anterior-posterior locations (between bregma -1 mm to -2 mm). We therefore overlaid units on one coronal section for spatial analysis (Bregma -1.76, Fig. 6d). Neurons in VM/VAL are excitatory. The distribution of spike widths was unimodal with a tail with short spike widths; this suggests that some units corresponded to GABAergic axons from TRN or SNr56. Units with spike width > 0.5 ms were selected as putative thalamic neurons (672/790) and we concentrated our analyses on these neurons. However, our conclusions (Fig. 2, 6) are valid if all the units were pooled. To select units in VM/VAL we applied a stringent spatial criterion; units within 0.4 mm from the VM/VAL center (determined from retrograde labeling experiments, Extended Data Fig. 1) were scored as VM/VAL neurons (313/790). This criterion could be relaxed to 1.0 mm from the VM/VAL center without changing our conclusions, as neurons within 1.0 mm from VM/VAL center showed robust inhibition (to 36% of control activity during the first 100 ms inhibition, also see Extended Data. Fig. 8b). Furthermore, randomly jittering neuron locations by 200 μm in the AP, ML and DV directions did not affect our conclusions.
In SNr, 227 single units were recorded across 23 behavioral sessions. SNr GABAergic neurons have narrower spike widths than dopaminergic neurons in the nearby substantia nigra pars compacta57. Units with spike trough to peak width < 0.45 ms were selected as putative GABAergic neurons (spike width at half max 0.143 ± 0.030 ms, 181/227). These units have high spike rates (40.9 ± 21.5, mean ± SD, n = 181). For comparison, neurons with longer spike widths have lower spikes rates (23.4 ± 17.0, mean ± SD, n = 46). We concentrated our analyses on putative GABAergic neurons. We used bootstrapping to test whether there were more neurons significantly down-modulated than up-modulated. The null hypothesis was that there were equal or more up-modulated neurons. In each round of bootstrapping, we replaced the original neurons with a re-sampled data set. The number of down-modulated and up-modulated neurons were counted and compared. The P value was the fraction of times the bootstrapping produced a consistent result as the null hypothesis.
Neurons were tested for trial type selectivity during the sample, delay, or response epochs by comparing spike counts during contra- and ipsi- trials (t-test, P < 0.05; Fig. 2, Extended Data Fig. 10). Neurons that significantly differentiated trial-types during any one of the trial epochs were deemed as “selective” (704/1006 in ALM, 204/295 in VM/VAL, 152/181 in SNr). Neurons with selectivity during the sample or delay epochs were classified as having “preparatory activity”. Neurons with significant selectivity during the response epoch were classified as having “peri-movement selectivity”. Selective neurons were classified into “contra-preferring” versus “ipsi-preferring”, based on their total spike counts across all three trial epochs (Fig. 2, Extended Data Fig. 10)27. To compute “contra-selectivity”, we took the firing rate difference between the contra-trials and ipsi-trials for each neuron. The “ipsi-selectivity” was computed similarly. Only trials in which mice correctly reported pole locations were included to compute selectivity.
For the peri-stimulus time histograms (PSTHs; Fig. 3, 5, 6 and Extended Data Fig. 7; except the top panels in Fig. 3b and 6b), correct and incorrect trials were included, as photoinhibition reduced neural activity irrespective of the response outcomes. To analyze the effects of photoinhibition, units with at least 5 (Fig. 3, n = 314 and Fig. 6, n = 201) or 25 (Fig. 5, n = 160) photoinhibition trials were selected. Bootstrapping was used to estimate standard errors of the mean (Fig. 3 and 6, Extended Data Fig. 2, 7, 8, 10). As the effect of photoinhibition began 10 - 20 ms after photostimulus, we used 20 to 120 ms after photostimulus onset to measure the amplitude of inactivation (Fig. 3, 6, Extended Data Fig. 10). For Fig. 3c, 5b and 6c top, both contra- and ipsi- trials were pooled to calculate mean spike rate. For Fig. 5c, Neurons with spike rates higher than 2 spikes per s during both control and photoinhibition conditions were included (n = 73).
The onset of inactivation was defined as the time when the membrane potential passed 3 times the standard deviation of the control condition. The standard deviation was calculated using the control condition during the delay epoch. Changing the duration used to calculate the standard deviation did not change the estimate of onset latency. We also detected the onset by comparing the PSTHs during the photoinhibition and control conditions using student's t-test, with consistent results. To estimate the standard error of mean of the inhibition onset, we randomly sampled neurons with replacement and used the bootstrapped data set to compute the onset of photoinhibition. This procedure was repeated 1000 times.
Statistics and data
The sample sizes are similar to sample sizes used in the field (more than 100 units per brain region). No statistical methods were used to determine sample size. We did not exclude any animal for data analysis. Trial types were randomly determined by a computer program. During spike sorting, experimenters cannot tell the trial type, so experimenters were blind to conditions. All comparisons using t-tests are two-sided. For behavioral test of thalamus inhibition (Fig. 1), the data points are normally distributed (tested using KS test). All bootstrapping was done over 1,000 or 10,000 iterations. Data sets will be shared at CRCNS.ORG in the NWB format 58 (https://doi.org/10.6080/K03F4MH2).
Extended Data
Extended Data Figure 1. ALM makes reciprocal connections with multiple cortical and thalamic areas.

a. Co-injection of adeno-associated virus (AAV2/1-CAG-GFP) for anterograde labeling, and Wheat Germ Agglutinin (WGA)-Alexa Fluor® 555 (WGA-Alexa555) for retrograde labeling50.
b. Labeling in the cortex. Retrograde and anterograde labeling was observed in contralateral ALM, ipsilateral M1 and ipsilateral somatosensory cortex (S1/ S2). Dashed boxes indicate the locations of the magnified images in the right panels. Green, anterograde label (GFP); magenta, retrograde label (WGA-Alexa555); blue, Nissl stain.
c. Labeling in the thalamus (same color scheme as in b). Anterograde labeling was found in ipsilateral thalamus (with a weak contralateral projection), whereas retrograde labeling was observed only in ipsilateral thalamus (top left). Representative confocal image of the thalamus (top right). Four coronal sections of ipsilateral thalamus are shown on the bottom left. The corresponding areas from the Allen Reference Atlas (http://mouse.brain-map.org/static/atlas) are shown on bottom middle. Anterograde and retrograde labeling are shown separately on bottom right. VM, ventral medial nucleus of the thalamus; VAL, ventral anterior-lateral nucleus of the thalamus; CM, centromedian nucleus of the thalamus; MD, medial dorsal nucleus of the thalamus; IMD, Intermediodorsal nucleus of the thalamus; PO, posterior nucleus of the thalamus; RT; thalamic reticular nucleus, ZI, zona incerta; fr, fasciculus retroflexus; im, internal medullary lamina of the thalamus; em, external medullary lamina of the thalamus; ml, medial lemniscus; mtt, mammillothalamic tract (Allen Reference Atlas).
d. Number of neurons labeled by retrograde injection into left ALM in cortical and subcortical areas. From left to right: 38062 (Contra ALM), 26599 (M1), 17375 (thalamus), 2532 (BLA: Basolateral Amygdala), 1312 (Pallidum and BF: basal forebrain), 427 (LC: Locus coeruleus), 377 (DRN: Dorsal Raphe Nucleus), 263 (VTA: ventral tegmental area), and 59 (HY: hypothalamus). The boundaries of cortical areas are poorly defined, we therefore limit the neuron counting to the regions manipulated in the photoinhibition experiments in Fig. 4 (Methods). Since labeling was more focused in subcortical areas we counted all neurons in these areas. Among ALM-projecting subcortical structures only the thalamus shows strong anterograde labeling from ALM (c and e).
e. Dorsal and posterior view of a brain reconstructed in 3D. (Left) Anterograde GFP signal. (Right) Anterograde GFP signal (green) overlaid with heatmap representing density of retrogradely labeled neurons (heatmap). For individual retrogradely labeled neurons, number of other surrounding retrogradely labeled neurons within ± 100 μm cube were counted to estimate cell density. Note several cortical areas (contra ALM, and ipsilateral cortical areas including ipsi M1) and ipsi-thalamus show both high anterograde and retrograde labeling.
f. Additional experiments using co-injection of adeno-associated virus (AAV2/1-CAG-FLAG) for anterograde labeling, and RetroBeads for retrograde labeling (Methods). RetroBeads provide spatially more restricted injection sites. (Left) Injection site in ALM. Retrograde labeling (red) is spatially restricted to the injection site in the center of ALM (with some spreading to layer 1 and the pia). The three other panels show the signal in the thalamus.
g. Neurons labeled by retrograde tracer injection into ALM were very rare in ZI (total count, 31+/-2 per brain). None of the labeled neurons were positive for somatostatin (a marker for cortex projecting GABAergic ZI neurons, data not shown)59. This excludes the possibility that ZI GABAergic neurons directly inhibit ALM during optogenetic manipulation of thalamus.
Extended Data Figure 2. Optical fiber locations and thalamus photoinhibition.

a. Left, schematic of thalamus photoinhibition through an optical fiber. Right, optical fiber locations were overlaid on a coronal section of the Allen Reference Atlas (n = 7 mice).
b. Schematic of thalamus recording during photoinhibition using an optrode.
c. Top, peri-stimulus time histogram (PSTH) of putative thalamic neurons recorded by an optrode during control (black) and photoinhibition (blue) conditions in Gad2-IRES-Cre mice. Virus expressing ChR2 in a cre-dependent manner was injected in the VM/VAL projection zone of TRN. The magnitude of photoinhibition depends on the overlap of light intensity and axonal ChR2 expression. The fiber optic was 1 mm dorsal of VM/VAL, which likely explains that photoinhibition was stronger 1 mm from the fiber than closer to the fiber output. Averaging window, 100 ms. Bottom, normalized spike rate (mean spike rate during photoinhibition divided by mean spike rate during control) versus distance from optical fiber. Error bar indicates standard deviation. n = 26, 41, 17 cells; distances 0.6, 0.8, 1.0 mm respectively. Laser power at the tip of optical fiber, 10 mW.
d. Top, PSTH of thalamic neurons recorded by an optrode during control (black) and photoinhibition (blue) conditions in VGAT-ChR2-EYFP mice. Averaging window, 100 ms. Bottom, normalized spike rate (mean spike rate during photoinhibition divided by mean spike rate during control) versus distance from optical fiber. Error bar indicates standard deviation. n = 34, 42, 38 cells; distances 0.6, 0.8, 1.0 mm respectively. Silencing extended beyond the VM/VAL and included other thalamic nuclei that project to ALM and nearby cortical areas. Silencing using VGAT-ChR2-EYFP was more potent than with Gad2-IRES-Cre mice (c). Laser power at the tip of optical fiber, 10 mW.
e. PSTH of ALM neurons during control (black) and thalamus photoinhibition (blue) conditions. Laser power at the tip of optical fiber 10mW, n = 314 cells. Averaging window 100 ms.
Extended Data Figure 3. Effects of thalamic muscimol infusions on behavior.

a. Muscimol infusion locations (red crosses) near VM/VAL. Sites from left (n = 3) and right (n = 3) hemispheres were mapped onto the left hemisphere.
b. Small muscimol infusion (1.5-5 ng) near VM/VAL produced ipsilateral bias. Left, performance change in contra-trials after muscimol infusion. Right, performance change in ipsi-trials after muscimol infusion. Each line represents an infusion site (n = 6, same mice as in a). *, P < 0.05.
c. Muscimol infusion locations in the anterior part of the thalamus (red crosses). Sites from left (n = 2) and right (n = 2) hemispheres were mapped onto the left hemisphere.
d. Muscimol infusions in the anterior part of the thalamus (∼ 0.3 – 0.8 mm anterior to VM/VAL; same mice as in c). Note that much higher muscimol concentrations (10 times of those used near VM/VAL), did not affect behavior.
e. Muscimol infusion locations in the dorsal part of the thalamus (red crosses). Sites from left (n = 2) and right (n = 2) hemispheres were mapped onto the left hemisphere.
f. Muscimol infusions in the dorsal part of the thalamus (∼ 0.2 - 0.5 mm dorsal to medial dorsal thalamus, same mice as in e). Note that much higher muscimol concentrations (10 times of those used near VM/VAL), did not affect behavior.
Extended Data Figure 4. Recording sites and neuron types recorded in ALM, thalamus and SNr.

a. Example electrode tracks in ALM labeled with DiI.
b. Single unit classification in ALM. Left, putative fast-spiking (FS) interneurons (red, n = 166) and putative pyramidal neurons (blue, n = 1006) were separated based on the histogram of spike widths (Methods)3. A small subset of neurons with intermediate spike durations were not classified (brown, n = 42). Right, mean spike waveform of each unit.
c. Left, average population selectivity in spike rate of ALM neurons. To compute population selectivity, we first determined each neuron's preferred trial type using spike counts from half of the trials; selectivity was calculated as the spike rate difference between the preferred and non-preferred trial types for the other half of trials. SEM was estimated by bootstrapping over neurons. Averaging window, 200 ms. Right, population response correlation of ALM neurons. The smoothed response was mean subtracted and normalized to the variance during the entire trial epoch. Pearson's correlation at a particular time was calculated between the population response vector at that time point and the population response vector at the onset of the response cue27.
d. Example electrode tracks in VM/VAL.
e. Single unit classification of neurons in thalamus. Left, putative thalamic neurons (blue, n = 672) were selected based on the histogram of spike widths (Methods). Right, mean spike waveform of each unit.
f. Average population selectivity in spike rate (left) and population correlation (right) of VM/VAL neurons.
g. Additional electrode tracks in the thalamus (n = 10 mice). Electrode tracks were used to determine if recorded neurons were in VM/VAL.
h. Example electrode tracks in SNr.
i. Single unit classification in SNr. Left, putative GABAergic neurons (red, n = 181) were selected based on the histogram of spike widths and their high spike rates (Methods). Right, mean spike waveform of each unit.
j. Spike rate of single units in SNr. Putative GABAergic neurons have a mean spike rate of 40.9 ± 21.5 (mean ± SD, n = 181). The other neurons have a mean spike rate of 23.4 ± 17.0 (mean ± SD, n = 46).
Extended Data Figure 5. Hyperpolarization of ALM neurons during thalamus photoinhibition is caused by loss of excitation.

a-b. Example ALM neuron during thalamus photoinhibition. Top, peri-stimulus time histogram (PSTH) during control (a) and photoinhibition trials (b). Correct contra- (blue) and ipsi- (red) trials only for control trials. All trials were included for photoinhibiting trials. Bottom, membrane potential during each trial type (10 trails each). Red and blue lines indicate the trial averaged membrane potential. Dashed lines separate behavioral epochs.
c-h. The time course of membrane potential changes in ALM putative pyramidal neurons after thalamus photoinhibition (non-behaving animals). (c) Recording in ALM during thalamus photoinhibition (relevant to panels below). Note: in this experiment thalamic photoinhibition was weak because this was based on cre-dependent ChR2 AAV injected near the VM/VAL projection zone of TRN in Gad2-IRES-Cre mice. Photoinhibition is much more potent in VGAT-ChR2 mice because the vast majority of TRN and SNr neurons are ChR2 positive. (d) Membrane potential changes after light onset were averaged during control (black) and photoinhibition (light blue) conditions (n = 14 cells). Thin lines, traces of individual neurons. Consistent with data of behaving VGAT-ChR2 animals (Fig. 3g), we observed weaker but significant hyperpolarization after light onset.(e) The time course of membrane potential change in ALM neurons during hyperpolarization with negative current injection (n = 9 cells). Because the membrane potential is near the reversal potential for inhibitory currents, but far from excitatory currents, the driving force for inhibition was reduced, and apparent excitatory signals were amplified. (f) The time course of membrane potential change in ALM for neurons during depolarization with positive current injection (n = 6 cells). Because the membrane potential is near the reversal potential for excitatory currents but far from inhibitory currents, driving force for excitation is reduced, and apparent inhibitory signal is amplified under this condition. (g) Relationship between membrane potential in non-photoinhibition condition vs. membrane potential changes with photoinhibition (ΔmV). Membrane potential and ΔmV were calculated between 100 ∼ 120 ms after the onset of light. Black circles: cells with significant change of membrane potential. Dotted line with broad dash indicates linear regression. Because input resistances during positive and negative current injections were similar (p = 0.05, ranksum test) (h), we plotted data from positive and negative current injections (i.e. excluding data without current injection because the input resistances were significantly higher). Slope of linear regression is larger than 0 (p < 0.0001, bootstrap), implying that hyperpolarization was larger during negative current injections. Hyperpolarization is therefore caused mainly by loss of excitation. Note that conductance changes affect amplitude of ΔmV but not the direction of change compared to the baseline. Moreover, we used low levels of photoinhibition (around 5mV) so that changes in the leak conductance should be minor compared to changes in synaptic conductance. None of the measurements were corrected for junction potential.
i-n. The time course of membrane potential change in ALM neurons during photoactivation of local parvalbumin (PV) positive neurons expressing ChR2. This experiment shows that silencing by increases in inhibition can be distinguished from loss of excitation with our method. Figures numbering as in c-h. (i) Recording in ALM during photoinhibition in PV-ires-cre mice crossed with Ai32 (Cre dependent ChR2 line) (relevant to panels below). We observed strong hyperpolarization of ALM neurons (n = 7 cells) (j). Furthermore, when we performed current injections under this condition, we found enhanced hyperpolarization during positive current injection and reduction of hyperpolarization during negative current injection (n = 5, 6 cells, respectively) (k and l). This is consistent with hyperpolarization caused by increases in inhibition. (m) Slope of linear regression is smaller than 0 (p < 0.0001, bootstrap), which indicates hyperpolarization was amplified more during positive current injection. This implies that hyperpolarization is mainly due to increased inhibition. Because input resistances during positive and negative current injections were similar (p = 0.662, ranksum test) (n), we combined data from positive and negative current injections (i.e. excluding without current injection data because the input resistance was significantly different). Note that the effect of current injection is opposite from that of thalamus inactivation (cf g).
Extended Data Figure 6. Onset of membrane potential changes after thalamic and cortical photoinhibition.

a. Contributions to the time of detected membrane potential change in ALM after photoinhibition of the thalamus. The time between photostimulus onset and silencing in thalamus is T1 = 2.5 ± 0.8 ms (Fig. 3f). The propagation delay from thalamus to the thalamic terminals in ALM is T2 = 3.6 ms (conduction delay; see panel c). An additional T3 = 1.8 ms are required to hyperpolarize the membrane potential of ALM neurons, because of the synaptic and membrane time constants. The sum of these components (T1 + T2 +T3) explains the measured latency (7.9 ± 1.7 ms). T2 + T3 is defined as the latency difference.
b. The time course of membrane potential change in ALM neurons after thalamus photoinhibition. Membrane potential changes after light onset were averaged during control (black) and photoinhibition (light blue) conditions (n = 16 cells). Thin lines, individual neurons. Other panels in this figure (c, e, f) follow the same format. Duplicate of Fig. 3g for comparison. The time between photoinhibition onset and hyperpolarization onset was 7.9 ± 1.7 ms.
c. The time course of membrane potential change in ALM neurons after thalamus photoactivation in non-behaving naïve Olig3-cre × Ai32 animals. Olig3-cre 47 labels thalamus specifically without labeling in cortex. The time between photostimulation onset and depolarization onset was 3.6 ± 1.1 ms (n = 9 cells). Since we used high intensity of laser power (10 mW), we assume spikes were generated in the thalamus within one millisecond. This time provides an estimate for the conduction delay of thalamocortical neurons (T2).
d. Model-based estimation of the time required to depolarize or hyperpolarize ALM neurons, corresponding to T3 in panel (a). We modeled an ALM neuron with input from 200 thalamic neurons (Left). We measured the onset of membrane potential changes in the ALM neuron when different fractions of the input neurons were photoactivated (black) or photoinhibited (blue). Conduction delay was set to 0 to isolate the effect of membrane and synaptic time constants. Traces or plots with different color indicate data with different fractions of activated/inhibited neurons: 10-100% (from lighter to darker). Middle, mean membrane potential traces, Right, latency (Mean ± SEM, n=300 per condition). Spikes are trimmed off to show Vm traces (Middle). Even when 100% of the input neurons were inhibited, we expect to observe latency of 1.8 ± 0.7 ms (Mean ± SEM). The detected onset of the postsynaptic effects of photoinhibition is sensitive to the fraction of neurons manipulated. See Supplementary information for details.
e. The time course of membrane potential change in M1 putative pyramidal neurons after thalamus photoinhibition during the delay epoch in behaving animals. The time between photoinhibition onset and hyperpolarization onset was 11.0 ± 2.4 ms (n = 9 cells). As it takes 2.5 ± 0.8 ms to reduce spike rates in thalALM after photostimulation onset, we estimate that it takes 8.5 ms for ThalALM to affect M1 activity.
f. The time course of membrane potential change in ALM neurons after M1 photoinhibition during delay epoch in behaving animals. The time between photoinhibition onset and hyperpolarization onset was 13.9 ± 3.2 ms (n = 11 cells). As it takes 8.1 ± 1.2 ms to silence cortex (Fig. 6e), this implies it takes approximately 5.8 ms for changes in M1 activity to affect ALM activity.
g. Summary of measured latencies. Time required to inhibit input structures is subtracted to show T2+T3.
Extended Data Figure 7. Effects of weak thalamus inhibition on ALM selectivity and models of thalamo-ALM interactions.

a. (Left, top) Average population PSTH, and (Left, bottom) population selectivity of contra-preferring ALM neurons. Here, contra-preferring neurons are defined as neurons with significantly higher spike rates during delay phase of contra-trials compared to ipsi-trials (t-test, P < 0.05). We included neurons with spike rates higher than 2 spikes per s during both control and inactivation conditions. Selectivity was calculated as the spike rate difference between the contra- and ipsi-trial types. Averaging window, 200 ms. (Middle, top) Average population PSTH, and (Middle, bottom) selectivity of contra-preferring ALM neurons during weak thalamic photoinhibition. (Right, top) Average spike rate changes, and (Right bottom) average selectivity changes caused by weak thalamic photoinhibition. SEM was estimated by bootstrapping over neurons. Blue, mean±SEM of contra-trials, Red, mean±SEM of ipsi-trials.
b. The same plot as in (a) for ipsi-preferring neurons.
c-e. We analyzed model networks to better understand the possible interactions between ALM and thalamus. The models consist of two neurons (left and right preferring neurons, blue and red, respectively at top panels) in both thalamus and ALM. Thalamus to ALM connections were either non-selective (c, d) or selective (e).
Activity of the right (blue) and left (red) preferring neurons during a lick right trial are plotted (2nd-4th panels from the top). Selective sensory input enters ALM during the sample phase, and selective activity is maintained during the delay phase without sustained input (2nd panels from the top). The models were tested in response to non-selective thalamic photoinhibition that was either strong (3rd panels from the top) or weak (4th panels from the top). During strong thalamus photoinhibition, activities of the right and left preferring neurons were reduced to zero in all models (consistent with Fig. 3). During weak thalamus photoinhibition, selectivity was reduced to zero without large changes in mean spike rate in both non-linear models (d, e) (consistent with Fig. 5), but not in a linear model (c). See Supplementary information for details.
Extended Data Figure 8. Modulation of thalamic activity by ALM photoinhibition is localized.

a. Schematic of VM/VAL recording during ALM photoinhibition.
b. Peri-stimulus time histogram of thalamic neurons averaged during control (black) and photoinhibition (light blue) conditions. Neurons were grouped based on their distance to the center of VM/VAL. Distance < 0.5 mm, n = 250; 0.5 ≤ distance < 1.0 mm, n = 160; distance ≥ 1.0 mm, n = 46. Averaging window 100 ms. Thalamic activity was inhibited mainly in VM/VAL.
c. Locations of recorded neurons in thalamus. All recorded neurons were projected to the example coronal session. Neurons were color coded based on their firing rate during ALM photoinhibition normalized by the control firing rate without photoinhibition (the “first 100 ms” of photoinhibition, see Methods). Neurons near VM/VAL were more suppressed. Same data as Fig. 6d.
d. Panels d-g compare the effects of photoinhibitin on ALM vs. vM1 on VAL/VM activity. Labeling corticothalamic projections by injecting EGFP-expressing AAV into ALM in a Rbp4-cre_KL100 mouse (AP3.08, ML 1.5, DV 0.4 mm, injection volume 235 nl, Rbp4-cre line labels cells in layer 5 and 6. Data from mouse connectivity map of Allen Brain Atlas: id 263242463, http://connectivity.brain-map.org/)20. Extensive labeling is seen in VM/VAL (see also Extended Data Fig. 1 and 9).
e. Labeling corticothalamic projections by injecting EGFP-expressing AAV into vM1 in a Rbp4-cre_KL100 mouse (AP1, ML 0.75, DV 0.3 and 0.75 mm, injection volume 308 nl. Data from mouse connectivity map of Allen Brain Atlas: id 168162771, http://connectivity.brain-map.org/)20. The labeling in VM is much less extensive than in (d).
f. Schematic showing ALM photoinhibition. Peri-stimulus time histogram of VM/VAL neurons averaged during control (black) and ALM photoinhibition (light blue) conditions. Photoinhibition conditions were interleaved. SEM was estimated by bootstrapping over neurons (n = 46 cells from 3 mice.). SEM for photoinhibition conditions are not displayed for clarity. Averaging window 100 ms.
g. Schematic showing vM1 photoinhibition. Peri-stimulus time histogram of VM/VAL neurons averaged during control (black) and vM1 photoinhibition (light blue) conditions. Photoinhibition conditions were interleaved. Photoinhibiting vM1 produced less reduction of VM/VAL activity. SEM was estimated by bootstrapping over neurons (n = 46 cells from 3 mice). SEM for photoinhibition conditions are not displayed for clarity. Averaging window 100 ms.
h. Panels h-i show the absence of long range GABAergic projections from ALM in the thalamus. GABAergic neurons labeled with GFP in ALM. Left, adeno-associated virus (AAV2/1-CAG-felx-EGFP) was injected into ALM in a Gad2-IRES-Cre mouse. Middle: confocal images showing GABAergic neurons expressing EGFP. Same neurons as in the left panel. Right, magnified view of the boxed region in the middle panel, showing labeled axons of GABAergic neurons.
i. Absence of GABAergic axons in VM (ventral medial nucleus of the thalamus). Left, VM and the mammilothalamic tract (mtt). Middle, confocal image of the region in the left panel. Laser power was 10 times higher compared to (h). In addition, images were contrast enhanced, as reflected by the higher background fluorescence. Right, magnified view of the indicated region in the middle panel. No labeled axonal processes were detected in thalamus.
Extended Data Figure 9. Thalamic regions that are connected reciprocally with ALM (thalALM) receive input from multiple brain areas.

RetroBeads were injected into thalALM (AP -1.5, ML 0.85, DV -4.0 mm from Bregma, mainly in VM). Magenta, retrograde labeling; blue, Nissl staining.
a. Coronal sections. Dashed boxes indicate location of magnified images on right panels (b-g).
b. Labeling in ALM. Overall labeling was much stronger in ipsilateral ALM. Labeling in ALM was observed on both sides in L6, whereas labeling in L5 was seen only in ipsilateral ALM. L6 neurons are corticothalamic neurons, whereas the L5 neurons correspond to pyramidal tract neurons that send a branch to thalamus60. In addition to ALM, labeling was observed in M1, S2 and weakly in other cortical areas (see a).
c. Labeling in the ipsilateral thalamic reticular nucleus, TRN.
d. Labeling in the ipsilateral superior colliculus, SC.
e. Labeling in the ipsilateral substantia nigra pars reticulate (SNr), in three coronal sections. Labeling was observed throughout SNr from the caudal to the rostral end, consistent with a previous report54.
f. Labeling in the ipsilateral pedunculopontine nucleus (PPN).
g. Labeling in the contralateral deep cerebellar nuclei. FN, fastigial nucleus; IP, interposed nucleus; DN, dentate nucleus.
Extended Data Figure 10. Effect of ALM photoinhibition on SNr activity.

a. Schematic of SNr recording during ALM photoinhibition. Since the SNr → thalamus projection is inhibitory (red arrow), SNr could contribute to VM/VAL inhibition if ALM photoinhibition activates SNr. We used multi-shank silicon probes (spanning 600 μm, medial to lateral) to survey a large part of SNr (medial, lateral, rostral and caudal).
b. SNr population selectivity. Selectivity is the difference in spike rate between the preferred and non-preferred trial type, normalized to the peak selectivity. Only putative GABAergic neurons with significant trial selectivity are shown (n = 152/181, t-test, P < 0.05). The grey scale bar on the right indicates selectivity type: Neurons showing preparatory activity only (white); both preparatory activity and peri-movement activity (grey); peri-movement activity only (black). Averaging window, 200ms. SNr selectivity is similar to ALM and VM/VAL (Fig. 2).
c. Scatter plot of SNr GABAergic neurons (n = 181; spikes measured for 100 ms, starting 20 ms after photostimulus onset; Methods). Filled circles, neurons that were significantly modulated by ALM photoinhibition (P< 0.05, t-test). Photoinhibition of ALM changed only a relatively small fraction of SNr neurons (48/181 significantly inhibited; 23/181 significantly activated, P < 0.05, t-test,). Moreover, neurons that decreased their activity were more numerous than neurons that increased their activity (bootstrapping over neurons, P < 0.01, Methods). Overall, inhibiting ALM reduced SNr activity by 3.6 spikes per second (8.3% of control activity measured for 100 ms, starting 20 ms after photostimulus onset). This reduction of neural activity in SNr is expected to increase thalALM activity.
d. The time course of SNr GABAergic neurons during ALM photoinhibition. Left, significantly inhibited neurons (n = 48). Right, significantly excited neurons (n = 23). SEM was estimated by bootstrapping over neurons. Top, averaging window 100 ms. Bottom, bin size 1 ms. These data indicate that ALM to SNr pathways do not contribute to the early phase of VM/VAL inhibition after ALM photoinhibition. SNr neurons were affected by ALM photoinhibition with a relatively long latency difference (15.2 ± 4.6 ms, mean ± SEM, P < 0.05, t-test), longer than for reducing thalALM activity (10.9 ± 2.9 ms; Fig. 6e).
Supplementary Material
Acknowledgments
We thank Nuo Li, Jianing Yu, Jesse Goldberg, Xiao-Jing Wang, Adam Hantman, James Phillips, Gordon Shepherd, Xiao-Jing Wang and Naoki Yamawaki for comments on the manuscript, Luciana Walendy, Tina Pluntke and Miho Inagaki for animal training, Tim Harris, Brian Barbarits, Jun Jaeyoon James and Wei-Lung Sun for help with silicon probe recordings and spike sorting, Michael Economo for help with image processing. Amy Hu for help with histology. This work was funded by Howard Hughes Medical Institute. H.K.I and K.D. are Helen Hay Whitney Foundation postdoctoral fellows. K.D. is supported by the Simons Collaboration on the Global Brain.
Footnotes
Author Contributions: Z.V.G., H.K.I. and K.S. conceived the project. Z.V.G. and H.K.I. performed extracellular electrophysiology and optogenetic experiments. H.K.I. performed whole cell recordings. Z.V.G., H.K.I. and C.R.G. performed anatomical experiments. K.D. and S.D. performed network modeling. Z.V.G., H.K.I., K.S. analyzed data. Z.V.G., H.K.I. and K.S. wrote the paper, with input from all the authors.
Author Information: The authors declare no competing interests.
References
- 1.Tanji J, Evarts EV. Anticipatory activity of motor cortex neurons in relation to direction of an intended movement. J Neurophysiol. 1976;39:1062–1068. doi: 10.1152/jn.1976.39.5.1062. [DOI] [PubMed] [Google Scholar]
- 2.Churchland MM, Cunningham JP, Kaufman MT, Ryu SI, Shenoy KV. Cortical preparatory activity: representation of movement or first cog in a dynamical machine? Neuron. 2010;68:387–400. doi: 10.1016/j.neuron.2010.09.015. [DOI] [PMC free article] [PubMed] [Google Scholar]
- 3.Guo ZV, et al. Flow of cortical activity underlying a tactile decision in mice. Neuron. 2014;81:179–194. doi: 10.1016/j.neuron.2013.10.020. [DOI] [PMC free article] [PubMed] [Google Scholar]
- 4.Erlich JC, Bialek M, Brody CD. A cortical substrate for memory-guided orienting in the rat. Neuron. 2011;72:330–343. doi: 10.1016/j.neuron.2011.07.010. [DOI] [PMC free article] [PubMed] [Google Scholar]
- 5.Murakami M, Vicente MI, Costa GM, Mainen ZF. Neural antecedents of self-initiated actions in secondary motor cortex. Nature neuroscience. 2014;17:1574–1582. doi: 10.1038/nn.3826. [DOI] [PubMed] [Google Scholar]
- 6.Fuster JM, Alexander GE. Neuron activity related to short-term memory. Science. 1971;173:652–654. doi: 10.1126/science.173.3997.652. [DOI] [PubMed] [Google Scholar]
- 7.Funahashi S, Bruce CJ, Goldman-Rakic PS. Mnemonic coding of visual space in the monkey's dorsolateral prefrontal cortex. Journal of neurophysiology. 1989;61:331–349. doi: 10.1152/jn.1989.61.2.331. [DOI] [PubMed] [Google Scholar]
- 8.Romo R, Brody CD, Hernandez A, Lemus L. Neuronal correlates of parametric working memory in the prefrontal cortex. Nature. 1999;399:470–473. doi: 10.1038/20939. [DOI] [PubMed] [Google Scholar]
- 9.Liu D, et al. Medial prefrontal activity during delay period contributes to learning of a working memory task. Science. 2014;346:458–463. doi: 10.1126/science.1256573. [DOI] [PubMed] [Google Scholar]
- 10.Wang XJ. Decision making in recurrent neuronal circuits. Neuron. 2008;60:215–234. doi: 10.1016/j.neuron.2008.09.034. [DOI] [PMC free article] [PubMed] [Google Scholar]
- 11.Maimon G, Assad JA. A cognitive signal for the proactive timing of action in macaque LIP. Nat Neurosci. 2006;9:948–955. doi: 10.1038/nn1716. [DOI] [PubMed] [Google Scholar]
- 12.Goldman-Rakic PS. Cellular basis of working memory. Neuron. 1995;14:477–485. doi: 10.1016/0896-6273(95)90304-6. [DOI] [PubMed] [Google Scholar]
- 13.Wang XJ. Synaptic reverberation underlying mnemonic persistent activity. Trends Neurosci. 2001;24:455–463. doi: 10.1016/s0166-2236(00)01868-3. [DOI] [PubMed] [Google Scholar]
- 14.Zingg B, et al. Neural networks of the mouse neocortex. Cell. 2014;156:1096–1111. doi: 10.1016/j.cell.2014.02.023. [DOI] [PMC free article] [PubMed] [Google Scholar]
- 15.Crutcher MD, Alexander GE. Movement-related neuronal activity selectively coding either direction or muscle pattern in three motor areas of the monkey. Journal of neurophysiology. 1990;64:151–163. doi: 10.1152/jn.1990.64.1.151. [DOI] [PubMed] [Google Scholar]
- 16.Gnadt JW, Andersen RA. Memory related motor planning activity in posterior parietal cortex of macaque. Exp Brain Res. 1988;70:216–220. doi: 10.1007/BF00271862. [DOI] [PubMed] [Google Scholar]
- 17.Bruce CJ, Goldberg ME. Primate frontal eye fields. I. Single neurons discharging before saccades. Journal of neurophysiology. 1985;53:603–635. doi: 10.1152/jn.1985.53.3.603. [DOI] [PubMed] [Google Scholar]
- 18.Hernandez A, et al. Decoding a perceptual decision process across cortex. Neuron. 2010;66:300–314. doi: 10.1016/j.neuron.2010.03.031. [DOI] [PubMed] [Google Scholar]
- 19.Herkenham M. The afferent and efferent connections of the ventromedial thalamic nucleus in the rat. J Comp Neurol. 1979;183:487–517. doi: 10.1002/cne.901830304. [DOI] [PubMed] [Google Scholar]
- 20.Oh SW, et al. A mesoscale connectome of the mouse brain. Nature. 2014;508:207–214. doi: 10.1038/nature13186. [DOI] [PMC free article] [PubMed] [Google Scholar]
- 21.Hunnicutt BJ, et al. A comprehensive thalamocortical projection map at the mesoscopic level. Nat Neurosci. 2014;17:1276–1285. doi: 10.1038/nn.3780. [DOI] [PMC free article] [PubMed] [Google Scholar]
- 22.Kuramoto E, et al. Ventral Medial Nucleus Neurons Send Thalamocortical Afferents More Widely and More Preferentially to Layer 1 than Neurons of the Ventral Anterior-Ventral Lateral Nuclear Complex in the Rat. Cereb Cortex. 2013 doi: 10.1093/cercor/bht216. [DOI] [PubMed] [Google Scholar]
- 23.Tanaka M. Cognitive signals in the primate motor thalamus predict saccade timing. J Neurosci. 2007;27:12109–12118. doi: 10.1523/JNEUROSCI.1873-07.2007. [DOI] [PMC free article] [PubMed] [Google Scholar]
- 24.Li N, Daie K, Svoboda K, Druckmann S. Robust neuronal dynamics in premotor cortex during motor planning. Nature. 2016 doi: 10.1038/nature17643. [DOI] [PMC free article] [PubMed] [Google Scholar]
- 25.Shibasaki H, Hallett M. What is the Bereitschaftspotential? Clinical neurophysiology : official journal of the International Federation of Clinical Neurophysiology. 2006;117:2341–2356. doi: 10.1016/j.clinph.2006.04.025. [DOI] [PubMed] [Google Scholar]
- 26.Fried I, Mukamel R, Kreiman G. Internally generated preactivation of single neurons in human medial frontal cortex predicts volition. Neuron. 2011;69:548–562. doi: 10.1016/j.neuron.2010.11.045. [DOI] [PMC free article] [PubMed] [Google Scholar]
- 27.Li N, Chen TW, Guo ZV, Gerfen CR, Svoboda K. A motor cortex circuit for motor planning and movement. Nature. 2015;519:51–56. doi: 10.1038/nature14178. [DOI] [PubMed] [Google Scholar]
- 28.Guo ZV, et al. Procedures for behavioral experiments in head-fixed mice. PloS one. 2014;9:e88678. doi: 10.1371/journal.pone.0088678. [DOI] [PMC free article] [PubMed] [Google Scholar]
- 29.Reinhold K, Lien AD, Scanziani M. Distinct recurrent versus afferent dynamics in cortical visual processing. Nat Neurosci. 2015;18:1789–1797. doi: 10.1038/nn.4153. [DOI] [PubMed] [Google Scholar]
- 30.Wimmer RD, et al. Thalamic control of sensory selection in divided attention. Nature. 2015;526:705–709. doi: 10.1038/nature15398. [DOI] [PMC free article] [PubMed] [Google Scholar]
- 31.Krupa DJ, Ghazanfar AA, Nicolelis MA. Immediate thalamic sensory plasticity depends on corticothalamic feedback. Proc Natl Acad Sci U S A. 1999;96:8200–8205. doi: 10.1073/pnas.96.14.8200. [DOI] [PMC free article] [PubMed] [Google Scholar]
- 32.Zhao S, et al. Cell type-specific channelrhodopsin-2 transgenic mice for optogenetic dissection of neural circuitry function. Nature methods. 2011;8:745–752. doi: 10.1038/nmeth.1668. [DOI] [PMC free article] [PubMed] [Google Scholar]
- 33.Yu J, Gutnisky DA, Hires SA, Svoboda K. Layer 4 fast-spiking interneurons filter thalamocortical signals during active somatosensation. Nat Neurosci. 2016 doi: 10.1038/nn.4412. [DOI] [PubMed] [Google Scholar]
- 34.Yin HH, Knowlton BJ. The role of the basal ganglia in habit formation. Nat Rev Neurosci. 2006;7:464–476. doi: 10.1038/nrn1919. [DOI] [PubMed] [Google Scholar]
- 35.Mante V, Sussillo D, Shenoy KV, Newsome WT. Context-dependent computation by recurrent dynamics in prefrontal cortex. Nature. 2013;503:78–84. doi: 10.1038/nature12742. [DOI] [PMC free article] [PubMed] [Google Scholar]
- 36.Goldberg JH, Fee MS. A cortical motor nucleus drives the basal ganglia-recipient thalamus in singing birds. Nat Neurosci. 2012;15:620–627. doi: 10.1038/nn.3047. [DOI] [PMC free article] [PubMed] [Google Scholar]
- 37.Goldberg JH, Farries MA, Fee MS. Basal ganglia output to the thalamus: still a paradox. Trends Neurosci. 2013;36:695–705. doi: 10.1016/j.tins.2013.09.001. [DOI] [PMC free article] [PubMed] [Google Scholar]
- 38.Sherman SM, Guillery RW. Functional connections of cortical areas : a new view from the thalamus. The MIT Press; 2013. [Google Scholar]
- 39.Duan CA, Erlich JC, Brody CD. Requirement of Prefrontal and Midbrain Regions for Rapid Executive Control of Behavior in the Rat. Neuron. 2015;86:1491–1503. doi: 10.1016/j.neuron.2015.05.042. [DOI] [PubMed] [Google Scholar]
- 40.Van der Werf YD, Witter MP, Groenewegen HJ. The intralaminar and midline nuclei of the thalamus. Anatomical and functional evidence for participation in processes of arousal and awareness. Brain Res Brain Res Rev. 2002;39:107–140. doi: 10.1016/s0165-0173(02)00181-9. [DOI] [PubMed] [Google Scholar]
- 41.Saalmann YB. Intralaminar and medial thalamic influence on cortical synchrony, information transmission and cognition. Front Syst Neurosci. 2014;8:83. doi: 10.3389/fnsys.2014.00083. [DOI] [PMC free article] [PubMed] [Google Scholar]
- 42.Giber K, et al. A subcortical inhibitory signal for behavioral arrest in the thalamus. Nat Neurosci. 2015;18:562–568. doi: 10.1038/nn.3951. [DOI] [PMC free article] [PubMed] [Google Scholar]
- 43.Isseroff A, Rosvold HE, Galkin TW, Goldman-Rakic PS. Spatial memory impairments following damage to the mediodorsal nucleus of the thalamus in rhesus monkeys. Brain Res. 1982;232:97–113. doi: 10.1016/0006-8993(82)90613-8. [DOI] [PubMed] [Google Scholar]
- 44.Parnaudeau S, et al. Inhibition of mediodorsal thalamus disrupts thalamofrontal connectivity and cognition. Neuron. 2013;77:1151–1162. doi: 10.1016/j.neuron.2013.01.038. [DOI] [PMC free article] [PubMed] [Google Scholar]
- 45.Hippenmeyer S, et al. A developmental switch in the response of DRG neurons to ETS transcription factor signaling. PLoS Biol. 2005;3:e159. doi: 10.1371/journal.pbio.0030159. [DOI] [PMC free article] [PubMed] [Google Scholar]
- 46.Madisen L, et al. A toolbox of Cre-dependent optogenetic transgenic mice for light-induced activation and silencing. Nature neuroscience. 2012;15:793–802. doi: 10.1038/nn.3078. [DOI] [PMC free article] [PubMed] [Google Scholar]
- 47.Vue TY, et al. Sonic hedgehog signaling controls thalamic progenitor identity and nuclei specification in mice. J Neurosci. 2009;29:4484–4497. doi: 10.1523/JNEUROSCI.0656-09.2009. [DOI] [PMC free article] [PubMed] [Google Scholar]
- 48.Petreanu L, Mao T, Sternson SM, Svoboda K. The subcellular organization of neocortical excitatory connections. Nature. 2009;457:1142–1145. doi: 10.1038/nature07709. [DOI] [PMC free article] [PubMed] [Google Scholar]
- 49.Viswanathan S, et al. High-performance probes for light and electron microscopy. Nat Methods. 2015 doi: 10.1038/nmeth.3365. [DOI] [PMC free article] [PubMed] [Google Scholar]
- 50.Tsuriel S, Gudes S, Draft RW, Binshtok AM, Lichtman JW. Multispectral labeling technique to map many neighboring axonal projections in the same tissue. Nat Methods. 2015;12:547–552. doi: 10.1038/nmeth.3367. [DOI] [PubMed] [Google Scholar]
- 51.Gerfen CR, Paletzki R, Heintz N. GENSAT BAC cre-recombinase driver lines to study the functional organization of cerebral cortical and basal ganglia circuits. Neuron. 2013;80:1368–1383. doi: 10.1016/j.neuron.2013.10.016. [DOI] [PMC free article] [PubMed] [Google Scholar]
- 52.Wan Y, Otsuna H, Chien CB, Hansen C. An Interactive Visualization Tool for Multi-channel Confocal Microscopy Data in Neurobiology Research. Ieee T Vis Comput Gr. 2009;15:1489–1496. doi: 10.1109/TVCG.2009.118. [DOI] [PMC free article] [PubMed] [Google Scholar]
- 53.Di Chiara G, Morelli M, Porceddu ML, Gessa GL. Role of thalamic gamma-aminobutyrate in motor functions: catalepsy and ipsiversive turning after intrathalamic muscimol. Neuroscience. 1979;4:1453–1465. doi: 10.1016/0306-4522(79)90050-2. [DOI] [PubMed] [Google Scholar]
- 54.Gulcebi MI, et al. Topographical connections of the substantia nigra pars reticulata to higher-order thalamic nuclei in the rat. Brain Res Bull. 2012;87:312–318. doi: 10.1016/j.brainresbull.2011.11.005. [DOI] [PubMed] [Google Scholar]
- 55.Margrie TW, Brecht M, Sakmann B. In vivo, low-resistance, whole-cell recordings from neurons in the anaesthetized and awake mammalian brain. Pflugers Arch. 2002;444:491–498. doi: 10.1007/s00424-002-0831-z. [DOI] [PubMed] [Google Scholar]
- 56.Bartho P, et al. Ongoing network state controls the length of sleep spindles via inhibitory activity. Neuron. 2014;82:1367–1379. doi: 10.1016/j.neuron.2014.04.046. [DOI] [PMC free article] [PubMed] [Google Scholar]
- 57.Rossi MA, Fan D, Barter JW, Yin HH. Bidirectional modulation of substantia nigra activity by motivational state. PLoS One. 2013;8:e71598. doi: 10.1371/journal.pone.0071598. [DOI] [PMC free article] [PubMed] [Google Scholar]
- 58.Teeters JL, et al. Neurodata Without Borders: Creating a Common Data Format for Neurophysiology. Neuron. 2015;88:629–634. doi: 10.1016/j.neuron.2015.10.025. [DOI] [PubMed] [Google Scholar]
- 59.Chen J, Kriegstein ARA. GABAergic projection from the zona incerta to cortex promotes cortical neuron development. Science. 2015;350:554–558. doi: 10.1126/science.aac6472. [DOI] [PMC free article] [PubMed] [Google Scholar]
- 60.Shepherd GM. Corticostriatal connectivity and its role in disease. Nat Rev Neurosci. 2013;14:278–291. doi: 10.1038/nrn3469. [DOI] [PMC free article] [PubMed] [Google Scholar]
Associated Data
This section collects any data citations, data availability statements, or supplementary materials included in this article.