

Abstract
Background & Aims:
Hepatocellular carcinoma (HCC) screening of patients with cirrhosis is recommended by professional societies to increase detection of early-stage tumors and survival but is underused in clinical practice.
Methods:
We conducted a retrospective cohort study of 13,714 patients diagnosed with HCC from 2003 through 2013 included in the Surveillance, Epidemiology, and End Results Program-Medicare database. We characterized receipt of HCC screening in the 3 years before HCC diagnosis using mutually exclusive categories (consistent vs inconsistent vs no screening) and proportion of time covered with screening. Correlates for screening receipt were assessed using a multivariable 2-part regression model. We examined the association between screening receipt and early detection of tumors using multivariable logistic regression. We evaluated associations between screening receipt and overall survival using a Cox proportional hazards model, after adjustments for effects of lead-time bias and length-time bias on survival rate estimators.
Results:
Most patients with cirrhosis (51.1%) did not receive any screening in the 3 years before a diagnosis of HCC, and only 6.8% of patients underwent consistent annual screening. The proportion with consistent screening increased from 5.4% in 2003–2006 to 8.8% in 2011–2013 ( P<.001). The mean proportion of time covered was 13.4% overall, which increased from 11.7% in 2003–2006 to 15.2% in 2011–2013. Receipt of consistent screening was associated with detection of early-stage tumors (odds ratio, 1.98; 95% CI, 1.68–2.33) and reduced risk of death after correction for lead time bias (hazard ratio, 0.76; 95% CI, 0.70–0.83). Inconsiste nt screening was associated with a slightly smaller increase in early detection of HCC (odds ratio, 1.31; 95% CI, 1.20–1.43) and reduced risk of death (hazard ratio, 0.86; 95% CI, 0.83–0.90). After correction for lead- and length-time biases, higher proportions of patients with consistent (23%; 95% CI, 21%–25%) and inconsistent screening (19%; 95% C I, 19%–20%) survived for 3 years compared to patients without screening (13%; 95% CI, 12%–14%).
Conclusion:
In an analysis of the Surveillance, Epidemiology, and End Results Program-Medicare database, we found HCC screening to be underused for patients with cirrhosis. This contributes to detection of liver tumors at later stages and shorter times of survival. However, the proportion of patients screened for HCC has increased over time.
Keywords: SEER database analysis, screening, liver cancer, ultrasound
INTRODUCTION
Liver cancer (HCC) is the 2nd leading cause of cancer-related death worldwide.1 Hepatocellular carcinoma (HCC), the most common type of primary liver cancer, is the leading cause of death among patients with cirrhosis.2 Although HCC is the 6th leading cause of cancer-related death in the U.S., its incidence has tripled over the last 30 years.3–6
HCC prognosis depends on tumor stage at the time of diagnosis, with curative treatment options only available for patients diagnosed at an early stage. Patients with early stage HCC can achieve 5-year survival rates of 70% if they undergo surgical resection or liver transplantation, compared to a median survival of 1 year for patients with advanced HCC.7 Given data from a large randomized controlled trial (RCT) and several cohort studies demonstrating a potential survival benefit associated with early tumor detection, professional society guidelines from the American Association for the Study of Liver Diseases (AASLD) and National Comprehensive Cancer Network (NCCN) recommend HCC screening in high-risk patients, including those with cirrhosis.8,9 The potential benefit of HCC screening has recently come into question, with a case-control study from the National Veterans Affairs health system showing no association between screening receipt and HCC-related mortality, highlighting the need for further studies in large populations.10
HCC screening is a complex, multifaceted process that poses many unique challenges. Prior studies suggest less than 20% of patients with cirrhosis receive HCC screening.11,12 Therefore, many patients with HCC are diagnosed at an advanced stage, when they are no longer eligible for curative treatment. However, most studies were conducted at single centers and prior multi-center studies were published several years ago, which may no longer reflect current practice. Our study’s aim was to characterize utilization of HCC screening receipt and its association with early tumor detection and improved survival in a nationally representative cohort of patients in the United States.
METHODS
Data Source
We conducted a retrospective cohort study using the Surveillance, Epidemiology and End Results (SEER)-Medicare data linked to the American Medical Association (AMA) Master File. Linked SEER-Medicare data combines clinical, demographic and survival information for persons with cancer from the SEER program of cancer registries with Medicare claims information on covered health services from time of Medicare eligibility until death. The SEER program collects data on incident cancer cases from 20 cancer registries, including state, central, metropolitan, and the Alaska Native registries.13–15 These areas account for approximately 28% of the population in the United States.13,16 Medicare is the primary health insurer for approximately 97% of individuals ages 65 years and older and roughly 95% of Medicare beneficiaries are covered by both Part A (inpatient hospitalizations) and Part B (outpatient visits and physician office visits/services) benefits.17 The American Medical Association (AMA) Master File includes current and historical data for more than 1.4 million physicians, residents and medical students in the United States, Puerto Rico, Virgin Islands and certain Pacific Islands. Data includes information about education, training and professional certification and credentialing.18,19
Study Population
We included all Medicare beneficiaries, aged 65 years and older, who have been diagnosed with HCC (ICD-O 8170) from the years of 2003 to 2013.20 Only patients with diagnostically confirmed HCC (positive histology, cytology, laboratory test, positive radiology tests) were eligible for inclusion. We excluded patients with Medicare Part A and B enrollment less than 3 years prior to HCC diagnosis. We also excluded patients enrolled in Medicare health maintenance organizations (HMOs) because Medicare HMO plans were not required to submit individual claims information for services to the Centers for Medicare and Medicaid Services (CMS).21 Although a majority of people were covered by traditional Medicare, approximately 13% of people were enrolled in a Medicare Advantage plan in 2003 and this increased to 28% in 2013.21 Missing patient and tumor characteristics were imputed using similar variables if available; otherwise patients with missing characteristics that could not be imputed were excluded from the sample.15,17
We defined a subset of patients with known cirrhosis (n=2,972) based on ICD-9 codes (571.2, 571.5, or 571.6) from Medicare claims.17,22 Patients with evidence of ascites or hepatic encephalopathy were included in the known cirrhosis sample even in the absence of other ICD-9 codes for cirrhosis (n=405). The first claim for ascites or hepatic encephalopathy was used as a proxy date for the diagnosis of cirrhosis. For provider analyses, we excluded patients who exclusively saw emergency medicine providers or only saw providers one month prior to HCC diagnosis. Providers with no information regarding specialty, practice arrangement, or medical school graduation date were also excluded if missing characteristics could not be imputed.
HCC Screening Definition
The primary outcome of HCC screening receipt during the 3-year period prior to HCC diagnosis was defined using two measures. We first used three mutually exclusive categories: 1) consistent screening 2) inconsistent screening and 3) no screening. Consistent screening was defined as having ≥1 abdominal ultrasound per calendar year, and inconsistent screening was defined as having ≥1 abdominal ultrasound during the study period, but less than annually. Our second measure was proportion of time covered with screening (PTC). PTC was defined as the proportion of the 36-month study period in which patients had received screening, with each abdominal ultrasound providing 7 months of screening coverage. For both measures, receipt of an abdominal ultrasound was identified using the CPT codes 76700 and 76705. In a sensitivity analysis, we characterized receipt of ultrasounds performed with screening intent, as determined by a validated algorithm.17,23
Patient and Provider Characteristics
We collected information on age at HCC diagnosis, sex, race/ethnicity, metropolitan area based on Rural/Urban Continuum Codes (RUCC), census poverty level (as a proxy for socioeconomic status), and year of HCC diagnosis. Tumor characteristics from the SEER Patient Entitlement and Diagnosis Summary File (PEDSF)24,25 were used to construct the Milan Criteria, i.e. a single tumor <5cm or 2 to 3 tumors all <3cm with no evidence of extrahepatic involvement or metastasis.24,25 Liver disease etiology, per Medicare claims ICD-9 codes, was categorized as hepatitis B virus (HBV), hepatitis C virus (HCV), alcoholic liver disease, or other. To determine degree of liver dysfunction, we collected Medicare claims information for ascites (ICD-9 codes 789.51 or 789.59) or hepatic encephalopathy (ICD-9 code 572.2) at least 6 months prior to HCC diagnosis as well as pharmacy claims for spironolactone or furosemide (for presence of ascites) and lactulose or rifaximin (for hepatic encephalopathy). We used diagnosis and procedure codes one year prior to HCC diagnosis to calculate the National Cancer Institute (NCI) Comorbidity Index as a measure of non-cancer comorbidity.26,27
Provider-level characteristics were aggregated to the patient-level. For each patient, we determined whether they visited each type of clinic provider (gastroenterology/hepatology, internal medicine/family practice, or other) during the 3-year screening period. We defined the principal provider as the one with the highest total reimbursement by each patient during the study period. If there was a tie in highest total amount of reimbursements or this information was not available, then the most commonly visited provider was used. For the principal provider, we collected information on practice arrangement, year of graduation and U.S. training status.17 Practice arrangement was categorized as solo practice, group practice, hospital-based, university-based, or other.
Statistical Analysis
We first characterized receipt of HCC screening and predictors for screening receipt. We used a multivariable 2-part regression model to identify patient and provider predictors of screening receipt, where the outcome variable was defined as PTC. For the 2-part model, the first part uses logistic regression to predict the probability of any HCC screening (PTC>0), while the second part uses a conditional ordinary least squares (OLS) regression to predict the level of PTC among patients with any screening.
Likelihood ratio tests were used to determine goodness-of-fit on both of the full models for our primary sample where all explanatory variables were included against the reduced model. This model was obtained by omitting variables that were non-significant at the 5% level in the full model and re-estimating the remaining coefficients. We used Akaike Information Criterion (AIC) to determine best fit and identified the preferred model, which had the lowest AIC among the reduced models for all regression analyses. Multicollinearity was also tested between pairs of coefficients to identify any collinearity issues using variance inflation factor (VIF) scores.
We next evaluated the association between HCC screening receipt and clinical outcomes including a) early tumor detection (defined as within Milan Criteria) using simple and multivariable logistic regression, and b) overall survival using the Cox proportional hazards model, respectively. For these analyses, the categorical measure of HCC screening receipt (consistent screening vs. inconsistent screening vs. no screening) was used. We used Kaplan-Meier survival curves to calculate time-to-death after HCC diagnosis. Follow up was recorded on date of death or censored at end of the study period (December 31st, 2014). Crude and adjusted hazard ratios (HR) with 95% confidence intervals (95% CI) were estimated.
Lead and length time biases were corrected using the method proposed by Duffy and colleagues.28,29 Lead time is the time between early detection by screening and when cancer would otherwise present symptomatically, which can lead to perceived survival benefit even if the disease course was not changed. Length-biased time relates to slow-growing tumors, which are less likely to be fatal, also have a longer asymptomatic period and therefore being more likely to be screen-detected. Statistical correction for lead time bias is based on sojourn time, the period during which HCC is asymptomatic but screen-detectable (Supplemental Material). We identified screen-detected patients by those who received screening imaging with intent 23 within 6 months prior to HCC diagnosis. We assumed an exponential distribution for the sojourn time with a mean of 6 months for our base case analysis, based on prior studies;30–32 however, we also performed sensitivity analyses with the mean sojourn times of 3 and 9 months.
Length time bias is adjusted based on the proportion of patients with slow-growing tumors and the relative risk of death from slow-growing tumors versus aggressive tumors (Supplemental Material). We assumed that 20% of HCC are slow-growing for our base case analysis, and we performed sensitivity analyses with proportions of 10% and 30%. For this range of values, plausible values for the relative risk of death from slow-growing tumors versus aggressive tumors were 0.8 and 0.9. We used 0.9 as our base case, and 0.8 as a sensitivity analysis. Thus, in total we tested 6 scenarios for length time bias adjustment.
All variables in our analyses were entered sequentially using forward selection. Our criterion for entry was at the 0.05 level and remaining variables that did not meet criteria were removed. Analyses were conducted using STATA 14.0 (StataCorp, College Station, TX, USA) and SAS 9.4 (SAS Institute Inc., Cary, NC). The study protocol was approved by the Institutional Review Board of Texas A&M University. All authors had access to the study data and had reviewed and approved the final version of the manuscript.
RESULTS
Patient Characteristics
Between January 2003 and December 2013, 13,714 patients were diagnosed with HCC. The number of patients diagnosed with HCC increased over time, from 868 patients in 2003 to 1,531 patients in 2013. Patient characteristics are described in Table 1. The mean age of patients at HCC diagnosis was 73 years, and approximately 67% were men. The population was predominantly white, followed by Hispanics, blacks, and Asians. A majority of patients in our sample resided in metropolitan areas and nearly one-third of the population were living 10% to 19% below the poverty level. The most common etiology of liver disease was chronic hepatitis C (HCV) infection. Approximately 22% of patients were diagnosed with cirrhosis prior to the study period and 21% were diagnosed with cirrhosis during the study period; however, more than half of patients did not have cirrhosis or had unrecognized cirrhosis at the time of HCC presentation. Few patients had hepatic decompensation, with only 12% having ascites and 10% hepatic encephalopathy.
Table 1.
Baseline characteristics of HCC patients (n=13,714)
| Variable | Consistent screening* (n=937) | Inconsistent screening** (n=5,768) | No screening (n=7,009) | P-value |
|---|---|---|---|---|
| Age at HCC diagnosis | 69.8 (9.8) | 71.7 (9.9) | 74.5 (9.2) | <.001 |
| Sex (% male) | 583 (62.2) | 3,786 (65.6) | 4,815 (68.7) | <.001 |
| Race/ethnicity | <.001 | |||
| Non-Hispanic White | 436 (46.5) | 3,390 (58.8) | 4,624 (66.0) | |
| Black | 83 (8.9) | 624 (10.8) | 713 (10.2) | |
| Hispanic | 168 (17.9) | 864 (15.0) | 773 (11.0) | |
| Asian | 177 (19.0) | 584 (10.1) | 515 (7.4) | |
| Other | 73 (7.8) | 306 (5.3) | 384 (5.5) | |
| Metropolitan area (%) | 884 (94.3) | 5,360 (92.9) | 6,419 (91.6) | .001 |
| Census poverty level | .002 | |||
| 0% to <5% | 168 (17.9) | 1,095 (19.0) | 1,406 (20.1) | |
| 5% to 9% | 204 (21.8) | 1,392 (24.1) | 1,683 (24.0) | |
| 10% to 19% | 315 (33.6) | 1,739 (30.2) | 2,240 (32.0) | |
| 20% to 100% | 250 (26.7) | 1,542 (26.7) | 1,680 (24.0) | |
| Year of HCC diagnosis | <.001 | |||
| 2003 | 47 (5.0) | 358 (6.2) | 463 (6.6) | |
| 2004 | 50 (5.3) | 367 (6.4) | 492 (7.0) | |
| 2005 | 47 (5.0) | 435 (7.5) | 495 (7.1) | |
| 2006 | 62 (6.6) | 452 (7.8) | 558 (8.0) | |
| 2007 | 80 (8.5) | 504 (8.7) | 607 (8.7) | |
| 2008 | 66 (7.0) | 562 (9.7) | 706 (10.1) | |
| 2009 | 71 (7.6) | 607 (10.5) | 706 (10.1) | |
| 2010 | 113 (12.1) | 578 (10.1) | 711 (10.1) | |
| 2011 | 107 (11.4) | 612 (10.6) | 714 (10.2) | |
| 2012 | 122 (13.0) | 690 (12.0) | 801 (11.4) | |
| 2013 | 172 (18.4) | 603 (10.5) | 756 (10.8) | |
| Cirrhosis duration | <.001 | |||
| No prior diagnosis | 117 (12.5) | 2,368 (41.1) | 5,391 (76.9) | |
| < 3 years prior to HCC | 270 (28.8) | 1,820 (31.6) | 776 (11.1) | |
| > 3 years prior to HCC | 550 (58.7) | 1,580 (27.4) | 842 (12.0) | |
| Liver disease etiology | <.001 | |||
| Hepatitis B | 37 (4.0) | 163 (2.8) | 124 (1.8) | |
| Hepatitis C | 132 (14.1) | 918 (15.9) | 848 (12.1) | |
| Alcohol-related | 21 (2.2) | 249 (4.3) | 218 (3.1) | |
| Other liver disease | 69 (7.4) | 565 (9.8) | 418 (6.0) | |
| >1 liver disease | 637 (68.0) | 2,061 (35.7) | 668 (9.5) | |
| No known liver disease | 41 (4.4) | 1,812 (31.4) | 4,733 (67.5) | |
| Milan criteria (% yes) | 596 (63.6) | 2,443 (42.4) | 1,772 (25.3) | <.001 |
| Ascites (%) | 270 (28.8) | 1,011 (17.5) | 328 (4.7) | <.001 |
| Hepatic encephalopathy (%) | 287 (30.6) | 796 (13.8) | 235 (3.4) | <.001 |
| NCI comorbidity index | <.001 | |||
| None | 5 (.53) | 186 (3.2) | 763 (10.9) | |
| Low (1–2) | 85 (9.1) | 975 (16.9) | 2,100 (30.0) | |
| Moderate (3–4) | 188 (20.1) | 1,476 (25.6) | 1,891 (27.0) | |
| High (5+) | 659 (70.3) | 3,131 (54.3) | 2,255 (32.2) |
Receipt of ≥1 abdominal ultrasound per calendar year
Receipt of ≥1 abdominal ultrasound during study period but less than annually
Characteristics of providers are found in Supplemental Table 1. Over 40% of patients saw only internal medicine/family practice providers prior to diagnosis, with only 14% having previously visited a gastroenterologist or hepatologist. Over three-quarters of principal providers were in a group or solo practice, with less than 10% being in a hospital- or university-based setting.
Receipt of HCC Screening
Most (51.1%) patients did not receive any screening in the 3 years prior to HCC diagnosis, while 42.1% underwent inconsistent screening, and only 6.8% underwent consistent screening. After accounting for ultrasound screening intent, only 16.4% of patients underwent inconsistent screening, and 2.0% received consistent screening.23 Screening receipt was higher in the subset of patients with known cirrhosis, with 53.2% and 18.5% receiving inconsistent and consistent screening, respectively.
The proportion of patients receiving consistent screening steadily increased over time from 5.4% for patients diagnosed between 2003 and 2006 to 6.2% between 2007 and 2010, and 8.8% between 2011 and 2013. During this time period from 2003–2006 to 2011–2013, the number of patients with no screening decreased from 52.5% to 49.6%. Similarly, consistent screening increased from 16.4% to 21.2% over this time period in the subset of patients with known cirrhosis (Figure 1).
Figure 1.
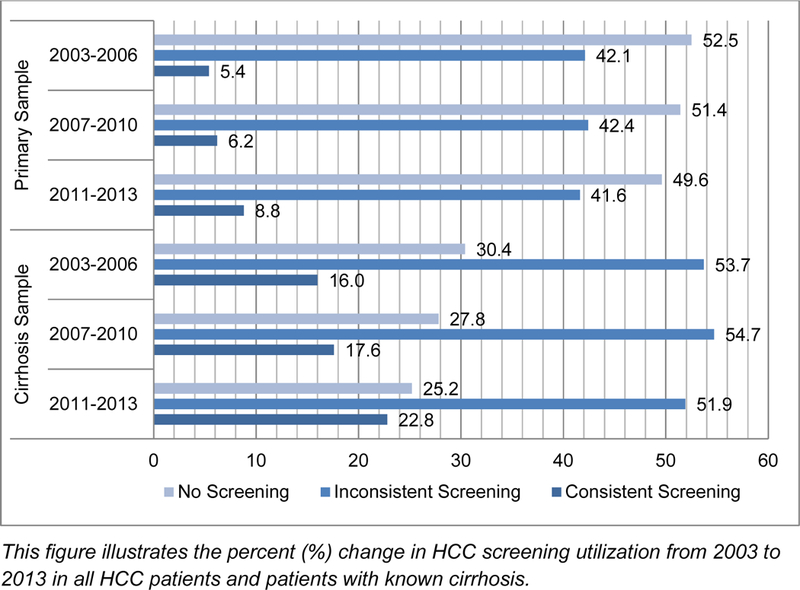
Percent (%) change in HCC screening receipt over time (n=13,714)
The mean PTC was 13.4% (SE=0.18%) for all patients and 27.6% (SE=0.49%) for those with known cirrhosis. Excluding those without any screening, the mean PTC was still low at 32.0% (SE=0.27%) among all patients. After accounting for screening intent, the mean PTC was only 5.0% (SE=0.12%) among all patients and 13.8% (SE=0.38%) among those with known cirrhosis.
Predictors of Screening Receipt
Receipt of any screening was significantly associated with younger age, female sex, racial/ethnic minority status, known cirrhosis, presence of a documented liver disease etiology, hepatic decompensation including ascites or hepatic encephalopathy, higher comorbidity score, or prior visit with a gastroenterologist/hepatologist or internal medicine/family practice provider (Table 2). Among those with screening, female sex, Asian race, known cirrhosis, presence of a documented liver disease etiology, presence of decompensated cirrhosis, high comorbidity score and prior visit with a gastroenterologist/hepatologist were associated with higher PTC (Table 2). Predictors of consistent and inconsistent HCC screening, compared to no screening, identified by logistic regression analysis were similar (Supplemental Table 2).
Table 2.
Correlates for proportion of time covered by HCC screening (n=13,714)
| Probability of Receiving Any HCC Screening | Level of HCC Screening Among Those With Screening | |||||
|---|---|---|---|---|---|---|
| Variable | Adjusted Odds Ratio | 95% CI | P-value | Adjusted Coeff. | 95% CI | P-value |
| Age at HCC diagnosis | .99 | .98−.99 | .03 | .0004 | −.0002−.001 | .19 |
| Sex | ||||||
| Male | Ref | Ref | Ref | Ref | Ref | Ref |
| Female | 1.33 | 1.21–1.45 | <.001 | .01 | .003−.02 | .01 |
| Race/ethnicity | ||||||
| Non-Hispanic White | Ref | Ref | Ref | Ref | Ref | Ref |
| Black | 1.18 | 1.03–1.36 | .02 | −.002 | −.02−.01 | .80 |
| Hispanic | 1.44 | 1.27–1.64 | <.001 | .01 | −.001−.03 | .07 |
| Asian | 1.65 | 1.42–1.92 | <.001 | .07 | .05−.08 | <.001 |
| Other | 1.29 | 1.07–1.56 | .01 | .05 | .03−.07 | <.001 |
| Year of HCC diagnosis | ||||||
| 2003 | Ref | Ref | Ref | Ref | Ref | Ref |
| 2004 | .84 | .67–1.06 | .15 | −.003 | −.03−.02 | .83 |
| 2005 | .94 | .75–1.18 | .62 | −.03 | −.05-(−.0002) | .05 |
| 2006 | .77 | .62−.96 | .02 | −.01 | −.03−.02 | .56 |
| 2007 | .78 | .63−.97 | .03 | −.01 | −.03−.02 | .70 |
| 2008 | .81 | .65−.99 | .05 | −.01 | −.04−.01 | .25 |
| 2009 | .68 | .55−.85 | <.001 | −.03 | −.05-(−.003) | .03 |
| 2010 | .77 | .62−.96 | .02 | −.004 | −.03−.02 | .73 |
| 2011 | .70 | .57−.87 | .001 | −.01 | −.03−.02 | .65 |
| 2012 | .72 | .58−.88 | .002 | −.002 | −.03−.02 | .90 |
| 2013 | .75 | .61−.93 | .01 | .02 | −.002−.05 | .07 |
| Cirrhosis duration | ||||||
| No prior diagnosis | Ref | Ref | Ref | Ref | Ref | Ref |
| <3 years prior to HCC | 1.93 | 1.71–2.18 | <.001 | .02 | .004−.03 | .01 |
| >3 years prior to HCC | 1.42 | 1.24–1.63 | <.001 | .07 | .06−.09 | <.001 |
| Liver disease etiology | ||||||
| No known liver disease | Ref | Ref | Ref | Ref | Ref | Ref |
| Hepatitis B | 2.96 | 2.28–3.83 | <.001 | .08 | .05−.11 | <.001 |
| Hepatitis C | 2.39 | 2.10–2.72 | <.001 | .06 | .04−.08 | <.001 |
| Alcohol-related | 1.30 | 1.04–1.62 | .02 | .03 | −.003−.05 | .08 |
| Other liver disease | 2.38 | 2.05–2.78 | <.001 | .05 | .03−.07 | <.001 |
| >1 liver disease | 4.76 | 4.15–5.46 | <.001 | .10 | .09−.12 | <.001 |
| Presence of ascites | 1.27 | 1.09–1.47 | .002 | .02 | .004−.03 | .01 |
| Hepatic encephalopathy | 1.41 | 1.19–1.66 | <.001 | .04 | .03−.06 | <.001 |
| NCI comorbidity index | ||||||
| None | Ref | Ref | Ref | Ref | Ref | Ref |
| Low (1–2) | 1.31 | 1.05–1.63 | .02 | .01 | −.02−.05 | .54 |
| Moderate (3–4) | 1.64 | 1.32–2.05 | <.001 | .02 | −.01−.05 | .25 |
| High (5+) | 2.30 | 1.84–2.86 | <.001 | .04 | .003−.07 | .04 |
| Provider specialty | ||||||
| Other ‡ | Ref | Ref | Ref | Ref | Ref | Ref |
| Gastroenterology | 10.09 | 7.35–13.9 | <.001 | .06 | .01−.12 | .03 |
| Internal medicine | 3.28 | 2.39–4.52 | <.001 | .01 | −.05−.06 | .83 |
| Practice setting | ||||||
| Solo practice | Ref | Ref | Ref | Ref | Ref | Ref |
| Group practice | .97 | .88–1.07 | .56 | −.01 | −.02−.001 | .08 |
| Hospital-based | .86 | .72–1.02 | .08 | .001 | −.02−.02 | .93 |
| University-based | .93 | .60–1.44 | .74 | .02 | −.03−.06 | .45 |
| Other | .97 | .83–1.13 | .67 | .01 | −.01−.03 | .27 |
| Training location | ||||||
| Outside U.S. | Ref | Ref | Ref | Ref | Ref | Ref |
| Within U.S. | .92 | .84–1.01 | .09 | −.002 | −.01−.01 | .78 |
| Unknown | 1.06 | .79–1.43 | .69 | −.01 | −.05−.02 | .44 |
Providers other than gastroenterologist or primary care provider
Association Between Screening Receipt and Early Tumor Detection
Approximately one-third (35.1%; n=4,813) of HCC patients were diagnosed at an early stage within Milan Criteria. In multivariable logistic regression analysis, patients with consistent screening (adjusted OR 1.98; 95% CI 1.68–2.33) and inconsistent screening (adjusted OR 1.31; 95% CI 1.20–1.43) were associated with early tumor detection compared to no screening (Table 3). Similar results were observed after accounting for screening intent (data not shown). Of patients with known cirrhosis prior to HCC presentation, approximately one-half (56.2%) were detected at an early stage within Milan Criteria. Receipt of consistent screening (adjusted OR 2.56; 95% CI 2.02–3.24) and inconsistent screening (adjusted OR 1.70; 95% CI 1.42–2.03) were similarly associated with early tumor detection.
Table 3.
Multivariable logistic regression model for association between HCC screening receipt and early tumor detection (n=13,714)
| Variable | Adjusted OR | 95% CI | P-value |
|---|---|---|---|
| Screening group | |||
| No screening | Ref | Ref | Ref |
| Consistent screening* | 1.98 | 1.68–2.33 | <.001 |
| Inconsistent screening** | 1.31 | 1.20–1.43 | <.001 |
| Age at HCC diagnosis | .99 | .98−.99 | <.001 |
| Sex | |||
| Male | Ref | Ref | Ref |
| Female | 1.15 | 1.06–1.25 | .001 |
| Year of HCC diagnosis | |||
| 2003 | Ref | Ref | Ref |
| 2004 | 1.80 | 1.44–2.26 | <.001 |
| 2005 | 1.68 | 1.34–2.10 | <.001 |
| 2006 | 1.68 | 1.35–2.09 | <.001 |
| 2007 | 1.57 | 1.27–1.94 | <.001 |
| 2008 | 1.69 | 1.37–2.08 | <.001 |
| 2009 | 1.65 | 1.34–2.03 | <.001 |
| 2010 | 2.08 | 1.69–2.56 | <.001 |
| 2011 | 1.88 | 1.53–2.31 | <.001 |
| 2012 | 1.90 | 1.56–2.33 | <.001 |
| 2013 | 2.08 | 1.70–2.56 | <.001 |
| Cirrhosis duration | |||
| No prior diagnosis | Ref | Ref | Ref |
| <3 years prior to HCC | 1.80 | 1.61–2.01 | <.001 |
| >3 years prior to HCC | 1.88 | 1.67–2.13 | <.001 |
| Liver disease etiology | |||
| No known liver disease | Ref | Ref | Ref |
| Hepatitis B | 1.67 | 1.31–2.12 | <.001 |
| Hepatitis C | 1.81 | 1.60–2.04 | <.001 |
| Alcohol-related | 1.45 | 1.18–1.79 | .001 |
| Other liver disease | 1.36 | 1.17–1.58 | <.001 |
| >1 liver disease | 1.84 | 1.62–2.09 | <.001 |
| Hepatic encephalopathy | 1.28 | 1.12–1.46 | <.001 |
| Provider specialty | |||
| Other ‡ | Ref | Ref | Ref |
| Gastroenterology | .98 | .82–1.19 | .87 |
| Internal medicine | .76 | .64−.91 | .003 |
| Practice setting | |||
| Solo practice | Ref | Ref | Ref |
| Group practice | 1.06 | .97–1.15 | .19 |
| Hospital-based | 1.12 | .96–1.30 | .16 |
| University-based | 1.41 | .96–2.07 | .08 |
| Other | 1.04 | .90–1.20 | .59 |
| Training location | |||
| Outside U.S. | Ref | Ref | Ref |
| Within U.S. | 1.15 | 1.05–1.25 | .001 |
| Unknown | 1.25 | .96–1.64 | .19 |
Receipt of ≥1 abdominal ultrasound per calendar year
Receipt of ≥1 abdominal ultrasound during study period but less than annually
Providers other than gastroenterologist or primary care provider
Association Between Screening Receipt and Survival Without Adjusting for Lead and Length Time Biases
HCC patients who received consistent (HR 0.73; 95% CI 0.67 – 0.79) and inconsistent (HR 0.85; 95% CI 0.81 – 0.88) screening were associated with lower mortality compared with no screening (Table 4). The median survival was 17 months for patients with consistent screening, 10 months for inconsistent screening, and 5 months for no screening estimated from Kaplan Meier curves. The 3-year survival rate was 25% (95% CI 22–28), 20% (95% CI 19–21), and 13% (95% CI 12–14) for patients with consistent, inconsistent, and no screening, respectively (Supplemental Table 3).
Table 4.
Multivariable Cox proportional hazards model for association between HCC screening receipt and overall unadjusted survival (n=13,714)
| Variable | Adjusted HR | 95% CI | P-value |
|---|---|---|---|
| Screening group | |||
| No screening | Ref | Ref | Ref |
| Consistent screening* | .73 | .67−.79 | <.001 |
| Inconsistent screening** | .85 | .81−.88 | <.001 |
| Age at HCC diagnosis | 1.15 | 1.13–1.18 | <.001 |
| Race/ethnicity | |||
| Non-Hispanic White | Ref | Ref | Ref |
| Black | 1.07 | 1.01–1.14 | .03 |
| Hispanic | .99 | .94–1.05 | .76 |
| Asian | .82 | .77−.88 | <.001 |
| Other | .81 | .75−.88 | <.001 |
| Census poverty level | |||
| 0% to <5% | Ref | Ref | Ref |
| 5% to 9% | 1.06 | 1.00–1.12 | .04 |
| 10% to 19% | 1.07 | 1.02–1.13 | .01 |
| 20% to 100% | 1.19 | 1.13–1.26 | <.001 |
| Year of HCC diagnosis | |||
| 2003 | Ref | Ref | Ref |
| 2004 | .92 | .84–1.02 | .10 |
| 2005 | .91 | .83−.99 | .04 |
| 2006 | .85 | .77−.93 | <.001 |
| 2007 | .84 | .77−.92 | <.001 |
| 2008 | .87 | .79−.95 | <.001 |
| 2009 | .83 | .76−.91 | <.001 |
| 2010 | .78 | .71−.85 | <.001 |
| 2011 | .78 | .71−.85 | <.001 |
| 2012 | .84 | .77−.92 | <.001 |
| 2013 | .90 | .82−.98 | .02 |
| Cirrhosis duration | |||
| No prior diagnosis | Ref | Ref | Ref |
| <3 years prior to HCC | 1.04 | .98–1.10 | .24 |
| >3 years prior to HCC | 1.01 | .95–1.08 | .77 |
| Liver disease etiology | |||
| No known liver disease | Ref | Ref | Ref |
| Hepatitis B | .80 | .70−.91 | <.001 |
| Hepatitis C | .89 | .84−.95 | <.001 |
| Alcohol-related | .97 | .88–1.08 | .62 |
| Other liver disease | .87 | .81−.94 | <.001 |
| >1 liver disease | .84 | .79−.90 | <.001 |
| Presence of ascites | 1.34 | 1.25–1.43 | <.001 |
| NCI comorbidity index | |||
| None | Ref | Ref | Ref |
| Low (1–2) | 1.06 | .98–1.15 | .13 |
| Moderate (3–4) | 1.08 | 1.00–1.17 | .06 |
| High (5+) | 1.34 | 1.24–1.45 | <.001 |
| Provider specialty | |||
| Other ‡ | Ref | Ref | Ref |
| Gastroenterology | .73 | .67−.79 | <.001 |
| Internal medicine | .92 | .85–1.00 | .06 |
| Practice setting | |||
| Solo practice | Ref | Ref | Ref |
| Group practice | 1.00 | .96–1.04 | .98 |
| Hospital-based | .95 | .88–1.02 | .15 |
| University-based | .86 | .71–1.04 | .13 |
| Other | 1.02 | .96–1.09 | .54 |
Receipt of ≥1 abdominal ultrasound per calendar year
Receipt of ≥1 abdominal ultrasound during study period but less than annually
Providers other than gastroenterologist or primary care provider
Association Between Screening Receipt and Survival After Adjusting for Lead and Length Time Biases
Across sensitivity analyses with sojourn time ranging from 3–9 months, consistent and inconsistent screening continued to be associated with a survival benefit compared to no screening after adjusting for lead-time bias (Table 5). The difference in median survival time was estimated to be <1 month for patients with inconsistent screening and 1–3 months for those with consistent screening after adjusting for lead-time bias compared to the median survival time without adjustment, across the sensitivity analyses. One possible reason for the small impact of lead time bias is that the proportion of screen-detected patients was low (Supplemental Table 3, 4). Further adjustment for length time bias to screen-detected patients across all six assumptions had minimal impact on 1-, 3-, and 5-year survival rates (typically < 1% difference in survival rates compared to the estimators adjusting for lead time bias alone), so inconsistent and consistent screening continued to be associated with a survival benefit relative to the no-screening group (Supplemental Table 3).
Table 5.
Multivariable Cox proportional hazards model for association between HCC screening receipt and overall survival, adjusted for lead time bias (n=13,714)
| Screening group | Adjusted HR | 95% CI | P-value |
|---|---|---|---|
| Unadjusted | |||
| No screening | Ref | Ref | Ref |
| Consistent screening* | .73 | .67−.79 | <.001 |
| Inconsistent screening** | .85 | .81−.88 | <.001 |
| Adjusted for lead time bias | |||
| Mean sojourn time = 3 months | |||
| No screening | Ref | Ref | Ref |
| Consistent screening* | .75 | .69−.82 | <.001 |
| Inconsistent screening** | .86 | .82−.89 | <.001 |
| Mean sojourn time = 6 months | |||
| No screening | Ref | Ref | Ref |
| Consistent screening* | .76 | .70−.83 | <.001 |
| Inconsistent screening** | .86 | .83−.90 | <.001 |
| Mean sojourn time = 9 months | |||
| No screening | Ref | Ref | Ref |
| Consistent screening* | .77 | .71−.84 | <.001 |
| Inconsistent screening** | .86 | .83−.90 | <.001 |
Receipt of ≥1 abdominal ultrasound per calendar year
Receipt of ≥1 abdominal ultrasound during study period but less than annually
DISCUSSION
We found less than half of at-risk patients in a nationally representative cohort of patients in the United States underwent any HCC screening over the 3-year period prior to HCC diagnosis. HCC screening receipt was associated with early tumor detection and potentially improved overall survival, with attenuated benefits in those with inconsistent screening compared to those who had received consistent screening. Although HCC screening continues to be underused, screening receipt increased over time, suggesting HCC early detection and survival may be further improved in the future.
Prior studies have demonstrated HCC screening underuse, with less than 20% of at-risk patients undergoing HCC screening.11,12 Most patients are classified as undergoing inconsistent screening, although this category masks differences between patients, with some undergoing screening infrequently (e.g. 1 of 4 years) and others undergoing screening frequently (e.g. 3 of 4 years). There are fewer data evaluating screening receipt as a continuous measure, such as PTC, which can more accurately capture and distinguish degrees of inconsistent, non-adherent screening.33 Although we found that nearly half of all patients and roughly 70% of patients with known cirrhosis underwent some screening, the PTC reflected substantially lower adherent screening utilization. We found the mean PTC was less than 15% for all patients and remained less than 33% among those with screening.
This is the first study to report a PTC measure among a large population based sample. These findings help to better understand patterns of HCC screening adherence and to characterize patterns of underuse in screening. Interventions to improve screening adherence to individuals at high risk of HCC are clearly needed to increase rates of early tumor detection and improve HCC-related survival.34 We emphasize that future researchers should use a continuous measure like PTC, as they can better identify screening gaps and how often these gaps are occurring.
We found several patient- and provider-level characteristics that were associated with HCC screening receipt. The association between younger age and any HCC screening receipt may be related to provider perceptions of decreased benefit in elderly patients. However, prior studies suggest HCC screening continues to be of benefit in older patients with preserved liver function and low comorbidity.9,35,36 In contrast, the association between female sex and HCC screening receipt is unlikely to be related to differential perceived benefits. Studies have suggested females may be more likely to adhere to screening recommendations; however, patient adherence is not a common barrier to HCC screening completion and therefore it is unclear if this is the sole driver of this association.37 Asian race was also a prominent and steady predictor for HCC screening, which was consistent with findings from prior literature.17,38,39 This association may be attributed to high patient knowledge regarding HBV infection as a risk factor of HCC and the importance of HCC screening, given the high prevalence of HBV infection in Asian populations.38–42 Documented liver disease, the presence of known cirrhosis, and receipt of gastroenterology care were three of the strongest predictors for HCC screening receipt in our study, with all being consistently reported in prior studies.11,17,43–45 Although gastroenterology care is associated with increased screening receipt and survival, only a minority of patients received gastroenterology care prior to HCC diagnosis in our study. A prior survey study among primary care providers highlighted lack of knowledge about screening benefits and society guideline recommendations as one of the most common barriers to HCC screening, underlining the importance of educational efforts among these providers.46 Finally, many patients without screening had unrecognized liver disease and/or cirrhosis, which has been shown to be an important mediating factor for screening underuse.43,47 This may be particularly problematic in the future as HCC epidemiology shifts from viral-mediated to NASH, where lab tests are not available to diagnose liver disease and transition to cirrhosis can also be difficult to recognize.
Our study reinforces prior data about the importance of consistent HCC screening among high-risk individuals, with significantly improved early detection and survival after adjusting for lead and length time bias.32,48 Our study shows that this benefit is also demonstrated in clinical practice, although benefits were attenuated with inconsistent screening compared to consistent screening. This attenuated association between inconsistent screening and survival may partly explain prior studies that have shown smaller benefit of screening. Of note, there has been increasing recognition that HCC screening benefits must be weighed against screening harms, which could not be evaluated in our study.49 Further studies evaluating the balance of benefits and harms, including in subgroups such as those with NASH, are needed to further inform the importance of HCC screening in patients with cirrhosis.
Given our study’s strengths, we acknowledge it also has several limitations. Despite applying an algorithm to determine screening intent, this method is imperfect and prone to misclassification bias. We also did not capture alternative screening strategies (such as CT or MRI) that may be used in some practices and we did not account for healthy adherer effect, which could have potentially influenced patient screening utilization and subsequent health outcomes.50 Further, we also attempted to construct Milan Criteria using available tumor characteristics, but this was limited by missing data. Similarly, there is a possibility of missing ICD-9 codes for cirrhosis, leading to ascertainment bias for this subgroup analysis. We also did not have laboratory data to assess liver dysfunction or data on performance status, which can influence HCC screening utilization and observed benefits. Moreover, evaluating survival benefit of HCC screening from observational studies such this one may be subject to various biases. Although we adjusted for lead-time and length time biases, reliable model parameters are not readily available. Therefore, we conducted sensitivity analyses to assess the impact of these biases on estimated survival benefit across a range of plausible mean of sojourn times, proportions of slow-growing tumors and other required inputs.28 Selection bias and potential for residual confounding are difficult to correct in non-randomized studies; individuals who receive screen exams for HCC may be different from those who do not. Results of this study may not be generalizable to a wider population beyond a Medicare population.51 Finally, migration of patients in and out of SEER registry geographic areas could potentially cause loss to follow-up, affecting reliability of the data.52
In summary, we found HCC screening continues to be underutilized in the United States, with most patients not receiving any HCC screening prior to HCC diagnosis. Despite improvements over time, fewer than 10% of patients received consistent screening prior to HCC diagnosis, and the mean PTC with screening was less than 15% for all patients. Given the demonstrated benefits of HCC screening, it is clear increasing HCC screening utilization is an important step to reversing the high rates of late stage diagnosis and poor survival.
Supplementary Material
Figure 2A.
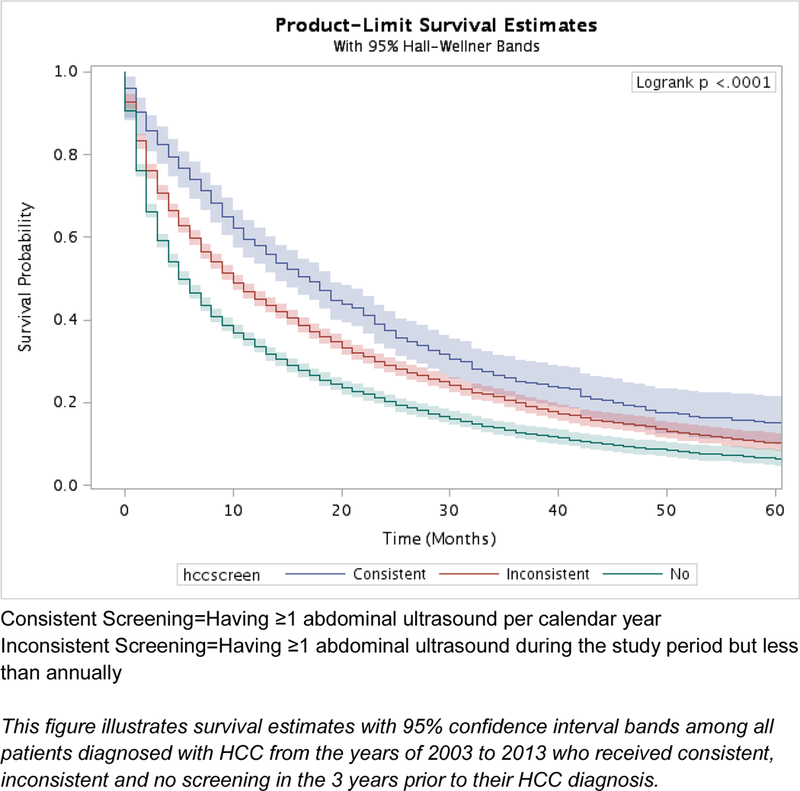
Kaplan-Meier survival estimates by receipt of HCC screening for all patients, unadjusted (n=13,714)
Figure 2B.
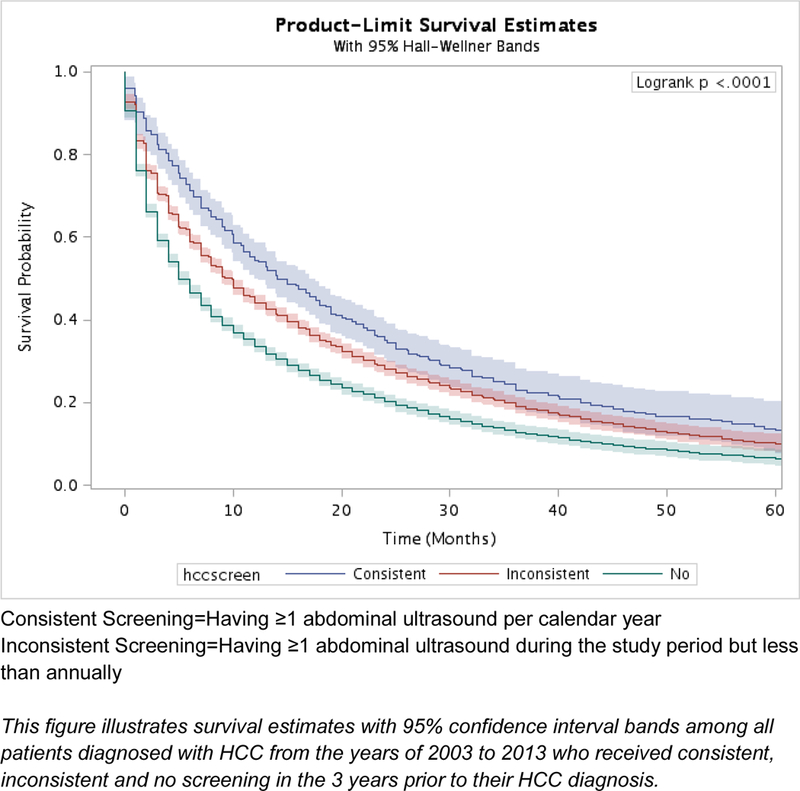
Kaplan-Meier survival estimates by receipt of HCC screening for all patients, adjusted for lead time bias with mean sojourn time 6 months (n=13,714)
What You Need to Know.
Background:
Hepatocellular carcinoma (HCC) screening is recommended in patients with cirrhosis to improve early tumor detection and survival but is underused in clinical practice.
Findings:
Consistent HCC screening is significantly associated with increased early detection and improved survival, but benefits are attenuated in those with inconsistent screening. However, HCC screening continues to be underutilized in the United States, with most patients not receiving any HCC screening prior to HCC diagnosis despite improvements over time. Fewer than 10% of patients receive consistent screening prior to HCC diagnosis, and the mean proportion of time covered by screening is less than 15% for all patients.
Implications for patient care:
Efforts are needed to increase HCC screening to reverse high rates of late stage tumor detection and poor HCC-related survival.
Acknowledgments
Grant Support: This work was conducted with support in part by the Center for Innovations in Quality, Effectiveness and Safety (#CIN 13-413), NCI RO1 CA212008 (Singal), and CPRIT RP150587 (Shen and Singal), and the Texas A&M Health Science Center and Texas A&M Engineering Experiment Station (TEES) big data seed grant program (Kum). The content is solely the responsibility of the authors and does not necessarily represent the official views of the Department of Veterans Affairs or National Institutes of Health.
ABBREVIATIONS:
- NCI
National Cancer Institute
- HCC
Hepatocellular carcinoma
- PTC
Proportion of time covered
- HBV
Hepatitis B virus
- HCV
Hepatitis C virus
Footnotes
Publisher's Disclaimer: This is a PDF file of an unedited manuscript that has been accepted for publication. As a service to our customers we are providing this early version of the manuscript. The manuscript will undergo copyediting, typesetting, and review of the resulting proof before it is published in its final citable form. Please note that during the production process errors may be discovered which could affect the content, and all legal disclaimers that apply to the journal pertain.
Conflicts of Interests: None of the authors have relevant conflicts of interest.
REFERENCES
- 1.Golabi P, Fazel S, Otgonsuren M, Sayiner M, Locklear CT, Younossi ZM. Mortality assessment of patients with hepatocellular carcinoma according to underlying disease and treatment modalities. Med 2017;96(9):e5904. doi: 10.1097/MD.0000000000005904 [DOI] [PMC free article] [PubMed] [Google Scholar]
- 2.Pons F, Varela M, Llovet JM. Staging systems in hepatocellular carcinoma. Hpb 2005;7(1):35–41. doi: 10.1080/13651820410024058 [DOI] [PMC free article] [PubMed] [Google Scholar]
- 3.El-Serag HB, Davila JA, Petersen NJ, McGlynn KA. The continuing increase in the incidence of hepatocellular carcinoma in the United States: an update. Ann Intern Med 2003;139(10):817–823. doi:139/10/817 [pii] [DOI] [PubMed] [Google Scholar]
- 4.Ferlay J, Soerjomataram I, Dikshit R, et al. Cancer incidence and mortality worldwide: Sources, methods and major patterns in GLOBOCAN 2012. Int J Cancer 2015;136(5):E359–E386. doi: 10.1002/ijc.29210 [DOI] [PubMed] [Google Scholar]
- 5.El-Serag HB, Kanwal F. Epidemiology of hepatocellular carcinoma in the United States: Where are we? Where do we go? Hepatology 2014;60(5):1767–1775. doi: 10.1002/hep.27222 [DOI] [PMC free article] [PubMed] [Google Scholar]
- 6.Ryerson AB, Eheman CR, Altekruse SF, et al. Annual Report to the Nation on the Status of Cancer, 1975–2012, Featuring the Increasing Incidence of Liver Cancer; 2016. doi: 10.1002/cncr.29936 [DOI] [PMC free article] [PubMed] [Google Scholar]
- 7.Dhir M, Lyden ER, Smith LM, Are C. Comparison of outcomes of transplantation and resection in patients with early hepatocellular carcinoma: A meta-analysis. HPB 2012;14(9):635–645. doi: 10.1111/j.1477-2574.2012.00500.x [DOI] [PMC free article] [PubMed] [Google Scholar]
- 8.El-Serag HB, Siegel AB, Davila J, et al. Treatment and outcomes of treating of hepatocellular carcinoma among Medicare recipients in the United States: a population-based study. J Hepatol 2006;44(1):158–166. doi: 10.1016/j.jhep.2005.10.002 [DOI] [PubMed] [Google Scholar]
- 9.El-Serag HB. Hepatocellular carcinoma. N Engl J Med 2011;365(12):1118–1127. doi: 10.1007/s10354-014-0296-7 [DOI] [PubMed] [Google Scholar]
- 10.Moon AM, Weiss NS, Beste LA, et al. No Association Between Screening for Hepatocellular Carcinoma and Reduced Cancer-Related Mortality in Patients With Cirrhosis. Gastroenterology July 2018. doi: 10.1053/J.GASTRO.2018.06.079 [DOI] [PMC free article] [PubMed] [Google Scholar]
- 11.Singal AG, Yopp A,S, Skinner C, Packer M, Lee WM, Tiro JA. Utilization of hepatocellular carcinoma surveillance among American patients: A systematic review. J Gen Intern Med 2012;27(7):861–867. doi: 10.1007/s11606-011-1952-x [DOI] [PMC free article] [PubMed] [Google Scholar]
- 12.Tzartzeva K, Obi J, Rich NE, et al. Surveillance Imaging and Alpha Fetoprotein for Early Detection of Hepatocellular Carcinoma in Patients With Cirrhosis: A Meta-analysis. Gastroenterology 2018;154(6):1706–1718.e1. doi: 10.1053/j.gastro.2018.01.064 [DOI] [PMC free article] [PubMed] [Google Scholar]
- 13. National Cancer Institute. Overview of the SEER Program.
- 14. National Cancer Institute. List of SEER Registries.
- 15.Warren JL, Klabunde CN, Schrag D, Bach PB, Riley GF. Overview of the SEER-Medicare data: content, research applications, and generalizability to the United States elderly population. Med Care 2002;40(8 Suppl):Iv-3–18. doi: 10.1097/01.mlr.0000020942.47004.03 [DOI] [PubMed] [Google Scholar]
- 16. National Cancer Institute. SEER-Medicare: SEER Program & Data.
- 17.Davila JA, Morgan RO, Richardson PA, Du XL, McGlynn KA, El-Serag HB. Use of surveillance for hepatocellular carcinoma among patients with cirrhosis in the United States. Hepatology 2010;52(1):132–141. doi: 10.1002/hep.23615 [DOI] [PMC free article] [PubMed] [Google Scholar]
- 18. American Medical Association. AMA Physician Masterfile.
- 19. American Medical Association. About the AMA Physician Masterfile.
- 20. National Cancer Institute. SEER-Medicare: Number of Cases for Selected Cancers Appearing in the Data.
- 21. The Henry J. Kaiser Family Foundation. Medicare Advantage. Kaiser Family Foundation.
- 22.Kramer JR, Davila JA, Miller ED, Richardson P, Giordano TP, El-Serag HB. The validity of viral hepatitis and chronic liver disease diagnoses in Veterans Affairs administrative databases. Aliment Pharmacol Ther 2008;27(3):274–282. doi: 10.1111/j.1365-2036.2007.03572.x [DOI] [PubMed] [Google Scholar]
- 23.Richardson P, Henderson L, Davila JA, et al. Surveillance for hepatocellular carcinoma: Development and validation of an algorithm to classify tests in administrative and laboratory data. Dig Dis Sci 2010;55(11):3241–3251. doi: 10.1007/s10620-010-1387-y [DOI] [PubMed] [Google Scholar]
- 24.Wong RJ, Devaki P, Nguyen L, Cheung R, Cho-Phan C, Nguyen MH. Increased long-term survival among patients with hepatocellular carcinoma after implementation of model for end-stage liver disease score. Clin Gastroenterol Hepatol 2014;12(9):1534–1540.e1. doi: 10.1016/j.cgh.2013.12.008 [DOI] [PubMed] [Google Scholar]
- 25.Wong R, Frenette C. Updates in the management of hepatocellular carcinoma. Gastroenterol Hepatol (N Y) 2011;7(1):16–24. doi: 10.1111/j.1743-7563.2007.00091.x [DOI] [PMC free article] [PubMed] [Google Scholar]
- 26. National Cancer Institute. NCI Comorbidity Index Overview.
- 27.Medeiros BC, Satram-Hoang S, Hurst D, Hoang KQ, Momin F, Reyes C. Big data analysis of treatment patterns and outcomes among elderly acute myeloid leukemia patients in the United States. Ann Hematol 2015;94(7):1127–1138. doi: 10.1007/s00277-015-2351-x [DOI] [PMC free article] [PubMed] [Google Scholar]
- 28.Duffy SW, Nagtegaal ID, Wallis M, et al. Correcting for lead time and length bias in estimating the effect of screen detection on cancer survival. Am J Epidemiol 2008;168(1):98–104. doi: 10.1093/aje/kwn120 [DOI] [PubMed] [Google Scholar]
- 29.Facciorusso A, Ferrusquía J, Muscatiello N. Lead time bias in estimating survival outcomes. Gut 2016;65(3):538–539. doi: 10.1136/gutjnl-2015-310199 [DOI] [PubMed] [Google Scholar]
- 30.El-Serag HB, Kramer JR, Chen GJ, Duan Z, Richardson PA, Davila JA. Effectiveness of AFP and ultrasound tests on hepatocellular carcinoma mortality in HCV-infected patients in the USA. Gut 2011;60(7):992–997. doi: 10.1136/gut.2010.230508 [DOI] [PubMed] [Google Scholar]
- 31.Thein HH, Campitelli MA, Yeung LT, Zaheen A, Yoshida EM, Earle CC. Improved Survival in Patients with Viral Hepatitis-Induced Hepatocellular Carcinoma Undergoing Recommended Abdominal Ultrasound Surveillance in Ontario: A Population-Based Retrospective Cohort Study. PLoS One 2015;10(9):e0138907. doi: 10.1371/journal.pone.0138907 [DOI] [PMC free article] [PubMed] [Google Scholar]
- 32.Singal AG, Pillai A, Tiro J. Early Detection, Curative Treatment, and Survival Rates for Hepatocellular Carcinoma Surveillance in Patients with Cirrhosis: A Meta-analysis. PLoS Med 2014;11(4). doi: 10.1371/journal.pmed.1001624 [DOI] [PMC free article] [PubMed] [Google Scholar]
- 33.Murphy CC, Sigel BM, Yang E, et al. Adherence to colorectal cancer screening measured as the proportion of time covered. Gastrointest Endosc 2018. doi: 10.1016/j.gie.2018.02.023 [DOI] [PMC free article] [PubMed] [Google Scholar]
- 34.Singal AG, Tiro JA, Marrero JA, et al. Mailed Outreach Program Increases Ultrasound Screeing of Patients with Cirrhosis for Hepatocellular Carcinoma. Gastroenterology 2017;152(3):608–615. doi: 10.1053/j.gastro.2016.10.042.Mailed [DOI] [PMC free article] [PubMed] [Google Scholar]
- 35.Pinter M, Trauner M, Peck-Radosavljevic M, Sieghart W. Cancer and liver cirrhosis: implications on prognosis and management. ESMO Open 2016;1(2):e000042. doi: 10.1136/esmoopen-2016-000042 [DOI] [PMC free article] [PubMed] [Google Scholar]
- 36.Singal AG, Li X, Tiro J, et al. Racial, Social, and Clinical Determinants of Hepatocellular Carcinoma Surveillance. Am J Med 2014;128(1):90.e1–90.e7. doi: 10.1016/j.amjmed.2014.07.027 [DOI] [PMC free article] [PubMed] [Google Scholar]
- 37.Farvardin S, Patel J, Khambaty M, et al. Patient-Reported Barriers Are Associated With Lower Hepatocellular Carcinoma Surveillance Rates in Patients With Cirrhosis. Hepatology 2017;65(3):875–884. doi: 10.1002/hep.28770 [DOI] [PMC free article] [PubMed] [Google Scholar]
- 38.Yau AHL, Ford JA, Kwan PWC, et al. Hepatitis B Awareness and Knowledge in Asian Communities in British Columbia. Can J Gastroenterol Hepatol 2016. doi: 10.1155/2016/4278724 [DOI] [PMC free article] [PubMed] [Google Scholar]
- 39.Khalili M, Guy J, Yu A, et al. Hepatitis B and hepatocellular carcinoma screening among Asian Americans: Survey of safety net healthcare providers. Dig Dis Sci 2011;56(5):1516–1523. doi: 10.1007/s10620-010-1439-3 [DOI] [PMC free article] [PubMed] [Google Scholar]
- 40.Altekruse SF, McGlynn KA, Reichman ME. Hepatocellular carcinoma incidence, mortality, and survival trends in the United States from 1975 to 2005. J Clin Oncol 2009;27(9):1485–1491. doi: 10.1200/JCO.2008.20.7753 [DOI] [PMC free article] [PubMed] [Google Scholar]
- 41.Tong MJ, Siripongsakun S, Stanford-Moore G, Hsu L, Chang PW, Blatt LM. Tumor factors associated with clinical outcomes in patients with hepatitis B virus infection and hepatocellular carcinoma. Gastroenterol Hepatol (N Y) 2012;8(12):808–819. [PMC free article] [PubMed] [Google Scholar]
- 42.Rosenblatt KA, Weiss NS, Schwartz SM. Liver cancer in Asian migrants to the United States and their descendants. Cancer Causes Control 1996;7(3):345–350. [DOI] [PubMed] [Google Scholar]
- 43.Singal AG, Yopp AC, Gupta S, et al. Failure Rates in the Hepatocellular Carcinoma Surveillance Process. Cancer Prev Res 2012;5(9):1124–1130. doi: 10.1038/nature13314.A [DOI] [PMC free article] [PubMed] [Google Scholar]
- 44.Ahmed Mohammed HA, Yang JD, Giama NH, et al. Factors Influencing Surveillance for Hepatocellular Carcinoma in Patients with Liver Cirrhosis. Liver Cancer 2017;6(2):126–136. doi: 10.1159/000450833 [DOI] [PMC free article] [PubMed] [Google Scholar]
- 45.Davila JA, Henderson L, Kramer JR, et al. Utilization of Surveillance for Hepatocellular Carcinoma Among Hepatitis C Virus–Infected Veterans in the United States. Ann Intern Med 2011;154(2):85–93. doi: 10.7326/0003-4819-154-2-201101180-00006. [DOI] [PubMed] [Google Scholar]
- 46.Dalton-Fitzgerald E, Tiro J, Kandunoori P, Halm EA, Yopp A, Singal AG. Practice patterns and attitudes of primary care providers and barriers to surveillance of hepatocellular carcinoma in patients with cirrhosis. Clin Gastroenterol Hepatol 2015;13(4):791–798.e1. doi: 10.1016/j.cgh.2014.06.031 [DOI] [PMC free article] [PubMed] [Google Scholar]
- 47.Kanwal F, El-Serag HB, Ross D. Surveillance for hepatocellular carcinoma: can we focus on the mission? Clin Gastroenterol Hepatol 2015;13:805–807. doi: 10.1016/j.cgh.2014.12.016 [DOI] [PubMed] [Google Scholar]
- 48.Singal AG, Mittal S, Yerokun OA, et al. Hepatocellular Carcinoma Screening Associated with Early Tumor Detection and Improved Survival Among Patients with Cirrhosis in the US. Am J Med 2017;130(9):1099–1106.e1. doi: 10.1016/j.amjmed.2017.01.021 [DOI] [PubMed] [Google Scholar]
- 49.Atiq O, Tiro J, Yopp AC, et al. An assessment of benefits and harms of hepatocellular carcinoma surveillance in patients with cirrhosis. Hepatology 2017;65(4):1196–1205. doi: 10.1002/hep.28895 [DOI] [PMC free article] [PubMed] [Google Scholar]
- 50.Ladova K, Vlcek J, Vytrisalova M, Maly J. Healthy adherer effect – the pitfall in the interpretation of the effect of medication adherence on health outcomes. J Eval Clin Pract 2014;20(2):111–116. doi: 10.1111/jep.12095 [DOI] [PubMed] [Google Scholar]
- 51. Centers for Disease Control and Prevention. Limitations of CMS data: Medicare.
- 52.Yu JB, Smith BD. NCI SEER Public-Use Data: Applications and Limitations in Oncology Research [PubMed] [Google Scholar]
Associated Data
This section collects any data citations, data availability statements, or supplementary materials included in this article.