

Abstract
This study was conducted to compare antioxidant contents and antioxidative activities in the leaves and petioles of six sweet potato varieties, namely Danjami, Hayanmi, Hogammi, Jinyulmi, Poongwonmi, and Yeonjami. Total amount of phenolic acids was highest in Poongwonmi and lowest in Hogammi, while vitamin C level was highest in Danjami. Of four phenolic acids quantified, 3,5-dicaffeoylquinic acid was the most abundant in all varieties. The contents of phenolic acids and vitamin C were more than ten-fold higher in the leaves compared with the petioles. In addition, the leaves had much lower EC50 values for DPPH scavenging activities and reducing power than the petioles, indicating that sweet potato leaves have a higher antioxidant capacity than the petioles. Blanching, including conventional and microwave, resulted in a considerable decrease of antioxidant content and activity in the leaves due to thermal degradation and leaching.
Keywords: Sweet potato leaves, Sweet potato petioles, Phenolic compound, DPPH, Reducing power
Introduction
Sweet potato (Ipomoea batatas L.) ranks the world’s sixth most important food crop with the production of 178 million tonnes in 2014 (FAOSTAT, 2017). Sweet potato consists of four major parts including the root, stem, petiole (shoot), and leaf. Daily consumption of tuberous root was estimated to be 17.70 g in the Korean population and the petiole was consumed at a small amount of 0.42 g per day (KHIDI, 2014).
Earlier studies focused on the antioxidant including anthocyanins (Yoshinaga et al., 1999) and carotenes (Wu et al., 2008) in the root of sweet potato. Recently, more attention has been paid to the leaves and petioles of sweet potato due to the existence of antioxidants such as phenolic compounds. Ishida et al. (2000) demonstrated that the contents of minerals, vitamins, and polyphenols were high in the leaves of two Japanese sweet potatoes. Hue et al. (2012) reported that the leaf extracts of six Malaysian sweet potato varieties contained total flavonoids, total phenolics, reducing activities, and radical scavenging activities. Liao et al. (2011) found that the water extracts of four Taiwanese sweet potato leaves had potent antioxidant effects. Truong et al. (2007) also found that the leaves had the highest content of phenolic acid compared with the peel and root of three American sweet potato varieties. These indicate that sweet potato leaves can be a valuable source of antioxidants. Nevertheless, a large amount of leaves generated from sweet potato production of 3 million tonnes in 2014 (FAOSTAT, 2017) was discarded in South Korea.
Sweet potato leaves are commonly cooked by conventional blanching or microwave blanching to soften tissues. Conventional blanching is the process where vegetables is treated in boiling water. In comparison, microwave blanching is similar to steam blanching that uses a smaller amount of water, thereby leading to a better retention of water-soluble bioactive compounds such as vitamin C as compared with conventional blanching (Ruiz-Ojeda and Peñas, 2013). These cooking methods may lead to the changes in antioxidant content and activity of sweet potato leaves.
Therefore, the possibility of sweet potato petioles and leaves as functional ingredient as well as cooking effect on bioactive compounds should be investigated. The objectives of this study were i) to compare antioxidant content and antioxidant activity in the petioles and leaves of six major sweet potato varieties genetically engineered in South Korea, and ii) to evaluate the effect of blanching methods on antioxidant content and activity in the leaves.
Materials and methods
Chemicals
Folin-Ciocalteu’s reagent, sodium carbonate, chlorogenic acid, 2,2-diphenyl-1-picrylnydrazyl (DPPH), L-ascorbic acid, 2,6-di-tert-butyl-4-methylphenol (BHT), tocopherol, potassium phosphate monobasic (KH2PO4), potassium phosphate dibasic (K2HPO4), potassium ferricyanide (K3Fe(CN)6), iron chloride, trichloroacetic acid, D,L-dithiothreitol, formic acid, and 3,5-dicaffeoylquinic acid were purchased from Sigma-Aldrich (St. Louis, MO, USA). Acetonitrile and meta-phosphoric acid were purchased from Junsei Chemical (Tokyo, Japan) and J.T. Baker (Center Valley, PA, USA), respectively. Ethyl alcohol was purchased from Samchun Pure Chemical (Pyungtack, Korea).
Samples
Sweet potato varieties, which include Danjami, Hayanmi, Hogammi, Jinyulmi, Poongwonmi, and Yeonjami, were developed by the National Institute of Crop Science and cultivated at the Bioenergy Crop Research Center (Muan, Korea) in 2017. All varieties of sweet potatoes were planted on 27 March 2017 and harvested on 13 June 2017. Sweet potato vines (2 kg) of each variety were packed in a cardboard box and transported within 24 h to the Seoul Women’s University. The sweet potato vines were divided into two parts such as leaves and petioles after non-edible stems were removed. The measurements of the length (cm) and weight (g) were conducted with three replications on 20 petioles per genotype. The petioles and leaves were packaged in a vacuum plastic bag, frozen and then freeze-dried at − 50 °C at a pressure of 1.1 Pa for 48 h (EYELA freeze-drier FDU-1200, Tokyo, Japan). The dried samples were ground in an analytical mill (A10 basic, IKA, Staufen, Germany), passed through a 50-mesh (≤ 300 μm) stainless steel sieve and then stored at − 35 °C until analysis.
Blanching
Leaves of Poongwonmi that contains the highest content of phenolic acids among six varieties were selected for comparing the influence of cooking methods. For conventional blanching, 20 g of leaves was soaked in hot distilled water (400 mL, 100 °C) in a glass beaker and heated for 2 min on the gas range. For microwave blanching, 20 g of leaves were placed in a polypropylene microwave steamer bowl (Hanmimaru, Gimpo, Korea) containing 200 mL of distilled water in the bottom. The bowl was covered with a polyethylene transparent lid in order to prevent water losses. The leaves were cooked for 1 min using a microwave oven (700 W, LG MW-290EV, Changwon, Korea). The optimal condition of microwave blanching for leaves was selected among those providing a similar softness in comparison with conventionally blanched leaves. After cooking stopped, leaves and cooking water were separately kept at − 35 °C until analysis. Each cooking test was performed three times.
Color analysis
The color analysis was performed on the sample powder in a petri dish using a Minolta CHROMA METER CR-400 (Konica Minolta Sensing Inc., Osaka, Japan). The color reflectance values were expressed using L* (lightness), a* (redness), and b* (yellowness). All measurements were performed in triplicate.
Sample extraction
The pulverized sample (petioles 0.2 g, leaves 0.1 g) was weighed into a 50 mL centrifuge bottle and then extracted with 25 mL of 80% aqueous ethanol using an ultrasonic bath (Power Sonic 410, Hwashin, Gwangju, Korea) with a frequency of 40 kHz for 30 min at 50 °C. The extract was centrifuged using a high-speed centrifuge (2236R, Labogene, Daejeon, Korea) at 17,000×g for 10 min at 4 °C. The supernatant was transferred to a 50 mL volumetric flask, and the residue was re-extracted using the same procedure as described above. The combined supernatant was adjusted to 50 mL using 80% aqueous ethanol.
Total phenolic determination
Total phenolics were determined using the colorimetric method of Singleton et al. (1999) with some modifications. The extract (250 μL) was mixed with 250 μL of two-fold diluted Folin-Ciocalteu reagent in a test tube and allowed to stand for 2 min. Then, 2 mL of distilled water and 250 μL of a saturated sodium carbonate solution were added to the tube and then vortexed. After placed in the dark for 60 min, absorbance of the mixture was measured at 725 nm (Biochrom Libra S22, Santa Barbara, CA, USA). The total phenolic content was expressed as g of chlorogenic acid equivalent (CAE) per 100 g of fresh sample. The standard curve was prepared at six different concentrations from 10 to 100 μg/mL. All experiments were repeated three times.
Phenolic acid quantification
Phenolic acids were quantified using a high-performance liquid chromatograph (HPLC) (Agilent Technologies, 1260 Infinity, Waldbronn, Germany) equipped with a diode array detector (DAD). The extract was filtered with a 0.45 µm Millex-FH hydrophobic fluoropure (PTFE) membrane (Millipore, Milford, MA, USA). The separation was performed using a Kinetex C18 (5 μm, 150 × 4.6 mm, Phenomenex, Torrance, CA, USA) at 40 °C. The injection volume was 5 µL and the flow rate was 1 mL/min. The mobile phase consisted of 0.1% formic acid in water (solution A) and acetonitrile (solution B). The gradient was as follows: 0–5 min, 85–63% A; 5–10 min, 63–20% A; and 10–11 min, 20–0% A. The separated phenolic acids were monitored at 325 nm. Phenolic acids were confirmed by comparison of the retention times and ultraviolet–visible (UV–Vis) spectra with pure authentic standards (chlorogenic acid and 3,5-dicaffeoylquinic acid, 5–100 μg/mL).
Vitamin C quantification
Vitamin C was determined using the method of Koh et al. (2012). Approximately 0.5 g of the pulverized sample was mixed with 25 mL of 2.5% meta-phosphoric acid for 1 min and then centrifuged at 46,000×g for 20 min at 4 °C. The supernatant was transferred into a 50 mL volumetric flask and the residue was re-extracted. The combined supernatant was adjusted to 50 mL and then filtered through a 0.45 μm polytetrafluoroethylene (PTFE) membrane (Whatman, Florham Park, NJ, USA). For the reduction of dehydroascorbic acid into ascorbic acid, 1 mL of the filtrate was reacted with 0.20 mL of D,L-dithiothreitol (40 mg/mL) at 40 °C for 2 h. These were analysed using an Agilent 1260 Infinity liquid chromatograph (Waldbronn, Germany) equipped with a diode array detector. The separation was performed using a Kinetex C18 (5 μm, 150 × 4.6 mm, Phenomenex, Torrance, CA, USA). An isocratic separation was performed using a 0.05 M KH2PO4 solution (pH 2.6) at a flow rate of 0.8 mL/min. The absorbance of ascorbic acid was monitored at 245 nm. The quantification linear range of ascorbic acid was 10 − 100 μg/mL.
DPPH radical scavenging activity determination
Radical scavenging activity was determined using the method of Nur Alam et al. (2013). One mL of 0.2 mM DPPH in ethanol was added to various concentrations of leaf and petiole extracts (1 mL), mixed, and then allowed to stand for 30 min in the dark at room temperature. The absorbance was measured at 517 nm. The blank was prepared with an extraction solvent (80% ethanol) instead of the sample extract. The percentage of the DPPH radical scavenging activity was calculated as follows:
Ablank and Asample were the control and extract absorbance, respectively. The results were expressed as EC50, which is the effective concentration at which DPPH radicals were scavenged by 50%. The reference positive controls were ascorbic acid, BHT, and tocopherol. All experiments were performed in triplicate.
Reducing power determination
Reducing power was determined according to the method of Oyaizu (1986). Various concentrations of leaf and petiole extracts (1 mL) were mixed with 1 mL of 200 mM sodium phosphate buffer (pH 6.6) and 1 mL of 1% potassium ferricyanide. After incubated at 50 °C for 20 min, 1 mL of 10% trichloroacetic acid (w/v) was added to the tube. Then, 1 mL of the mixture was reacted with 1 mL of distilled water and 0.2 mL of 0.1% ferric chloride and then placed for 10 min at room temperature. The absorbance was measured at 700 nm. The extract concentration (EC50) that the absorbance reaches 0.5 was calculated from the graph of absorbance at 700 nm against the extract concentrations. Ascorbic acid was used as a control. All experiments were performed in triplicate.
Statistical analysis
All statistical analyses were performed using the SPSS IBM version 21.0 (Statistical Package for Social Science, SPSS Inc., Chicago, IL, USA). Average and standard deviations were calculated from triplicate measurements. A one-way analysis of variance (ANOVA) was used to determine the significant difference between samples.
Results and discussion
Morphological characteristics and color intensity
A summary of the differences in the morphological characteristics and color of six sweet potato varieties are presented in Table 1. Skin color of root ranged from scarlet to purple and the flesh color were white, orange, red–orange or light purple. In the petiole, Hayanmi and Yeonjami had a purple-colored skin and the other cultivars had a green-colored skin. Only Hayanmi had a purple-colored leaf and the other varieties had a green-colored leaf. The mean length of the petioles varied significantly among the genotypes, which ranged from 13.64 cm in Poongwonmi to 23.27 cm in Hayanmi. A mean weight of the petioles was highest in Hayanmi and Yeonjami. The color intensity of the pulverized petioles and leaves varied depending on the genotype. The L* (lightness) value of the leaves and petioles was highest in Yeonjami. The values of a* (redness) and b* (yellowness) were highest in Hogammi petioles and Jinyulmi leaves, respectively. The leaves had a lower lightness compared with the counterpart petioles in all genotypes. These indicate that sweet potato cultivars tested in this study cover a wide range of color and morphology.
Table 1.
Morphological characteristics and color intensity of six sweet potato varieties
| Variety | Leaves | Petioles | Root | |||||||||
|---|---|---|---|---|---|---|---|---|---|---|---|---|
| Color | L* | a* | b* | Color | Length1 | Weight1 | L* | a* | b* | Skin color | Flesh color | |
| Danjami | Green | 54.72 | − 19.52 | 32.86 | Green | 15.84 | 1.07 | 75.38 | − 15.13 | 28.35 | Purple | Light purple |
| Hayanmi | Green-purple | 52.43 | − 14.72 | 25.86 | Purple | 23.27 | 2.31 | 69.96 | − 12.47 | 28.43 | Scarlet | White |
| Hogammi | Green | 45.87 | − 16.88 | 28.08 | Green | 17.16 | 1.72 | 72.69 | − 17.50 | 31.15 | Scarlet | Red orange |
| Jinyulmi | Green | 55.32 | − 19.84 | 34.56 | Green | 13.87 | 1.02 | 67.88 | − 14.97 | 30.67 | Scarlet | Orange |
| Poongwonmi | Green | 48.87 | − 18.25 | 31.42 | Green | 13.64 | 1.15 | 71.88 | − 16.84 | 31.03 | Scarlet | Red orange |
| Yeonjami | Green | 58.05 | − 19.46 | 32.70 | Green-purple | 22.13 | 2.35 | 75.72 | − 14.50 | 28.39 | Deep purple | Light purple |
L* (lightness), a* (redness), and b* (yellowness) of pulverized samples were determined. 1 Average of three replications on 20 petioles for each genotype
Total phenolics content
As shown in Table 2, total phenolic contents were 0.07–0.14 g CAE/100 g fresh weight (FW) in the petioles and 0.65–1.91 g CAE/100 g FW in the leaves, respectively. This is similar to the results of earlier studies. Truong et al. (2007) reported that the total phenolic content in the leaves of three sweet potato cultivars in the United States ranged from 1.22 to 1.30 g CAE/100 g FW. Interestingly, the leaves contained about ten-fold higher phenolic content than the petioles. Jung et al. (2011) also demonstrated that total phenolics were present in six-fold higher amounts in leaves than in petioles of Korean sweet potato. Similarly, Islam et al. (2003) reported that the highest polyphenol concentration was found in sweet potato leaves, followed by petioles, stems, and tubers.
Table 2.
Total phenolics, DPPH radical scavenging activity, and reducing power in petioles and leaves of six sweet potato varieties
| Variety | Total phenolics (g CAE/100 g FW) | DPPH-scavenging (EC50, mg/mL) | Reducing power (EC50, mg/mL) | |||
|---|---|---|---|---|---|---|
| Petioles | Leaves | Petioles | Leaves | Petioles | Leaves | |
| Danjami | 0.07 ± 0.01b | 1.16 ± 0.12c | 2.26 ± 0.33a | 0.25 ± 0.01b | 4.68 ± 0.13ab | 0.51 ± 0.01b |
| Hayanmi | 0.07 ± 0.01b | 1.29 ± 0.09c | 2.08 ± 0.09a | 0.17 ± 0.01c | 2.51 ± 0.02c | 0.42 ± 0.00c |
| Hogammi | 0.07 ± 0.00b | 0.65 ± 0.07d | 2.31 ± 0.09a | 0.40 ± 0.02a | 4.64 ± 0.07b | 0.77 ± 0.03a |
| Jinyulmi | 0.14 ± 0.02a | 1.91 ± 0.03a | 1.94 ± 0.32a | 0.13 ± 0.00d | 2.59 ± 0.03c | 0.37 ± 0.01cd |
| Poongwonmi | 0.09 ± 0.01b | 1.60 ± 0.12b | 1.94 ± 0.32a | 0.13 ± 0.01d | 2.51 ± 0.02c | 0.35 ± 0.01d |
| Yeonjami | 0.07 ± 0.01b | 1.54 ± 0.11b | 2.15 ± 0.12a | 0.18 ± 0.01c | 4.82 ± 0.14a | 0.37 ± 0.07cd |
Total phenolics are expressed as a chlorogenic acid equivalent (CAE). FW means fresh weight. EC50 was obtained by interpolating from a linear regression analysis. Each value is expressed as mean ± standard deviation (n = 3). Values with different letters in a column are significantly different (P < 0.05)
Phenolic acid content
The phenolic acid contents in the leaves and petioles of sweet potatoes are presented in Table 3. Four phenolic compounds, including chlorogenic acid (ChA), 4,5-dicaffeoylquinic acid (4,5-diCQA), 3,5-dicaffeoylquinic acid (3,5-diCQA), and 3,4-dicaffeoylquinic acid (3,4-diCQA), were identified in leaves and petioles. Of these compounds, 3,5-diCQA was the most abundant in all varieties. This is in agreement with the results of Jung et al. (2011), who demonstrated that the leaves and petioles of three sweet potato varieties contained higher amounts of 3,5-diCQA. Meanwhile, 3,4-diCQA was not detected in the petioles of Hayanmi, Hogammi, and Yeonjami. Total amounts of phenolic acids were 12.60–50.37 mg/100 g FW in petioles and 224.19–704.52 mg/100 g FW in leaves, respectively. This is similar to the results of earlier investigations. Jung and Im (2012) demonstrated that the sum of phenolic acids in three Korean sweet potato varieties were 15.13–70.02 mg/100 g FW in petioles and 250.32–375.68 mg/100 g FW in leaves, respectively. Jung et al. (2011) also reported that the total amount of phenolic acids was 250.3–375.7 mg/100 g FW in sweet potato leaves and 15.13–70.02 mg/100 g FW in the petioles. Truong et al. (2007) also demonstrated that the total content of phenolic acids ranged from 430.5 to 462.9 mg/100 g FW in sweet potato leaves. The total amount of phenolic compounds in the petioles was highest in Jinyulmi (50.37 mg/100 g FW), while this in the leaves was highest in Poongwonmi (704.52 mg/100 g FW). Similar to total phenolics, total contents of phenolic acids in the leaves was approximately 10–30 fold higher in comparison with those in the petioles.
Table 3.
Contents of individual phenolic compounds in petioles and leaves of six sweet potato varieties (mg/100 g FW)
| Variety | ChA | 4,5-diCQA | 3,5-diCQA | 3,4-diCQA | Sum1 | |||||
|---|---|---|---|---|---|---|---|---|---|---|
| Petioles | Leaves | Petioles | Leaves | Petioles | Leaves | Petioles | Leaves | Petioles | Leaves | |
| Danjami | 7.25 ± 0.45c | 80.12 ± 7.07d | 4.65 ± 0.50b | 65.10 ± 14.08c | 13.41 ± 0.97b | 190.10 ± 16.53c | 2.31 ± 0.17c | 20.42 ± 1.42c | 27.62 ± 1.87c | 355.73 ± 37.75c |
| Hayanmi | 7.82 ± 0.15c | 134.43 ± 4.89b | 4.22 ± 0.54b | 86.60 ± 2.10bc | 11.64 ± 1.23c | 275.71 ± 11.47b | N.D. | 35.90 ± 1.33b | 23.69 ± 1.91d | 532.64 ± 19.76b |
| Hogammi | 3.88 ± 0.14d | 46.19 ± 0.52e | 2.84 ± 0.36c | 32.93 ± 7.29d | 5.88 ± 0.41e | 132.03 ± 12.36d | N.D. | 13.03 ± 4.17d | 12.60 ± 0.87e | 224.19 ± 23.40d |
| Jinyulmi | 16.07 ± 1.85a | 155.92 ± 4.69a | 10.54 ± 1.10a | 155.81 ± 27.02a | 20.58 ± 0.43a | 311.35 ± 22.97b | 3.17 ± 0.13b | 37.03 ± 1.02b | 50.37 ± 3.42a | 660.12 ± 53.92a |
| Poongwonmi | 8.65 ± 0.86bc | 138.25 ± 7.24b | 4.14 ± 0.51b | 101.13 ± 10.58b | 21.41 ± 1.51a | 421.16 ± 26.06a | 3.44 ± 0.16a | 43.99 ± 2.50a | 37.65 ± 2.82b | 704.52 ± 46.29a |
| Yeonjami | 10.11 ± 0.39b | 114.66 ± 9.10c | 4.77 ± 0.13b | 97.27 ± 18.97b | 8.08 ± 0.16d | 403.79 ± 34.85a | N.D. | 45.17 ± 3.03a | 22.96 ± 0.67d | 660.89 ± 63.04a |
ChA chlorogenic acid; 4,5-diCQA 4,5-dicaffeoylquinic acid; 3,5-diCQA 3,5-dicaffeoylquinic acid; 3,4-diCQA 3,4-dicaffeoylquinic acid. N.D. not detected, FW fresh weight
1Total amount of ChA, 4,5-diCQA, 3,5-diCQA, and 3,4-diCQA
a–dValues with different letters in a column are significantly different (P < 0.05). Each value is expressed as mean ± standard deviation (n = 3)
Vitamin C content
Ascorbic acid contents ranged from 1.05 to 6.03 mg/100 g FW in the petioles and from 21.60 to 87.88 mg/100 g FW in the leaves, respectively (Fig. 1). The levels of vitamin C (the sum of ascorbic acid and dehydroascorbic acid) were between 3.42 and 6.69 mg/100 g FW in the petioles and between 31.22 and 93.43 mg/100 g FW in the leaves. Our values for vitamin C are quite different from the levels, 15 and 30 mg/100 g FW, of the Korean Food Composition Table (2011). However, it is similar to the result of Ishida et al. (2000), who reported that the vitamin C content in Japanese sweet potato petioles and leaves were 9–17.3 and 62.7–81.0 mg/100 g FW, respectively. Of the varieties studied herein, Hogammi had the highest vitamin C content in the petioles, while Danjami had the highest vitamin C level in the leaves. The values of ascorbic acid and vitamin C in the leaves were considerably higher than those in the petioles. In addition, the proportions of ascorbic acid to vitamin C in the leaves were different depending on variety, which ranged from 69 to 94%.
Fig. 1.
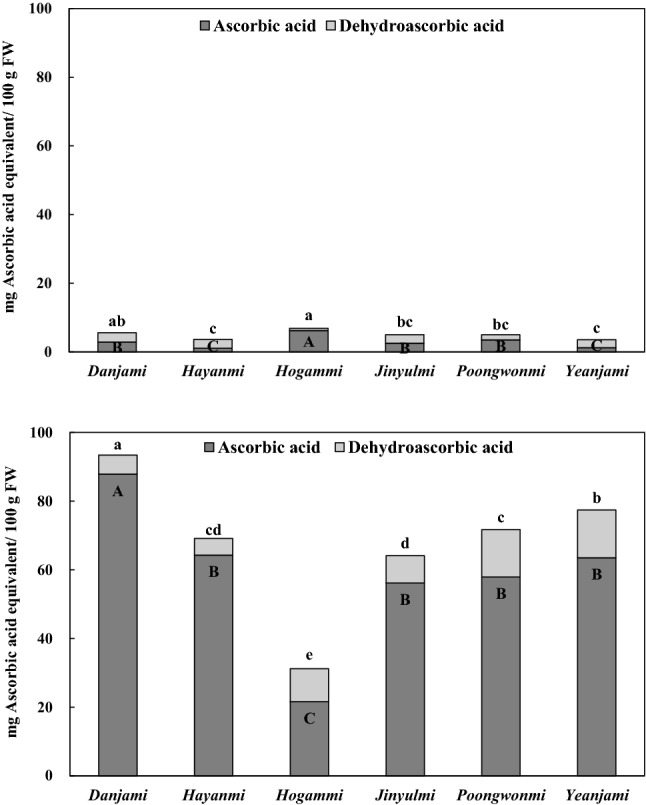
Contents of vitamin C (sum of ascorbic acid and dehydroascorbic acid) in the petioles (upper) and leaves (bottom) of sweet potato varieties. (A–D) Bar graphs with the same capital letters are not significantly different in vitamin C contents (P < 0.05). (A–D) Bar graphs with the same small letters are not significantly different in ascorbic acid contents (P < 0.05). FW means fresh weight
Antioxidant activity
The EC50 value is the effective concentration of a sample for a 50% reduction of free radicals or the Fe3+/ferricyanide complex of the ferrous form. The DPPH radical scavenging activity and the reducing power of the sweet potato extracts increased with increasing concentrations. The EC50 values determined from the plotted graph of scavenging activity against the concentration of sweet potato petioles and leaves are presented in Table 2. A lower EC50 value indicates a stronger antioxidant activity of a sample. No significant difference in the petioles was found between DPPH radical scavenging activity and variety. On the other hand, the DPPH radical scavenging activity in the leaves varied depending on the genotype with the lowest EC50 value in Poongwonmi and Jinyulmi (0.13 mg/mL). The activities of the leaf extracts were ranked in decreasing order: Jinyulmi ≈ Poongwonmi > Hayanmi ≈ Yeonjami > Danjami > Hogammi. The EC50 values of the positive controls were ascorbic acid at 21.69 μg/mL, BHT at 17.27 μg/mL, and a-tocopherol at 25.36 μg/mL (data not shown). The sweet potato leaves showed significantly lower EC50 values than the petioles, indicating that sweet potato leaves have a higher DPPH radical scavenging activity. This is consistent with the result of Li et al. (2012) reporting that DPPH radical scavenging activity of fourteen Korean sweet potato varieties was considerably higher in leaves compared with petioles.
The reducing power (EC50) of the petioles ranged from 2.51 to 4.82 mg/mL. The EC50 value with ascorbic acid as the control was 16.03 μg/mL. The reducing power in the petioles were ranked in the order: Hayanmi ≈ Poongwonmi ≈ Jinyulmi > Hogammi ≥ Danjami ≈ Yeonjami (Table 2). In the leaves, the reducing power was lowest in Hogammi and highest in Poongwonmi, Jinyulmi, and Yeonjami. The reducing power was also considerably higher in the leaves than in the petioles. Taking into consideration of DPPH radical scavenging activity and reducing power together, Poongwonmi had the highest antioxidant activity among six sweet potato varieties tested in this study. Further studies are needed to confirm antioxidant activity and functional properties of sweet potato leaves in biological systems.
Blanching effect
Sweet potato leaves are mostly prepared by thermal processing including conventional blanching and microwave blanching due to its toughness. The contents of phenolic acids, vitamin C, and DPPH radical scavenging activity were compared before and after cooking. The content of phenolic acids in raw and cooked leaves of sweet potato is presented in Table 4. Total contents of phenolic acids were 225.22 mg/100 g FW for conventionally blanched leaves and 154.46 mg/100 g FW for microwave blanched leaves, respectively. Both blanching treatments resulted in a significant decrease of total phenolic acids amount (63.8% in blanching and 78.1% in microwaving). This is contrary to the results of Sun et al. (2014), who demonstrated that microwaving did not cause a significant change of 5-chlorogenic acid in sweet potato leaves. The losses of individual phenolic acids were different, ranging from 20.9 to 100%. The decrease of phenolic acids in sweet potato leaves may be attributed to their leaching loss into cooking water. Irondi et al. (2017) reported that blanching of baobab leaves led to a significant loss in the content of phenolic acids. Furthermore, chlorogenic acid (91.88% loss) and gallic acid (86.51% loss) were mostly affected. These findings indicate that the composition of phenolic acids plays an important role in the retention of phenolic acids during blanching. Total amount of phenolic acids in cooked leaves and cooking water is shown in Fig. 2. Small amount of phenolic acids was found in cooking water that the leaves was conventionally blanched. However, phenolic acids were not observed in cooking water of microwave blanched leaves even though the cooking time was shorter than conventional blanching. This suggests that the studies of degradation kinetics are needed under different blanching methods.
Table 4.
Changes of phenolic acids, vitamin C, and DPPH scavenging activity in fresh and cooked sweet potato (Poongwonmi) leaves
| Compound | Before cooking | Conventional blanching | Microwave blanching | ||
|---|---|---|---|---|---|
| Amount | Loss (%) | Amount | Loss (%) | ||
| Phenolic acids (mg/100 g FW) | |||||
| ChA | 138.25 ± 7.24a | 31.54 ± 5.52b | 77.2 | 16.76 ± 4.90c | 87.9 |
| 4,5-diCQA | 101.13 ± 10.58a | 76.70 ± 12.70ab | 24.2 | 55.09 ± 19.84b | 45.5 |
| 3,5-diCQA | 421.16 ± 26.06a | 112.20 ± 26.96b | 73.4 | 82.61 ± 6.22b | 80.4 |
| 3,4-diCQA | 43.99 ± 2.50a | 34.78 ± 5.35b | 20.9 | N.D. | 100.0 |
| Sum1 | 704.52 ± 46.29a | 255.22 ± 48.92b | 63.8 | 154.46 ± 30.78c | 78.1 |
| Vitamin C (mg/100 g FW) | 71.69 ± 3.43 | N.D. | 100.0 | N.D. | 100.0 |
| DPPH radical scavenging activity (EC50, mg/mL) | 0.13 ± 0.00c | 0.34 ± 0.04b | 0.44 ± 0.03a | ||
ChA chlorogenic acid; 4,5-diCQA 4,5-dicaffeoylquinic acid; 3,5-diCQA 3,5-dicaffeoylquinic acid; 3,4-diCQA 3,4-dicaffeoylquinic acid. N.D. not detected, FW fresh weight
1Total amount of ChA, 4,5-diCQA, 3,5-diCQA, and 3,4-diCQA
a–dValues with different letters in a row are significantly different (P < 0.05). Each value is expressed as mean ± standard deviation (n = 3)
Fig. 2.
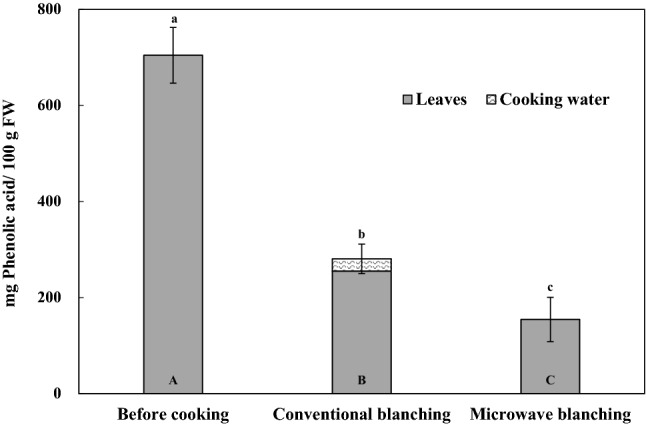
Effects of conventional blanching and microwave blanching on phenolic acids contents of sweet potato (Poongwonmi) leaves and cooking water. (A–C) Bar graphs with the same small letters are not significantly different in phenolic acid contents (P < 0.05). FW means fresh weight
The content of vitamin C was 71.69 mg/100 g FW in fresh leaves of sweet potato (Table 4). On the other hand, no ascorbic acid was found in cooked leaves, indicating that blanching causes a significant destruction of vitamin C in sweet potato leaves. Loss of ascorbic acid can be attributed to thermal breakdown and leaching during blanching. Gupta et al. (2008) found that retention of ascorbic acid in green leafy vegetables was reduced as blanching time and temperature increased. Zhang and Hamauzu (2004) demonstrated that ascorbic acid in broccoli florets was considerably lost during conventional and microwave cooking.
The DPPH radical scavenging activity significantly decreased after cooking. Zhang and Hamauzu (2004) reported that broccoli florets retained 35% of DPPH radical scavenging activity after thermal cooking such as boiling and microwaving for 5 min. On the contrary, Turkmen et al. (2005) demonstrated that DPPH radical scavenging activity in green vegetables including spinach and broccoli significantly increased after boiling (5 min) and microwaving (1–1.5 min). Meanwhile, Chu et al. (2000) reported that DPPH radical scavenging activity of potato leaves remained the same as fresh one after blanching for 2 min at 100 °C. This study shows that antioxidant content and activity in the leaves of sweet potato decreased by blanching, suggesting that antioxidants may be either decomposed or interact with other compounds during thermal processing.
Sweet potato leaves and petioles contain different antioxidant contents and activities depending on the variety. Of six cultivars studied, Poongwonmi had the highest content of phenolic acids and antioxidant activity. Interestingly, the leaves have a considerably higher antioxidant contents and activities than the petioles. The data can be used to develop an accurate database of antioxidants in the leaves and petioles of sweet potatoes that were newly developed. Further studies are needed to optimize the time and temperature of blanching that results in a minimal loss of antioxidants compared with the raw leaves of sweet potato.
Acknowledgements
The authors are grateful to the Bioenergy Crop Research Center, which provided the petioles and leaves of six sweet potato varieties. This work was supported by a research grant from Seoul Women’s University (2018).
References
- Chu YH, Chang CL, Hsu HF. Flavonoid content of several vegetables and their antioxidant activity. J. Sci. Food Agric. 2000;80:561–566. doi: 10.1002/(SICI)1097-0010(200004)80:5<561::AID-JSFA574>3.0.CO;2-#. [DOI] [Google Scholar]
- Food and Agriculture Organization of the United Nations (FAOSTAT). 2017. Sweet potato world production. Available from: http://www.fao.org/faostat/en/#data/QC. Accessed Sep. 20, 2017.
- Gupta S, Lakshmi AJ, Prakash J. Effect of different blanching treatments on ascorbic acid retention in green leafy vegetables. Nat. Prod. Rad. 2008;7(2):111–116. [Google Scholar]
- Hue SM, Boyce AN, Somasundram C. Antioxidant activity, phenolic, and flavonoid contents in the leaves of different varieties of sweet potato (Ipomoea batatas) Aust. J. Crop Sci. 2012;6:375–380. [Google Scholar]
- Irondi EA, Akintunde JK, Agboola SO, Boligon AA, Athayde ML. Blanching influences the phenolics composition, antioxidant activity, and inhibitory effect of Adansonia digitata leaves extract on α-amylase, α-glucosidase, and aldose reductase. Food Sci. Nutr. 2017;5(2):233–242. doi: 10.1002/fsn3.386. [DOI] [PMC free article] [PubMed] [Google Scholar]
- Ishida H, Suzuno H, Sugiyama N, Innami S, Tadokoro T. Maekawa. A Nutritive evaluation on chemical components of leaves, stalks, and stems of sweet potatoes (Ipomoea batatas poir) Food Chem. 2000;68:359–367. doi: 10.1016/S0308-8146(99)00206-X. [DOI] [Google Scholar]
- Islam MS, Yoshimoto M, Yamakawa O. Distribution and physiological functions of caffeoylquinic acid derivatives in leaves of sweet potato genotypes. J. Food Sci. 2003;68(1):111–116. doi: 10.1111/j.1365-2621.2003.tb14124.x. [DOI] [Google Scholar]
- Jung JK, Im HW. The total phenolic contents of Korean sweet potato according to physical characteristics and cooking methods. Foodservice Industry Journal. 2012;8(1):53–74. doi: 10.22509/kfsa.2012.8.1.003. [DOI] [Google Scholar]
- Jung, J.K., Leem S.U., Kozukue, N., Levin, C.E. and Friedman, M. 2011. Distribution of phenolic compounds and antioxidative activities in parts of sweet potato (Ipomea batatas L.) plants and in home processed roots. J. Food Comp. Anal.24: 29–37.
- Koh E, Charoenprasert S, Mitchell AE. Effect of organic and conventional cropping systems on ascorbic acid, vitamin C, flavonoids, nitrate, and oxalate in 27 varieties of spinach (Spinacia oleracea L.) J. Agri Food Chem. 2012;60:3144–3150. doi: 10.1021/jf300051f. [DOI] [PubMed] [Google Scholar]
- Korea Health Industry Development Institute (KHIDI). 2016. National Food & Nutrition Statistics 2014: based on 2014 Korea National and Nutrition Examination Survey. Korea Health Industry Development Institute, Osong, Korea, p.30.
- Li M, Jang GY, Lee SH, Woo KS, Sin HM, Kim HS, Lee J, Jeong HS. Chemical compositions and antioxidant activities of leaves and stalks from different sweet potato cultivars. J. Korean Soc. Food Sci. Nutr. 2012;41(12):1656–1662. doi: 10.3746/jkfn.2012.41.12.1656. [DOI] [Google Scholar]
- Liao WC, Lai YC, Yan MC, Hsu YL, Chan CF. Antioxidant activity of water extract of sweet potato leaves in Taiwan. Food Chem. 2011;127:1224–1228. doi: 10.1016/j.foodchem.2011.01.131. [DOI] [PubMed] [Google Scholar]
- Nur Alam Md Jahan Bristi N, Rafiquzzaman Md. Review on in vivo and in vitro methods evaluation of antioxidant activity. Saudi Pharm. J. 2013;21(2):143–152. doi: 10.1016/j.jsps.2012.05.002. [DOI] [PMC free article] [PubMed] [Google Scholar]
- Oyaizu M. Studies on products of browning reactions: antioxidative activities of products of browning reaction prepared from glucosamine. Jpn. J. Nutr. Diet. 1986;44:307–315. doi: 10.5264/eiyogakuzashi.44.307. [DOI] [Google Scholar]
- Ruiz-Ojeda LM, Peñas FJ. Comparison study of conventional hot-water and microwave blanching on quality of green beans. Innov. Food Sci. Emerg. Technol. 2013;20:191–197. doi: 10.1016/j.ifset.2013.09.009. [DOI] [Google Scholar]
- Rural Development Administration (RDA). 2011. Rural Development Administration Food Composition Table 8th ed. Gyomoon Press, Paju, Korea, pp.118–119.
- Singleton VL, Orthofer R, Lamuela-Raventos RM. Analysis of total phenols and other oxidation substrates and antioxidants by means of Folin-Ciocalteau reagent. Method Enzymol. 1999;299:152–178. doi: 10.1016/S0076-6879(99)99017-1. [DOI] [Google Scholar]
- Sun H, Mu T, Xi L, Song Z. Effects on domestic cooking methods on polyphenols and antioxidant activity of sweet potato leaves. J. Agric. Food Chem. 2014;62(36):8982–8989. doi: 10.1021/jf502328d. [DOI] [PubMed] [Google Scholar]
- Truong VD, McFeeters RF, Thompson RT, Dean LL, Shofran B. Phenolic acid content and composition in leaves and roots of common commercial sweet potato (Ipomea batatas L.) varieties in the United States. J. Food Sci. 2007;72:C343–C349. doi: 10.1111/j.1750-3841.2007.00415.x. [DOI] [PubMed] [Google Scholar]
- Turkmen N, Sari F, Velioglu S. The effect of cooking methods on total phenolics and antioxidant activity of selected green vegetables. Food Chem. 2005;93(4):713–718. doi: 10.1016/j.foodchem.2004.12.038. [DOI] [Google Scholar]
- Wu, X., Sun, C., Yang, C., Zeng, G., Liu, Z. and Li, Y. 2008. β-carotene content in sweet potato varieties from China and the effect of preparation on β-carotene retention in the Yanshu No. 5. Innov. Food Sci. Emerg. Technol.9: 581–586.
- Yoshinaga, M., Yamakawa, O. and Nakatani, M. 1999. Genotypic diversity of anthocyanin content and composition in purple-fleshed sweet potato (Ipomoea batatas (L.) Lam). Breed Sci.49: 43–47.
- Zhang D, Hamauzu Y. Phenolics, ascorbic acid, carotenoids and antioxidant activity of broccoli and their changes during conventional and microwave cooking. Food Chem. 2004;88:503–509. doi: 10.1016/j.foodchem.2004.01.065. [DOI] [Google Scholar]