

Abstract
The measurement of endothelial dysfunction (ED) has importance in that it indicates the presence of coronary artery disease (Kuvin et al. in J Am Coll Cardiol 38(7):1843–1849, 2001) in addition to acting as a predictor of future adverse events (Halcox et al. in Circulation 106:653–658, 2002). Various tools, methods, and metrics exist that can provide an indicator of endothelial dysfunction. Given the significance of ED, it is of utmost importance to find a measurement technique that is reliable, while defining a metric providing a framework for an overall system that is practical, accurate, and repeatable. Success would provide a tool for the early detection of cardiovascular disease not only moving patients that are currently classified as asymptomatic to symptomatic, but also providing a method to monitor the efficacy of treatments.
Keywords: Measurement, Endothelial dysfunction, Medical physics
Introduction
ED is defined as a condition in which the inner lining of the artery, the intima, does not function normally [3]. It can be quantified via measurement of arterial vasodilation in response to drug administration or other physiological stimuli that would normally result in increased arterial flow as a response to endothelium derived nitric oxide in a healthy individual.
Stimuli involved in endothelial dysfunction measurement include drug administration, cold pressor testing, and reactive hyperemia while associated metrics include thermal changes, cardiac output measurements, pulse wave velocity, flow mediated dilation, and changes in arterial compliance (Fig. 1). Genome analysis can also be used to detect endothelial dysfunction. Healthy endothelial function is associated with the measurement of increased arterial flow, increased arterial diameter, and increased arterial compliance following drug administration, reactive hyperemia, or cold pressor testing.
Fig. 1.

Physiological Response to Endothelial Dysfunction
Associated technologies used to perform these measurements include; duplex ultrasonography, arterial tonometry, plethysmography, electromagnetic flowmeter, intravascular ultrasound (IVUS), liquid metal/mercury strain gage (LMSG), magnetic resonance imaging, and genetic analysis. Only the most prominent of these technologies will be explored in later sections.
Measurement and stimuli
Drug administration
Various drug classifications exist that can have a significant effect on vasodilation and demonstrate improved endothelial function. Some of these include antihypertensive therapies (acetylcholine, adenosine 5′-diphosphate, and thrombin) [4–7], angiotensin converting enzyme inhibitors [8–11], and Substance P [12]. It has even been observed that Vitamin C stimulates a significant improvement in flow mediated dilation (FMD) measured endothelial dysfunction improvements [13]. These drugs result in arterial vasodilation in subjects with a healthy endothelium that are able to exhibit normal endothelial function.
Cold pressor
The cold pressor test takes place when a subject submerges their hand into a container of ice water resulting in sympathetic nervous system activated vasodilation [14]. The measured effect can be seen in both coronary arteries as well as in contralateral hand immersion where brachial artery measurements are performed. Both coronary artery and brachial artery vasoconstriction have been observed in patients with cardiovascular disease following cold pressor stimulation [15–18].
Reactive hyperemia
Reactive hyperemia is defined as an increase in blood flow that takes place after a brief period of ischemia (e.g. arterial occlusion) [19]. Reactive hyperemia experiments have been shown to have the following results [20]:
Increased arterial compliance
Increased arterial area
As a result of this increased arterial compliance and area, increased arterial flow also results.
The following factors can cause a reduction in smooth muscle activity and subsequent arterial vasodilation [21, 22]:
Increased carbon dioxide levels
Increased metabolic activity
Increased flow velocity stimulating the release of endothelium derived relaxing factors (EDRF) (e.g. nitric oxide and prostacyclin).
Measurement: technology platforms
Duplex ultrasonography
Duplex ultrasonography is defined as ultrasonography that combines standard B-mode ultrasonography with pulsed Doppler signals. In summary, B mode ultrasonography is brightness modulated display ultrasonography with imaging capability. As a result, duplex ultrasonography has the capability to provide images of cardiovascular structures and conduits in addition to blood flow [23].
Ultrasound imaging provides the dimensions of organs, vessels, and tissues in a variety of medical applications. There are two fundamental relationships in ultrasonic imaging. The first is:
| 1 |
where d is the distance of an object from the transducer, t is the round trip transit time from the transducer to the object, and c is the speed of sound in the medium. The relationship provides the distance that an object is from the transducer as a function of the transmission signal transit time and speed [24].
The second relationship in the frequency domain expresses the received signal strength, S(f), as a function of transmitted signal strength, T(f), transducer properties, B(f), strength of scatter, n(f), and the attenuation of the signal path to and from the source of scatter, A(f).
| 2 |
A 2D image of the artery can be found from the ultrasound signal. The diameter of the brachial artery can be obtained from this image.
Intravascular ultrasound (IVUS)
IVUS is B-mode ultrasonography that takes place via an ultrasound transducer placed at the tip of a catheter (Fig. 2) [25]. Although the general use of IVUS is in conjunction with an arterial angiography or stent placement to provide diagnostic information related to plaque distribution and composition, location of calcium, and lesion severity, it has been used to provide measurements of the metrics associated with endothelial dysfunction measurement.
Fig. 2.

Image of Intravascular Ultrasound (IVUS)
One possible use is via placement of an IVUS catheter into the brachial artery such that intra-arterial pressure, cross-sectional area, and wall thickness were obtained [26]. As a result, the following brachial artery metrics were calculated. The brachial artery cross-sectional compliance (C):
| 3 |
where P is transmural pressure, defined as mean arterial pressure minus external pressure applied by a cuff, and a, b, and c are parameters that characterize an arterial pressure-area curve via a model developed by Langewouters [27].
Additional cardiovascular metrics that can be obtained via IVUS include the incremental elastic modulus (Einc):
| 4 |
The dσ/dε is determined from changes in circumferential wall stress (σ):
| 5 |
where rm is midwall radius and h is wall thickness, and circumferential strain (ε) is:
| 6 |
where ro is the effective unstressed mid-wall radius (mid-wall radius at 0 transmural pressure). The pulse wave velocity (PWV) via the Moens–Kortoweg equation:
| 7 |
where d is blood density (1.055 g/ml) and ri is the inner radius of the artery. IVUS has the capability to provide important metrics associated with endothelial dysfunction measurement. However, IVUS is an invasive procedure and is only capable of providing information in the positive transmural pressure region of the artery [28]. Increased pulse wave velocity is an indicator of cardiovascular disease.
Transcutaneous brachial artery duplex ultrasonography
Ultrasound can also be used to obtain lumen measurements of peripheral arteries such as the brachial artery (Figs. 3, 4). Electrocardiogram recordings are simultaneously obtained and the images are consistently obtained at diastole and systole. The brachial artery is most often imaged at a location 3–7 cm above the antecubital crease and located via use of an ultrasound attenuator that can be taped to the subjects arm.
Fig. 3.
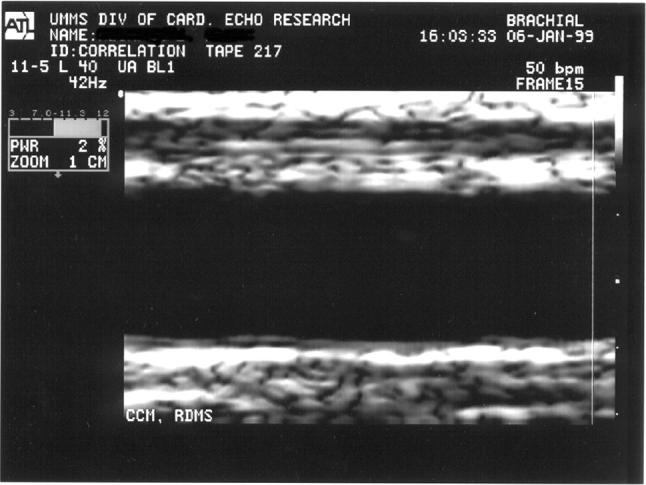
Ultrasound image: brachial artery (normal)
Fig. 4.
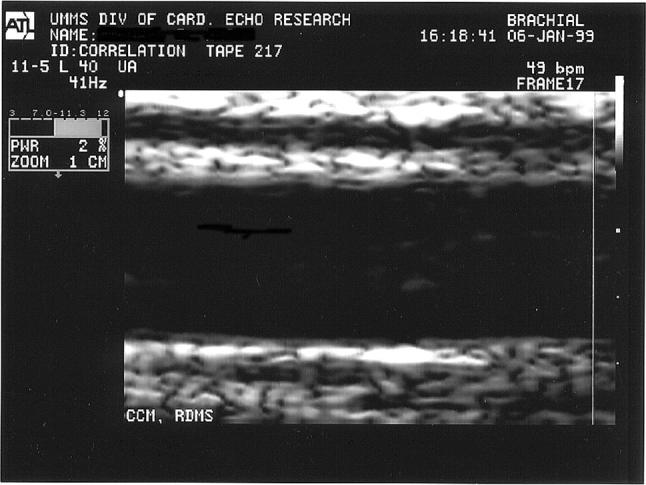
Ultrasound image: brachial artery (five minute hyperemia)
In addition to the subjective error that can take place as a result of edge detection, other sources of error could be introduced based on the quality of the blood vessel image definition. Image depth and gain settings must be properly adjusted by the ultrasonographer to best delineate the arterial wall [29].
In addition to providing brachial artery data measurements, this method has successfully provided measurements of aortic diameter and flow velocity via transducer placement at the suprasternal notch [30]. Both Doppler flow velocity and diameters at systole and diastole can be obtained via this method.
Magnetic resonance imaging and angiography
Magnetic resonance imaging (MRI) uses a magnetic field and radio wave energy pulse to provide images within the body. The images are generated using the concepts of nuclear magnetic resonance (NMR) physics where the ultimate image is derived from a signal generated via precession of protons [31].
Magnetic resonance angiography (MRA) provides arterial images in addition to blood flow information. In some cases, a contrast medium is used to improve the arterial image. MRA successfully provides images of both coronary and peripheral arteries [32, 33]. In each setup, the magnetic resonance system is used in conjunction with cardiac software, Food and Drug Administration (FDA) approved MRA sequence and receiver coil such as a cardiac synergy receiver coil or a standard flexible extremity coil. These images provide arterial compliance and flow measurements in addition to pulse wave velocity (PWV) and flow mediated dilation (FMD) of the imaged artery [34].
X-ray angiography
X-ray angiography provides arterial images via intra-arterial injection of a radiopaque dye [35]. Dimensional information including the metric intima-media thickness (Fig. 5) and FMD are obtained via this methodology. Digital imaging technologies replacement of film recording has optimized the use of angiography. Images of the brachial artery can be successfully obtained via intravenous digital angiography where a catheter is inserted into the right antecubital basilic vein and passed into the right atrium [36].
Fig. 5.

Carotid intima media-thickness (CIMT) image
Arterial tonometry
The arterial tonometer is a pressure pulse sensor that must be properly positioned over an artery (most often the radial artery) located near the skin surface. The sensor must not only be properly centered over the artery but also have the proper pressure applied to the artery. Comparisons to intra-arterial pressure measurements have shown average errors of − 5.6 mm Hg for systolic pressure and − 2.4 mm Hg for diastolic pressure [37]. Accurate placement of the sensor makes arterial tonometry very operator dependent in obtaining a high resolution pressure pulse. However, a flexible diaphragm tonometer can be used where proper positioning is easier and a lower resolution pressure pulse is obtained [38].
Studies have been performed that support the use of peripheral arterial tonometry (PAT) (Fig. 6) as a predictor of future cardiac events with mixed results [39–41]. Although there is a strong significant positive correlation between PAT and ultrasound arterial diameter and flow data while the subject is in a baseline condition, no correlation was observed between PAT data and ultrasound measured flow mediated dilation values when the subject underwent reactive hyperemia [42].
Fig. 6.
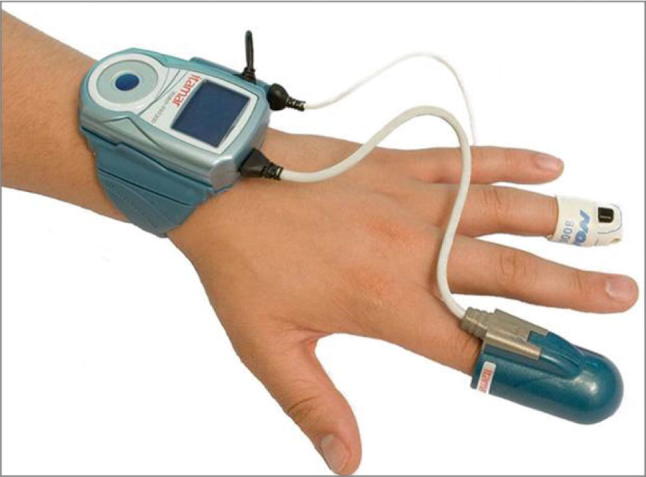
Peripheral arterial tonometer—Itamar Medical Ltd. (WatchPAT)
Measurement: thermal platforms
Thermodilution
The classical thermodilution methodology is an invasive method where cardiac output is measured. In summary, an indicator (which is usually cold saline) is injected into the right atrium and temperature in the pulmonary artery is recorded. The relationship between temperature change and cardiac output (CO) is [43]:
| 8 |
where
V = volume of indicator injected in ml;
Tb = temperature average of pulmonary artery blood in degrees Celsius;
Ti = temperature of the indicator;
60 = multiplier required to convert ml/s to ml/min;
A = area under the dilution curve in seconds x degrees Celsius;
S = specific gravity of indicator (i) and blood (b);
C = specific heat of indicator (i) and blood (b); and
F = empiric correction factor for heat transfer through injection catheter.
Although thermodilution is a classical method for cardiac output measurement, errors can be introduced into the measurement as a result of heat loss through the catheter wall, respiration, choice of heat transfer medium, and other environmental factors.
Digital thermal monitoring
Digital thermal monitoring uses two fingertip RTD (resistance temperature detector) probes placed on the index finger of both hands (Fig. 7) [44]. In two minute hyperemia experiments, it was observed that metrics defined as temperature rebound (TR) and area under the curve (TMP AUC) correlated closely to Doppler ultrasound measured flow velocity. The metrics are defined as:
| 9 |
where
TMPmax is the maximum temperature observed at the RTD following the two minute reactive hyperemia occlusion;
TMPi is the initial temperature observed at the RTD prior to the two minute hyperemia occlusion; and
TMP AUC is defined as the area under the curve post occlusion where the y-axis is temperature and the x-axis is time.
However, the metrics must be adjusted to account for environment and patient factors including; room temperature, wind/air speed, patient finger size, estimated finger thermal properties, and estimated arteriovenous temperature drop. A lumped capacity energy balance modeling estimated conduction, convection, and evaporative losses of a finger are a part of the solution [45].
Fig. 7.

Digital thermal monitoring—Endothelix Inc. (VENDYS)
Measurement: volumetric platforms
Plethysmography
Plethysmography is defined as a technique that measures the volume changes in an organ, limb, or the body through the measurement of blood flow [46]. Within the classification of plethysmography, various modalities exist including ocular plethysmography which is a noninvasive method for measuring blood flow via the ophthalmic artery to the brain. This measurement takes place via placement of suction cups on the eyes that measure ocular pressure. However, in this section only those modalities that are deemed to provide a practical method for endothelial dysfunction measurement and presence of cardiovascular disease will be discussed.
Arterial plethysmography is a manometric test used to determine if an occlusion exists in either the upper or lower extremities. If measured systolic blood pressure differs by more than 20 mm Hg, between the upper and lower extremities, an arterial blockage is deemed present [47].
A photoplethysmograph requires two items, a light source and a photodetector, and records blood volume changes through physiological tissues and vessels noninvasively at the skin surface [48]. The physiological area of measurement is determined by the optical probe design light intensity and operating wavelength [49]. As the light source illuminates the tissue, the photodetector records the changes in light intensity that correlate with volume changes in the area of measurement [50].
Two photoplethysmograph frameworks exist; the transmission (‘trans-illumination’) method where the light source and photodetector are on opposite sides of the sample and reflection (‘adjacent’) mode where the light source and photodetector are on the same side of the sample. The primary sources of error in photoplethysmography are movement as the probe-tissue interface and ambient light in addition to concerns with reproducibility caused by these factors in addition to subject posture, respiration, and degree of calmness [51–53]. Although the signals obtained have a direct correlation with blood volume changes, the signals have not been successfully calibrated to provide actual volume magnitudes [54].
Some of the clinical metrics obtained via photoplethysmography include: arterial oxygen saturation and heart rate via pulse oximetry [55] in addition to blood pressure. Although there are some issues with accuracy at low arterial saturation levels [56] as well as unreliability issues in obtaining ankle brachial pulse indices to assess peripheral vascular disease using photoplethysmography [57–59] However, there have been algorithms where frequency analysis and pulse frequency characterization have detected a high degree of patients with peripheral stenosis and occlusions [60–64].
The segmental plethysmograph is a technique through which oscillometric volume pulses are obtained. Limb volumetric changes are directly correlated to pressure or diaphragm displacement via the mathematical relationship [65];
| 10 |
where A is the diaphragm cross-sectional area, d is the diaphragm displacement, k is the constant that changes as a function of system volume, and dV equals limb volumetric displacement.
Limb volumetric displacement can be accurately and non-invasively obtained if k can be solved for at all system conditions. This concept provides a fundamental through which arterial compliance and thus degree of endothelial dysfunction can be noninvasively and accurately determined (Fig. 8).
Fig. 8.
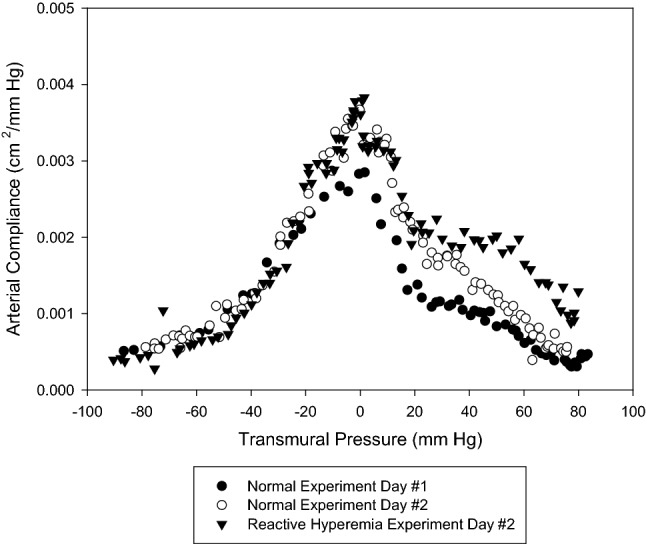
Arterial compliance measurement—normal versus reactive hyperemia
Measurement: genetic platform
Genome analysis
Genome analysis may provide a method for detection of endothelial function in the future. Genetic polymorphisms can be used to identify the presence of coronary endothelial dysfunction [66, 67]. Polymerase chain reaction (PCR) is a technique that can be used to identify the DNA sequences via the PCR DNA sequence amplification process. In summary, the target DNA is denatured at a high temperature, cooled to permit annealing of primers to their sites, and temperature is readjusted to permit synthesis [68]. Analysis could be performed via a standard PCR unit which is a large device. The more portable Open PCR units are still evolving in the marketplace and only a few companies manufacture these devices.
Measurement: metrics
Endothelial dysfunction metrics
The following metrics can be used to identify endothelial dysfunction:
Flow mediated dilation (FMD) following hyperemia. Defined as increased arterial blood flow, arterial compliance, and arterial area following reactive hyperemia or cold pressor testing. Ultrasound is the tool most often associated with these measurements. However, plethysmography is also used in some cases; and
Pulse wave velocity (PWV) calculated using the Moens–Kortoweg equation (Eq. 7) [69].
Following reactive hyperemia or cold pressor testing, PWV has a measureable decrease for patients without endothelial dysfunction. Ultrasound is most commonly used to provide this measurement.
Conclusion
The measurement of endothelial dysfunction (ED) has clinical importance in that ED is an independent predictor of future cardiovascular adverse events [70]. Many of the tools discussed have application issues that include practicality of use, accuracy, degree of invasiveness, etc. However, a diagnostic method based on the fundamentals of segmental plethysmography would provide a tool that would not only be non-invasive but accurate. Such a tool would have the greatest potential to have an impact on cardiovascular disease via early detection and a practical method for monitoring efficacy of treatments. The authors are currently developing such a tool and details will be reported in the literature in the near future.
Conflict of interest
The authors declare that they have no conflict of interest.
Human and animal rights
This article does not contain any studies with human participants performed by any of the authors.
Informed consent
Not applicable.
Contributor Information
Michael D. Whitt, Email: mdwhitt@calpoly.edu
Mark J. Jackson, Email: mjjackson@ksu.edu
References
- 1.Kuvin JT, et al. Peripheral vascular endothelial function testing as a noninvasive indicator of coronary artery disease. J Am Coll Cardiol. 2001;38(7):1843–1849. doi: 10.1016/S0735-1097(01)01657-6. [DOI] [PubMed] [Google Scholar]
- 2.Halcox JP, et al. Prognostic value of coronary vascular endothelial dysfunction. Circulation. 2002;106:653–658. doi: 10.1161/01.CIR.0000025404.78001.D8. [DOI] [PubMed] [Google Scholar]
- 3.Cooke J. Endothelial function and peripheral vascular disease. In: Spittell J, editor. Contemporary issues in peripheral vascular disease. Philadelphia: FA Davis; 1992. pp. 1–17. [Google Scholar]
- 4.Furchgott RF, et al. The obligatory role of endothelial cells in the relaxation of arterial smooth muscle by acetylcholine. Nature. 1980;288:373–376. doi: 10.1038/288373a0. [DOI] [PubMed] [Google Scholar]
- 5.Luscher TF, et al. Endothelium-dependent relaxations in human arteries. Mayo Clin Proc. 1987;62:601–606. doi: 10.1016/S0025-6196(12)62299-X. [DOI] [PubMed] [Google Scholar]
- 6.Tschudi MR, et al. Antihypertensive therapy augments endothelium-dependent relaxations in coronary arteries of spontaneously hypertensive rats. Circulation. 1994;89:2212–2218. doi: 10.1161/01.CIR.89.5.2212. [DOI] [PubMed] [Google Scholar]
- 7.Luscher TF, et al. Antihypertensive treatment normalizes decreased endothelium dependent relaxations in rats with salt-induced hypertension. Hyperension. 1987;9(Supp III):III-193–III-197. doi: 10.1161/01.hyp.9.6_pt_2.iii193. [DOI] [PubMed] [Google Scholar]
- 8.Palmer RMJ, et al. Nitric oxide release accounts for the biological activity of endothelium-derived relaxing factor. Nature. 1987;327(11):524–526. doi: 10.1038/327524a0. [DOI] [PubMed] [Google Scholar]
- 9.Takase H, et al. Antihypertensive therapy prevents endothelial dysfunction in chronic nitric oxide deficiency. Hypertension. 1996;27:25–31. doi: 10.1161/01.HYP.27.1.25. [DOI] [PubMed] [Google Scholar]
- 10.Clozel M, et al. Effects of angiotensin converting enzyme inhibitors and of hydralazine on endothelial function in hypertensive rats. Hypertension. 1990;16:532–540. doi: 10.1161/01.HYP.16.5.532. [DOI] [PubMed] [Google Scholar]
- 11.D’Uscio L, et al. Losartan by not verapamil inhibits angiotensin II—induced tissue endothelin-1 increase: role of blood pressure and endothelial function. Hypertension. 1998;31:1305–1310. doi: 10.1161/01.HYP.31.6.1305. [DOI] [PubMed] [Google Scholar]
- 12.Cocks TM, et al. Endothelium-dependent relaxation of coronary arteries by noradrenaline and serotonin. Nature. 1983;305(13):627–630. doi: 10.1038/305627a0. [DOI] [PubMed] [Google Scholar]
- 13.Hornig B, et al. Vitamin C improves endothelial function of conduit arteries in patients with chronic heart failure. Circulation. 1998;97:363–368. doi: 10.1161/01.CIR.97.4.363. [DOI] [PubMed] [Google Scholar]
- 14.Lefleche AB, et al. Arterial response during cold pressor test in borderline hypertension. Am J Physiol Heart Circ Physiol. 1998;275:H409–H415. doi: 10.1152/ajpheart.1998.275.2.H409. [DOI] [PubMed] [Google Scholar]
- 15.Corretti MC, et al. Correlation of cold pressor and flow-mediated brachial artery diameter responses with the presence of coronary artery disease. Am J Cardiol. 1995;75:783–787. doi: 10.1016/S0002-9149(99)80411-1. [DOI] [PubMed] [Google Scholar]
- 16.Nabel EG, et al. Dilation of normal and constriction of artherosclerotic coronary arteries caused by cold pressor test. Circulation. 1988;77:43–52. doi: 10.1161/01.CIR.77.1.43. [DOI] [PubMed] [Google Scholar]
- 17.Zeither AM, et al. Modulation of coronary vasomotor tone in humans. Progressive endothelial dysfunction with different early stages of coronary atherosclerosis. Circulation. 1991;83:391–401. doi: 10.1161/01.CIR.83.2.391. [DOI] [PubMed] [Google Scholar]
- 18.Nitenberg A, et al. Epicardial coronary artery constriction to cold pressor test is predictive of cardiovascular events in hypertensive patients with angiographically normal coronary arterie and without other major coronary risk factor. Artherosclerosis. 2004;173:115–123. doi: 10.1016/j.atherosclerosis.2003.12.030. [DOI] [PubMed] [Google Scholar]
- 19.Klabunde RE. Cardiovascular physiology concepts. Philadeiphia: Lippincott, Williams and Wilkins; 2012. [Google Scholar]
- 20.Whitt M. Noninvasive determination of peripheral arterial lumen area, New Jersey: Rutgers University/University of Medicine and Dentistry of New Jersey; 1999. [Google Scholar]
- 21.Rockson SG, et al. Peripheral arterial insufficiency mechanisms, natural history, and therapeutic options. Adv Intern Med. 1998;42:253–277. [PubMed] [Google Scholar]
- 22.Ganong WF. Review of medical physiology. 15. Norwalk: Appleton and Lange; 1992. [Google Scholar]
- 23.Segen JC. Concise dictionary of modern medicine. New York: McGraw-Hill; 2002. [Google Scholar]
- 24.Mottley JG. Ultrasonic imaging. In: Bronzino JD, editor. The biomedical engineering handbook. Boca Raton: CRC Press; 1995. pp. 1093–1098. [Google Scholar]
- 25.Nishimura RA. Intravascular ultrasound imaging: in vitro validation and pathologic correlation. J Am Coll Cardiol. 1990;16:145–154. doi: 10.1016/0735-1097(90)90472-2. [DOI] [PubMed] [Google Scholar]
- 26.Bank AJ, et al. Direct effects of smooth muscle relaxation and contraction on in vivo human brachial artery elastic properties. Circ Res. 1995;77(5):1008–1016. doi: 10.1161/01.RES.77.5.1008. [DOI] [PubMed] [Google Scholar]
- 27.Langewouters GJ, et al. The static elastic properties of 15 human thoracic and 20 abdominal aortas in vitro and the parameters of a new model. J Biomech. 1984;17:425–435. doi: 10.1016/0021-9290(84)90034-4. [DOI] [PubMed] [Google Scholar]
- 28.Bank AJ, et al. Contribution of collagen, elastin, and smooth muscle to in vivo human brachial artery wall stress and elastic modulus. Circulation. 1996;94(12):3263–3270. doi: 10.1161/01.CIR.94.12.3263. [DOI] [PubMed] [Google Scholar]
- 29.Sussenbacher A, et al. Comparison of brachial artery wall thickness versus endothelial function to predict late cardiovascular events in patients undergoing elective coronary angiography. Am J Cardiol. 2013;111:671–675. doi: 10.1016/j.amjcard.2012.11.020. [DOI] [PubMed] [Google Scholar]
- 30.Mackay RS, et al. Non-invasive cardiac output measurement. Microvasc Res. 1972;4:438–452. doi: 10.1016/0026-2862(72)90075-1. [DOI] [PubMed] [Google Scholar]
- 31.Connolly S et al. In: Bronzino JD, editor in chief. The biomedical engineering handbook. Boca Raton: CRC Press. 1995. p. 1093–1098.
- 32.Klocke FJ. Epicardial coronary artery vasomotion. J Am Coll Cardiol. 2010;56(20):1666–1667. doi: 10.1016/j.jacc.2010.05.048. [DOI] [PubMed] [Google Scholar]
- 33.Greil GF, et al. Coronary magnetic resonance angiography in adolescents and young adults in Kawasaki disease. J Am Heart Assoc. 2002;105(8):908–911. doi: 10.1161/hc0802.105563. [DOI] [PubMed] [Google Scholar]
- 34.Weismann F. Global impairment of brachial, carotid, and aortic vascular function in young smokers. J Am Coll Cardiol. 2004;44(10):2056–2064. doi: 10.1016/j.jacc.2004.08.033. [DOI] [PubMed] [Google Scholar]
- 35.Shroy RE, et al. X-ray. In: Bronzino JD, et al., editors. The biomedical engineering handbook. Boca Raton: CRC Press; 1995. pp. 1093–1098. [Google Scholar]
- 36.Hofammann KE, et al. Brachial artery disruption following closed posterior elbow dislocation in a child—assessment with intravenous digital angiography. Clin Orthop Relat Res. 1984;184:145–149. [PubMed] [Google Scholar]
- 37.Drzewiecki G. Noninvasive assessment of arterial blood pressure and mechanics. In: Bronzino JD, editor. The biomedical engineering handbook. Boca Raton: CRC Press; 1995. pp. 1093–1098. [Google Scholar]
- 38.Bansal V et al. Design of a flexible diphraghm tonometer. In: Thirteenth Southern Biomedical Engineering Conference; 1994. p. 148–151.
- 39.Matsue Y. Endothelial dysfunction measured by peripheral arterial tonometry predicts prognosis in patients with heart failure with preserved ejection fraction. Int J Cardiol. 2012;59(13):E1014. doi: 10.1016/j.ijcard.2012.09.021. [DOI] [PubMed] [Google Scholar]
- 40.Ruggiero D, et al. Endothelial dysfunction in type 2 diabetic patients with normal coronary arteries. A peripheral arterial tonometry study. Monaldi Arch Chest Dis. 2012;78(1):34–39. doi: 10.4081/monaldi.2012.142. [DOI] [PubMed] [Google Scholar]
- 41.Espinoza F, et al. Assessment of arterial damage by noninvasive peripheral arterial tonometry in non-diabetic hemodialysis patients. Rev Med Chil. 2012;140(2):153–160. doi: 10.4067/S0034-98872012000200002. [DOI] [PubMed] [Google Scholar]
- 42.Lee CR, et al. Relation between digital peripheral arterial tonometry and brachial artery ultrasound measures of vascular function in patients with coronary artery disease and in healthy volunteers. Am J Cardiol. 2012;109:651–657. doi: 10.1016/j.amjcard.2011.10.023. [DOI] [PMC free article] [PubMed] [Google Scholar]
- 43.Geddes L. Cardiac output measurement. In: Bronzino JD, editor. The biomedical engineering handbook. Boca Raton: CRC Press; 1995. pp. 1093–1098. [Google Scholar]
- 44.Ahmadi N, et al. Reproducibility and variability of digital thermal monitoring of vascular reactivity. Clin Physiol Funct Imaging. 2011;31:422–428. doi: 10.1111/j.1475-097X.2011.01037.x. [DOI] [PubMed] [Google Scholar]
- 45.Ahmadi N, et al. Low fingertip temperature rebound measured by digital thermal monitoring strongly correlates with the presence and extent of coronary artery disease diagnosed by 64-slice multi-detector computed tomography. Int J Cardiovasc Imaging. 2009;25:725–738. doi: 10.1007/s10554-009-9476-8. [DOI] [PMC free article] [PubMed] [Google Scholar]
- 46.Ganong WF. Review of medical physiology. 15. Norwalk, CT: Appleton and Lange; 1991. [Google Scholar]
- 47.Merriam-Webster, Inc. Merriam-Webster’s medical desk dictionary. Springfield, MA: Merriam-Webster Inc.; 1993. [Google Scholar]
- 48.Allen J. Photoplethysmography and its application in clinical physiological measurement. Physiol Meas. 2007;28:R1–R39. doi: 10.1088/0967-3334/28/3/R01. [DOI] [PubMed] [Google Scholar]
- 49.Murray A. Optical assessment of recovery of tissue blood supply after removal of externally applied pressure. Med Biol Eng Comput. 1997;35:425–427. doi: 10.1007/BF02534102. [DOI] [PubMed] [Google Scholar]
- 50.Challoner AVJ. Photoelectric plethysmography for estimating blood flow. In: Rolfe P, editor. Non-invasive physiological measurements. London: Academic Press; 1979. pp. 125–151. [Google Scholar]
- 51.Webster JG. Design of pulse oximeters, bristol. Bristol: Institute of Physics Building, University of Bristol; 1997. [Google Scholar]
- 52.Hannowell L, et al. Ambient light affects pulse oximeters. Anesthesiology. 1987;67:864–865. doi: 10.1097/00000542-198711000-00057. [DOI] [PubMed] [Google Scholar]
- 53.Teng, et al. The effect of applied sensor contact force on pulse transit time. Physiol Meas. 2006;27:675–684. doi: 10.1088/0967-3334/27/8/002. [DOI] [PubMed] [Google Scholar]
- 54.Hertzmann AB, et al. The blood supply of various skin areas as estimated by the photoelectric plethysmograph. Am J Physiol. 1938;124:328–340. doi: 10.1152/ajplegacy.1938.124.2.328. [DOI] [Google Scholar]
- 55.Aoyagi T, et al. Pulse oximetry: its invention, contribution to medicine, and future tasks. Anesth Analg. 2002;94(Suppl 1):51–53. [PubMed] [Google Scholar]
- 56.Kyriacou PA, et al. Pulse oximetry in the oesophagus. Physiol Meas. 2006;27:R1–R35. doi: 10.1088/0967-3334/27/1/R01. [DOI] [PubMed] [Google Scholar]
- 57.Jonsson B, et al. A new probe for ankle systolic pressure measurement using photoplethysmography (PPG) Ann Biomed Eng. 2005;33:232–239. doi: 10.1007/s10439-005-8982-7. [DOI] [PubMed] [Google Scholar]
- 58.Goldman JM. Masimo signal extraction pulse oximetry. J Clin Monit Comput. 2000;16:475–483. doi: 10.1023/A:1011493521730. [DOI] [PubMed] [Google Scholar]
- 59.Hayes J, et al. A new method for pulse oximetry processing inherent insensitivity to artifact. IEEE Trans BME. 2001;48:452–461. doi: 10.1109/10.915711. [DOI] [PubMed] [Google Scholar]
- 60.Oliva I, et al. Fourier analysis of the pulse wave in obliterating arteriosclerosis. VASA. 1976;5:95–100. [PubMed] [Google Scholar]
- 61.Sherebrin MH, et al. Frequency analysis of the peripheral pulse wave detected in the finger with a photoplethysmograph. IEEE Trans BME. 1990;37:313–317. doi: 10.1109/10.52332. [DOI] [PubMed] [Google Scholar]
- 62.Grohmann G, et al. NIR-photoplethysmography—a noninvasive method for the early diagnosis and control of circulation parameters in peripheral vascular diseases. 1. Theory and technical devices. Perfusion. 1996;9:268–277. [Google Scholar]
- 63.Grohmann G, et al. NIR-photoplethysmography—a noninvasive method for the early diagnosis and control of circulation parameters in peripheral vascular diseases. 2. Bedside measurements. Perfusion. 1996;9:300–310. [Google Scholar]
- 64.Oliva I, et al. Toe pulse wave analysis in obliterating artherosclerosis. Angiology. 1983;34:610–619. doi: 10.1177/000331978303400906. [DOI] [PubMed] [Google Scholar]
- 65.Winsor J. The segmental plethysmograph. A description of the instrument. Angiology. 1957;8:87–101. doi: 10.1177/000331975700800109. [DOI] [PubMed] [Google Scholar]
- 66.Deanfield J et. al. (2005) Endothelial function and dysfunction. Part I: methodological issues for assessment in the different vascular beds: a statement by the Working Group on Endothelin and Endothelial Factors of the European Society of Hypertension, Vol. 23, p. 7–17. [DOI] [PubMed]
- 67.Hermann M, et al. CYP4A11 polymorphism correlates with coronary endothelial dysfunction in patients with coronary artery disease—the ENCORE trials. Artherosclerosis. 2009;207:476–479. doi: 10.1016/j.atherosclerosis.2009.06.009. [DOI] [PubMed] [Google Scholar]
- 68.Kaiser R. Tools for genome analysis. In: Bronzino JD, editor. The biomedical engineering handbook. Boca Raton: CRC Press; 1995. pp. 1093–1098. [Google Scholar]
- 69.Nichols WW, et al. McDonald’s blood flow in arteries: theoretical, experimental, and clinical properties. 3. Philadelphia: Lea and Febiger; 1990. [Google Scholar]
- 70.Rubinshtein R, et al. Assessment of endothelial function by non-invasive peripheral arterial tonometry predicts late cardiovascular adverse events. Eur Heart J. 2010;31:1142–1148. doi: 10.1093/eurheartj/ehq010. [DOI] [PubMed] [Google Scholar]