Abstract
By taking advantage of the self-polymerization of dopamine on the surface of magnetic nanospheres in weak alkaline Tris-HCl buffer solution, a facile approach was established to fabricate core-shell magnetic molecularly imprinted nanospheres towards hypericin (Fe3O4@PDA/Hyp NSs), via a surface molecular imprinting technique. The Fe3O4@PDA/Hyp NSs were characterized by FTIR, TEM, DLS, and BET methods, respectively. The reaction conditions for adsorption capacity and selectivity towards hypericin were optimized, and the Fe3O4@PDA/Hyp NSs synthesized under the optimized conditions showed a high adsorption capacity (Q = 18.28 mg/g) towards hypericin. The selectivity factors of Fe3O4@PDA/Hyp NSs were about 1.92 and 3.55 towards protohypericin and emodin, respectively. In addition, the approach established in this work showed good reproducibility for fabrication of Fe3O4@PDA/Hyp.
Keywords: surface molecular imprinting, hypericin, magnetic nanospheres, dopamine, core-shell
1. Introduction
Hypericin (Hyp) is one of the principal bioactive components of the St. John’s Wort plant (Hypericum perforatum). Traditionally used as anti-bacterial, anti-inflammatory, anti-depressive, and anti-virus agents, hypericin has gained increasing interest recently due to its potential as a highly effective anti-tumor photosensitizer [1]. Though hypericin can be obtained via chemical synthesis [2], extraction from the plant itself is still an indispensable supply pathway. However, hypericin exists in a very low concentration with structural similar analogs (such as pseudohypericin) in the plant [3]. This, together with its poor solubility and degradation upon exposure to heat and light, leaves its enrichment and purification from the plant a great challenge. This greatly inhibits the wide applications of hypericin in pharmaceutical fields. Establishing a facile method for producing efficient separation sorbents with high specificity and adsorption capacity towards hypericin is of significance and much desired [4].
Molecular imprinting [5,6] is a well-known modern technology for the production of nanostructured materials capable of molecular recognition, with high selectivity and good chemical stability at a low cost. Surface molecularly imprinted polymers (SMIPs) [7,8] are synthesized by allowing polymerization to take place on substrate surface, in order to create recognition sites on/near the material surface. These recognition sites, alongside the MIPs advantages mentioned above, provide faster rebinding kinetics for the target molecules, and are effective for the separation and enrichment of natural bio-compounds, making this an attractive solution to the challenge [9]. A variety of materials, including graphene [10], carbon nanotubes [11], silicon [12], silica particles [13], magnetic nanoparticles [14,15], inorganic material, and chips [16], have been used as substrates for construction of SMIPs. Among these, magnetic nanospheres (MNSs) are one of the most popular substrates for the synthesis of core-shell structured SMIPs [17]. Besides possessing advantages, such as high surface-to-volume ratio, low cost, regular shape with controllable size, and good mechanical stability, more significantly, their superparamagnetic property endows the final SMIPs facile magnetic response separation. This translates to potential applications in bio-imaging, drug delivery and therapeutics where the template is a drug [18], such as hypericin. However, to the best of our knowledge, at present there are no reports of core-shell structured SMIP nanospheres based on MNSs for specific recognition of hypericin.
Traditionally, the MIP layer (shell) around MNS (core) is formed by self-assembly of functional monomers and templates, followed by copolymerization with cross-linkers. The copolymerization is normally initiated by heat or UV light, and performed in organic solvents, with the process extending over a prolonged period of time (overnight or longer) [19]. Considering the increasing likelihood of hypericin to degrade during exposure to heat/light, it is obvious that the traditional procedure is not suitable for fabricating SMIPs for hypericin. Contrarily, dopamine can be oxidized and spontaneously self-polymerize, with oxygen as the oxidant under weak alkaline solution to yield polydopamine (PDA) [20]. Though the molecular mechanism behind the formation of PDA is complicated and not well-understood, the self-polymerization of dopamine is very mild and the cross-linked PDA network can adhere to virtually any type of material surfaces. These unique features make dopamine a promising functional monomer for fabrication of core-shell structured SMIP nanoparticles without a cross-linker (also called bi- or multi-functional comonomer), which is generally required. In fact, a few SMIP nanoparticles that were successfully prepared using dopamine as a monomer have been reported [14,21], including Fe3O4@PDA NPs as a stationary phase for recognition of OT-CEC [15] and SiO2@PDA nanoparticles for protein recognition and separation [13].
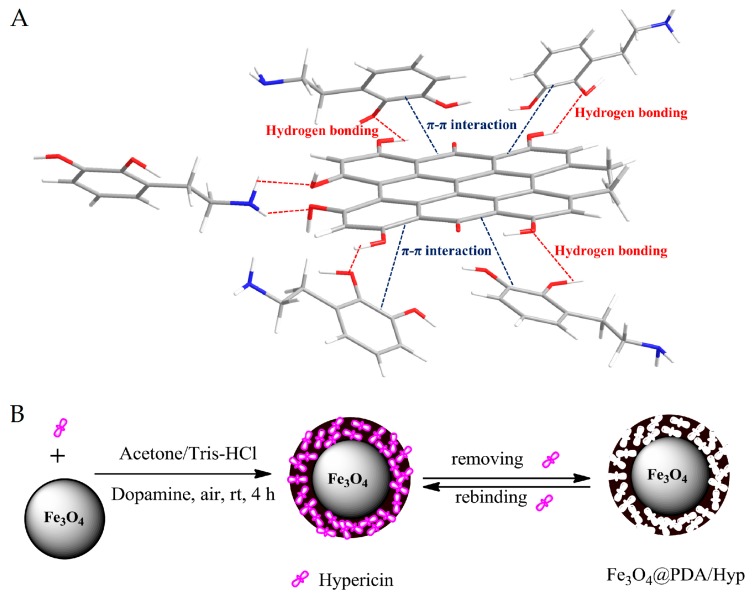
Inspired by the above-mentioned works, we envisioned that self-polymerization of dopamine on the surface of MNSs would provide a facile approach for fabrication of core-shell structured magnetic molecularly imprinted nanospheres for selective recognition of hypericin (Fe3O4@PDA/Hyp NSs). Herein, we investigated the feasibility for fabrication of Fe3O4@PDA/Hyp NSs by using dopamine as the only functional monomer. As depicted in Scheme 1, MNSs suspended in weak alkaline Tris-HCl buffer solution was first mixed with a solution of hypericin in acetone, followed by the addition of dopamine. Dopamine self-polymerized on the surface of MNSs in the air to form a thin layer of PDA within which hypericin molecules were embedded via non-covalent hydrogen bonding and π–π interactions. Removal of hypericin from the PDA layer leaves the recognition sites behind, and Fe3O4@PDA/Hyp NSs were thus obtained. The recognition properties of so-prepared Fe3O4@PDA/Hyp NSs toward hypericin were then evaluated and screened by varying reaction conditions.
Scheme 1.
(A) Illustration of noncovalent bonding of template, hypericin with the functional monomer, dopamine: hydrogen bonding and π−π interaction; (B) Schematic illustration of fabricating Fe3O4@PDA/Hyp.
2. Experimental Section
2.1. Chemicals and Instrumentation
Dopamine hydrochloride (DA, 98%), polyethylene glycol 1000 (PEG 1000), and ethanolamine were purchased from Aladdin, Shanghai, China. FeCl3·6H2O, ammonium hydroxide (28%), and ethylene glycol were purchased from Xilong Chemical Industry, Sichuan, China. Emodin was purchased from Xi’an Tianfeng Biological Technology Co., Ltd. (Xi’an, China) Acetone was purchased from Rionlon Bohua Pharmaceutical & Chemical Co., Tianjin, China. Anhydrous sodium acetate was purchased from Tianjin Bodi Chemical Industry Co., Ltd., Tianjin, China. Protohypericin (Protohyp) and hypericin (Hyp) were synthesized according to the procedures developed in our lab [22], and characterized by 1H-NMR (See Figures S1–S3).
NMR spectra were recorded on a Bruker 500 MHz Spectrometer (Bruker, Fällanden, Switzerland) with working frequencies of 500 MHz for 1H in DMSO-d6 or MeOD-d4. The residual signals from DMSO-d6 (1H: δ 2.50 ppm), or MeOD-d4 (1H: δ 3.31 ppm) were used as internal standards. Transmission Electron Microscope (TEM) images were taken by an H-600 instrument (Hitachi Ltd., Tokyo, Japan, 80 kV). The samples were prepared by dropping a droplet of the sample solution onto a TEM grid (copper grid, 300 meshes, coated with carbon film). Dynamic light scattering (DLS) measurements were performed on a DelsaTM Nano system (Beckman Coulter, Brea, CA, USA). UV-Vis spectra were recorded with Shimadzu 1750 UV-Visible spectrophotometer (Shimadzu, Tokyo, Japan) at 298 K. The surface area and the porosity of the prepared NSs were measured by nitrogen physisorption (Autosorb-iQ, Quantachrome, Boynton Beach, FL, USA), based on the Brunauer–Emmet–Teller (BET) method (ASAP 2020, Micromeritics Inc., Norcross, GA, USA). Samples were vacuum-degassed at 50 °C for 9 h before the adsorption experiments.
2.2. Preparation of Fe3O4 Magnetic Nanospheres (MNSs)
The MNSs were synthesized through the solvothermal approach according to the literature [23]. Briefly, 1.68 g FeCl3·6H2O was dissolved in 50 mL ethylene glycol with vigorous stirring until the solid was dissolved, then 4.5 g anhydrous sodium acetate and 1.25 g PEG were added to the solution, with continuous stirring for one hour. The resultant mixture was transferred into a Teflon-lined stainless steel autoclave (with a volume of 100 mL) and placed in an oven at 200 °C for 10 h, then cooled to room temperature. The obtained precipitate was washed with ethanol and deionized water several times and collected by magnet. The final product was dispersed in ethanol for further use.
2.3. Preparation of Hypericin-Imprinted Nanospheres (Fe3O4@PDA/Hyp) and Non-Imprinted Nanospheres (Fe3O4@PDA)
A typical procedure for preparation of Fe3O4@PDA/Hyp NSs was as following: 25 mg MNSs were dispersed in 10 mM Tris-HCl solution (pH = 8.0 unless specified) by ultrasonication for 10 min. Then hypericin dissolved in acetone was added to the suspension by mechanically stirring for 10 min, followed by the addition of dopamine. The mixture was stirred under air with a mechanical stirrer for 4 h. The solid was collected by magnetic separation and washed first with ultrapure water several times, then alternately with an acetone solution containing acetic acid (3% in volume), and ammonium hydroxide (3% in volume), to remove the embedded template, until no hypericin in the supernatant was detected using UV-vis spectrophotometer (Shimadzu, Tokyo, Japan) at 597 nm. Then the solid was treated with 2 μM ethanolamine to give Fe3O4@PDA/Hyp NSs. The final product was dispersed in ethanol for further use.
Fe3O4@PDA NSs were prepared and used as a control by following the same procedure as described for Fe3O4@PDA/Hyp NSs without the template.
2.4. Determination of Static Adsorption Capacity of Fe3O4@PDA/Hyp for Hypericin (Q)
To a centrifuge tube of 10 mL, 4 mg of Fe3O4@PDA/Hyp or Fe3O4@PDA NSs were added into a 4 mL known concentration of hypericin (59.4 μM unless specified) acetone solution. The tube was shaken at room temperature for 24 h (unless specified) in the dark. Then a magnet was used for separation, and the concentration of hypericin in the supernatant was measured with a UV-Vis spectrophotometer at 597 nm (Figures S6 and S7).
The adsorption capacity (Q, μg/g) of the NSs (Fe3O4@PDA/Hyp or Fe3O4@PDA) towards the test molecule was calculated by the following equation:
| (1) |
where C0 and Ce represent the initial and equilibrium concentrations of the test molecule in acetone (μM), respectively; M is the molecular weight of the test molecule; V (L) is the volume of the solution, and W is the dry weight of the NSs (g).
The specific adsorption capacity of Fe3O4@PDA/Hyp NSs (Qs) towards hypericin is defined as the neat adsorption capacity of Fe3O4@PDA/Hyp over that of Fe3O4@PDA, and is calculated according to Equation (2):
| (2) |
where Q1 and Q2 are the static adsorption capacity of Fe3O4@PDA/Hyp and Fe3O4@PDA (μg/g) towards hypericin, respectively.
2.5. Dynamic Adsorption Test
To investigate the adsorption kinetics of Fe3O4@PDA/Hyp (or Fe3O4@PDA) NSs, 4 mg of Fe3O4@PDA/Hyp (or Fe3O4@PDA) NSs were weighed into hypericin solution (59.4 μM, 4 mL) in a 10 mL centrifuge tube. The tubes were shaken at room temperature for the different time intervals (0.25, 1, 2, 4, 6, 8, and 12 h, respectively) in the dark. Then a magnet was used for the separation, and the concentration of hypericin in the supernatant was measured with a UV-Vis spectrophotometer at 597 nm.
2.6. Selectivity of Fe3O4@PDA/Hyp and Fe3O4@PDA for Hypericin
The binding selectivity of Fe3O4@PDA/Hyp and Fe3O4@PDA NSs was evaluated by measuring their binding capacities towards hypericin and two other molecules of protohypericin and emodin. 4 mg of the Fe3O4@PDA/Hyp or Fe3O4@PDA NSs were incubated respectively with 4 mL of hypericin, protohypericin, and emodin solution (59.4 μM in acetone) at 25 °C. After being incubated under continuously shaking for 24 h, the amounts of hypericin, protohypericin, and emodin bound to the Fe3O4@PDA/Hyp or Fe3O4@PDA NSs were measured, respectively. The binding selectivity of the NSs towards different molecules was compared using the “selectivity factor” (SF) and “imprinting factor” (IF) [24] that can be defined by the following equations:
| (3) |
where Q1’ is the adsorption capacity of the Fe3O4@PDA/Hyp NSs (μg/g) towards a non-template molecule.
| (4) |
where QMIP and QNIP is the adsorption capacity of the Fe3O4@PDA/Hyp and Fe3O4@PDA NSs (μg/g) towards a test molecule, respectively.
2.7. Adsorption–Extraction Cycles
One adsorption–extraction cycle consisted of loading the template, reaching equilibrium adsorption, followed by the extraction of the template. For the adsorption, 4 mg of Fe3O4@PDA/Hyp was added to 4 mL 59.4 μM template in acetone. The suspension was incubated with a shaker at 25 °C for 8 h. Then the NSs were collected with a magnet and washed following the extraction procedure.
2.8. Preparation of the Herb Extract Solution
To prepare the herb extract, fresh flowers were picked up from Hypericum perforatum plant just before the extraction process. The extraction was performed in the dark. The procedure was as following: 10 g fresh flowers was charged to a 2-L beaker and immersed with distilled water at 50 °C for 2 h. Then the flowers were transferred to a 1000-mL flask and refluxed with 500 mL methanol-water mixture (80:20, v/v) for 6 h. The contents in the flask were cooled to room temperature and filtered. The filtrate was dried under reduced pressure. The residue was dissolved with acetone and filtered. The filtrate was combined and the volume was adjusted with a 25 mL volumetric flask.
2.9. HPLC Analysis
A total of 8 mL of the herb extract solution was mixed with 1 mL of hypericin and 1 mL of protohypericin solution (each with a concentration of 600 μM in acetone), to obtain an original solution for adsorption. To 4 mL of this final solution, 4 mg of the NSs (Fe3O4@PDA/Hyp or Fe3O4@PDA) was added. The mixture was shaken for 8 h. The supernatant was analyzed by HPLC (Shimadzu, Tokyo, Japan), with C18 reversed-phase column (5 μm, 4.6 mm × 150 mm) at 25 °C. The mobile phase consisted of 50% acetonitrile, 50% of the mixture of ammonium acetate-acetic acid buffer (0.3 M, pH = 6.96) and methanol (1:4, v/v); detection wavelength: 590 nm; flow rate: 0.4 mL/min; injection volume: 10 μL.
3. Results and Discussion
3.1. Synthesis of Fe3O4@PDA/Hyp
The synthesis of Fe3O4@PDA/Hyp is described in Scheme 1. Dopamine is a small molecule containing catechol and amino groups. As illustrated in Scheme 1a, when mixed with the template, dopamine formed assembly with hypericin via hydrogen bonding and π–π interaction. The stability of the assembly and hypericin under the reaction conditions was investigated by UV-Vis spectroscopy (see Figure S4). Comparing to the spectrum of hypericin in the mixture of Tris-HCl buffer/acetone without dopamine, only a blue shift was observed in the spectrum of hypericin with dopamine, even after the prolongation of time. The result indicated that both the assembly and hypericin were stable under the reaction conditions. The oxidization of dopamine under the reaction condition, alongside with its noncovalent self-assembly and covalent polymerization, led to a cross-linked PDA layer deposited on the surface of MNSs [20]. Removal of hypericin from the PDA layer gave Fe3O4@PDA/Hyp NSs.
3.2. Characterization of Fe3O4@PDA/Hyp
3.2.1. FTIR Analysis
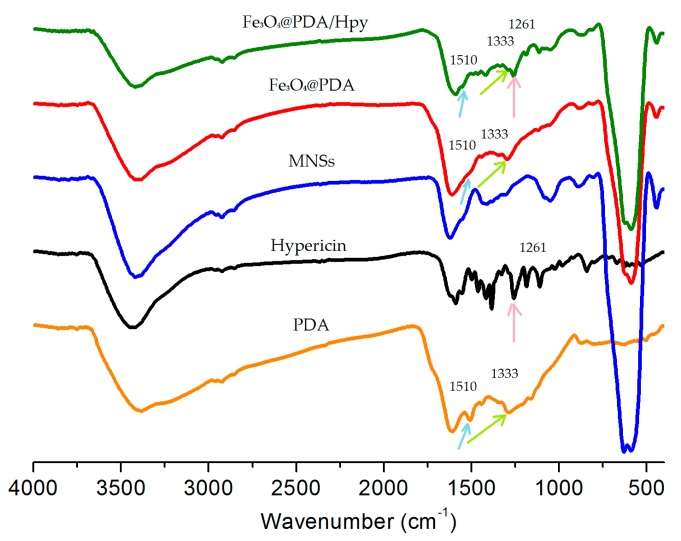
To verify the self-polymerization of dopamine on the surface of MNSs in the absence or presence of hypericin, Fe3O4@PDA and Fe3O4@PDA/Hyp were analyzed by FTIR spectroscopy. As shown in Figure 1, two characteristic bands of 1510 and 1333 cm−1 from the spectrum of PDA, ascribed to C=N and C–N–C stretching vibration [25], respectively were found on both spectra of Fe3O4@PDA and Fe3O4@PDA/Hyp; This was also the case for the characteristic band of 1261 cm−1 (C–O stretching vibration) from the spectrum of hypericin on the spectrum of Fe3O4@PDA/Hyp. The results imply that dopamine successfully polymerized on the surface of MNSs with or without the presence of hypericin under the reaction conditions used in this work.
Figure 1.
FTIR spectra of Fe3O4@PDA/Hyp, Fe3O4@PDA, MNSs, Hypericin and polydopamine (PDA).
3.2.2. TEM and DLS Analysis
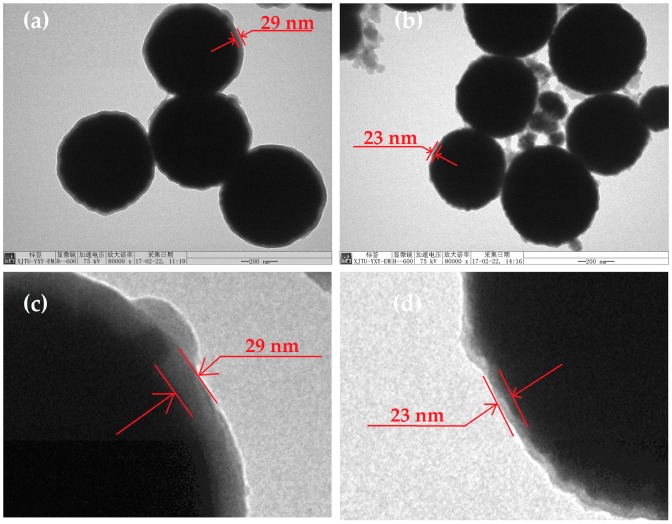
The morphology and the structure of Fe3O4@PDA/Hyp NSs were further studied by TEM and DLS. According to the TEM images (Figure 2), a thin layer around MNSs with a thickness of about 29 nm for Fe3O4@PDA NSs, and 23 nm for Fe3O4@PDA/Hyp NSs, was clearly seen. The thickness obtained in this work is similar to that reported in the literature [26]. The spherical shape of MNSs was preserved after polymerization. DLS analysis (Table 1 and Figure S5) showed the average diameter of Fe3O4/PDA and Fe3O4@PDA/Hyp NSs increased by 60 and 46 nm, to 573 and 559 nm, respectively, compared with that of MNSs (513 nm). The increased thickness in both cases coincided with the thickness of the PDA layer measured by TEM.
Figure 2.
TEM images of the nanospheres (NSs) prepared: (a) Fe3O4@PDA NSs; (b) Fe3O4@PDA/Hyp NSs; (c,d) are the enlarged images corresponding to (a,b), respectively. Scale bar: 200 nm.
Table 1.
The DLS data of the NSs prepared.
| NSs | Paticle size (nm) | Polydispersity index | ζ Potential (mV) |
|---|---|---|---|
| MNSs | 513 ± 98 | 0.444 | 1.35 ± 0.98 |
| Fe3O4@PDA | 572 ± 85 | 0.761 | −3.96 ± 0.87 |
| Fe3O4@PDA/Hyp | 559 ± 40 | 0.385 | −0.86 ± 0.08 |
| Fe3O4@PDA after extracting process | 574 ± 40 | 0.374 | −1.38 ± 0.42 |
| Fe3O4@PDA/Hyp after extracting process | 561 ± 98 | 0.338 | −9.96 ± 0.66 |
In addition, when Fe3O4@PDA and Fe3O4@PDA/Hyp NSs were subjected to the extraction process, the ζ potential of Fe3O4@PDA/Hyp NSs became more negative (from −0.86 to −9.96), while that of Fe3O4@PDA NSs was less affected (see Table 1). The difference of the ζ potentials of Fe3O4@PDA/Hyp NSs before and after extracting process may be ascribed to the removal of the templates from Fe3O4@PDA/Hyp NSs. All these results indicate that the desired core-shell structure of Fe3O4@PDA/Hyp NSs can be prepared conveniently via dopamine, self-polymerized on the surface of MNSs in the presence of hypericin.
3.2.3. BET Analysis
The average pore diameter, surface area and pore volume of the prepared Fe3O4@PDA/Hyp and Fe3O4@PDA NSs in this work were analyzed by BET method. The results are listed in Table 2. Although the average pore diameters of Fe3O4@PDA/Hyp and Fe3O4@PDA NSs were similar, the surface area and the pore volume of the Fe3O4@PDA/Hyp NSs were nearly 4.5 and 4 times, higher than those of the Fe3O4@PDA NSs, respectively.
Table 2.
The pore size, surface area, and the pore volume of the NSs.
| NSs | Average pore diameter (nm) | Surface area (m2/g) | Pore volume (cm3/g) |
|---|---|---|---|
| Fe3O4@PDA/Hyp | 8.095 ± 0.409 | 54.764 ± 4.189 | 0.111 ± 0.003 |
| Fe3O4@PDA | 9.185 ± 1.086 | 12.176 ± 2.166 | 0.028 ± 0.001 |
3.3. Optimization of Preparation Conditions for Specific Adsorption Capacity of Fe3O4@PDA/Hyp NSs
Considering that adsorption capacity of MIPs for targeting molecules can be affected by a number of parameters, the preparation conditions of Fe3O4@PDA/Hyp were screened and optimized, including monomer concentration, molar ratio of template to monomer, solvent, pH value, post-treatment, etc.
3.3.1. Effect of Monomer Concentration on Specific Adsorption Capacity
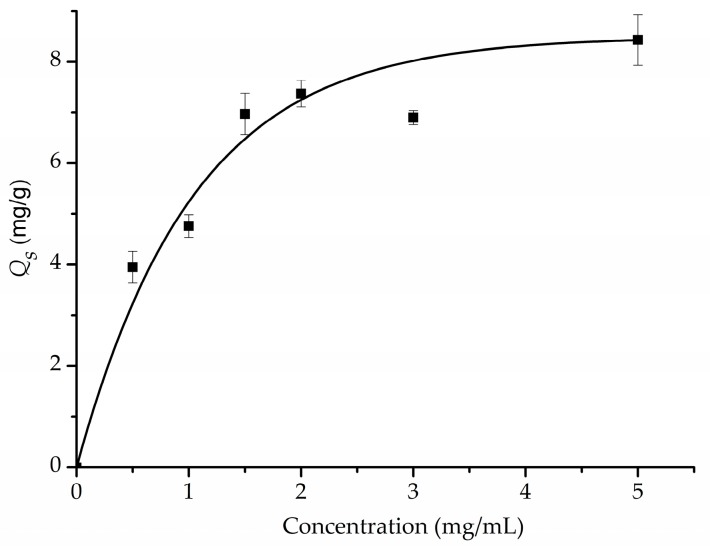
For SMIP, the concentration of monomer is a key factor that affects the thickness of the polymeric layer and the number of the recognition sites formed. It has been suggested the concentration of dopamine should be at least 2 mg/mL to form a PDA film on the surface of substrate [20]. To evaluate the effect of dopamine concentration on specific adsorption capacity, a series of Fe3O4@PDA/Hyp NSs were prepared by varying the concentration of dopamine in a range of 0.5–5 mg/mL. As shown in Figure 3, Qs increased gradually when the concentration of dopamine increased from 0.5 to 2 mg/mL, and reached a plateau with further increase of dopamine concentration. Interestingly, self-polymerization of dopamine in the system could take place either on the surface of the MNSs or in the solution. When the concentration of dopamine was lower than 2 mg/mL, self-polymerization of dopamine mainly took place on the surface of the MNSs, which led to the formation of a PDA layer around the MNSs. The higher the concentration, the thicker the layer, and therefore the more recognition sites led to a higher Qs value. However, a concentration of dopamine higher than 2 mg/mL increased the opportunity of its self-polymerization in solution and led to the formation of pure PDA nanoparticles. Hence, we chose 2 mg/mL as the optimal concentration of dopamine for further study.
Figure 3.
Effect of concentration of dopamine on specific absorption capacity (Qs).
3.3.2. Effect of the Ratio of Hypericin to Dopamine on Specific Adsorption Capacity
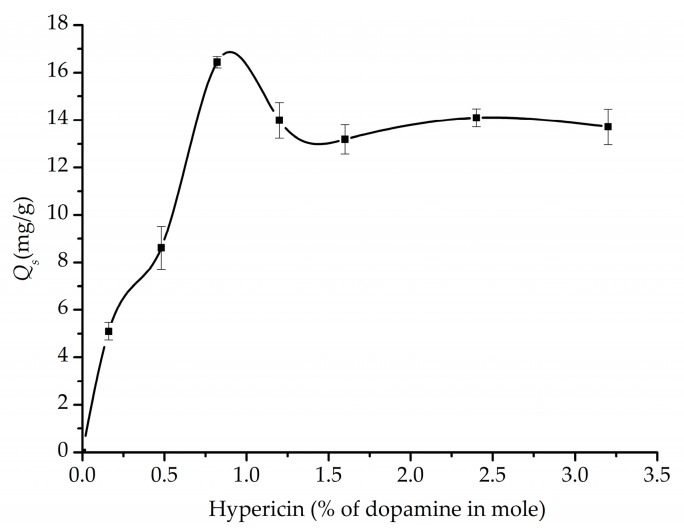
The ratio of template to monomers (including comonomer) has long been recognized as one of the crucial parameters for selective adsorption capacity of MIPs. The optimal ratio can vary in a wide range. For example, a value of 1/155 was reported for a MIP towards EA9A [27], while in another system, 1/41 was used to prepare a MIP for protonated primary alkylamine [24]. The effect of the ratio of hypericin to dopamine (in mole percentage) on specific adsorption capacity was studied by varying the ratio between 0.16% and 3.2%. The results were summarized in Figure 4. It can be seen that the Qs value increased with the ratio of hypericin to dopamine, and reached to a vertex at a ratio of 0.82% (equals to 1/122). Further increase of the ratio led to a slight decrease of the Qs. Therefore, the best ratio to acquire an optimal Qs was determined to be 0.82%.
Figure 4.
Effect of amount of hypericin (% of dopamine in mole) on specific absorption capacity (Qs).
3.3.3. Effect of the Amount of Acetone on Specific Adsorption Capacity
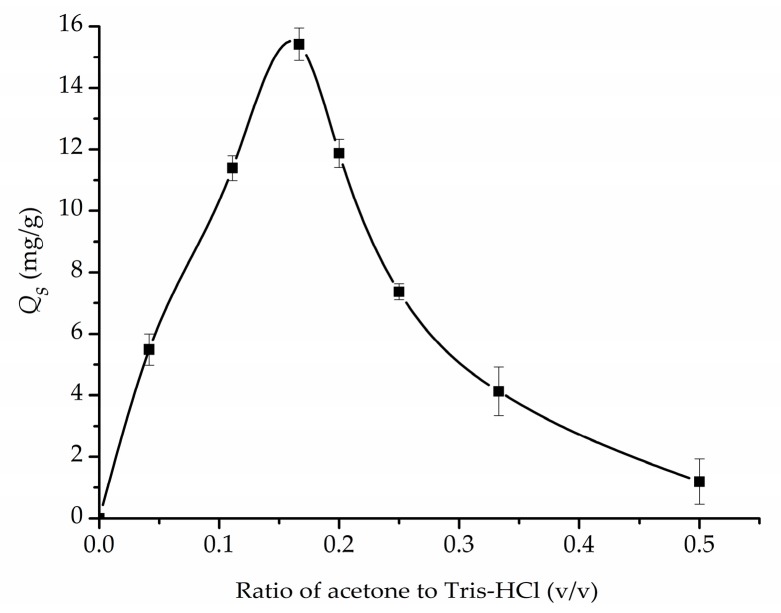
Considering hypericin is insoluble in water, it is necessary to dissolve it in a suitable organic solvent before the imprinting process. Acetone, as one of the few organic solvents which can dissolve hypericin and is miscible with water, was chosen and its influence on Qs was investigated accordingly. As shown in Figure 5, the amount of acetone used during imprinting affected Qs severely. The range of the ratio of acetone to Tris-HCl buffer (v/v) varied from 1/24 to 1/2. Qs was found to reach a maximum at the ratio of acetone to Tris-HCl around 1/6, and drop dramatically afterwards. It was deduced that acetone affected Qs by altering the aggregation status of hypericin in the system and affecting the polymerization rate of dopamine and nanostructure of the polymer network.
Figure 5.
Effect of the ratio of acetone to Tris-HCl buffer (v/v) on specific adsorption capacity (Qs).
3.3.4. Effect of Other Parameters on Specific Adsorption Capacity
Besides the parameters discussed above, some other parameters (such as pH, temperature, mixing order, post-treatment, etc.) greatly influence Qs, as shown in Table 3. As mentioned before, self-polymerization of dopamine is induced by oxygen in a weak alkaline solution; therefore, the effect of pH of Tris-HCl on Qs at 7.5, 8.0 and 8.5 was explored. It was found that Qs obtained at pH 8.0 is the highest within the pH range studied. Imprinting at a lower temperature resulted in the decrease of Qs, for instance from 16.40 mg/g at 25 °C to 10.12 mg/g at 0 °C. The change in the order of addition of hypericin and dopamine (i.e., mixing dopamine with MNSs before the addition of hypericin) led to a significant decrease of Qs, from 16.40 to 6.44 mg/g. Moreover, the post-treatment of Fe3O4@PDA/Hyp with ethanolamine nearly doubled the Qs, from 8.02 to 16.40 mg/g. The increase of Qs might be ascribed to the deactivation of the surface of PDA by ethanolamine via Schiff base reaction and/or Michael addition [28].
Table 3.
Qs of Fe3O4@PDA/Hyp NSs synthesized with different conditions a.
| Entry | pH | Temperature (°C) | Qs (mg/g) | RSD |
|---|---|---|---|---|
| 1 | 7.5 | 25 | 15.23 ± 0.08 | 0.005 |
| 2 | 8.0 | 25 | 16.40 ± 0.23 | 0.014 |
| 3 | 8.5 | 25 | 15.41 ± 0.52 | 0.034 |
| 4 | 8.0 | 0 | 10.12 ± 0.89 | 0.088 |
| 5 b | 8.0 | 25 | 6.44 ± 0.19 | 0.029 |
| 6 c | 8.0 | 25 | 8.02 ± 0.51 | 0.005 |
a A total of 25 mg MNSs suspension in Tris-HCl were mixed with 2.7 mg hypericin in acetone under mechanical stirring in 50 mL solvent (acetone/Tris-HCl = 1/6 in volume) for 10 min, followed by the addition of 100 mg dopamine; b 25 mg MNSs suspension in Tris-HCl were mixed with 100 mg dopamine under mechanical stirring for 10 min, followed by the addition of 2.7 mg hypericin dissolved in acetone (total volume is 50 mL, acetone/Tris-HCl = 1/6 in volume); c Fe3O4@PDA/Hyp prepared according to Entry 2, but without post-treatment with ethanolamine.
Due to the before-mentioned results, we concluded that Fe3O4@PDA/Hyp NSs with an optimal Qs value were prepared under the conditions used in Entry 2—i.e., 25 mg MNSs suspended in 41.67 mL Tris-HCl buffer solution was mixed with 2.7 mg hypericin dissolved in 8.33 mL acetone under mechanical stirring (acetone/Tris-HCl = 1/6 in volume, pH = 8.0) for 10 min, followed by the addition of 100 mg dopamine. The polymerization was run at room temperature in the atmosphere for 4 h. The nanospheres were subjected to the extracting process for removal of the template, followed by post-treatment with ethanolamine to obtain the best Fe3O4@PDA/Hyp NSs.
3.4. Dynamic Adsorption Study
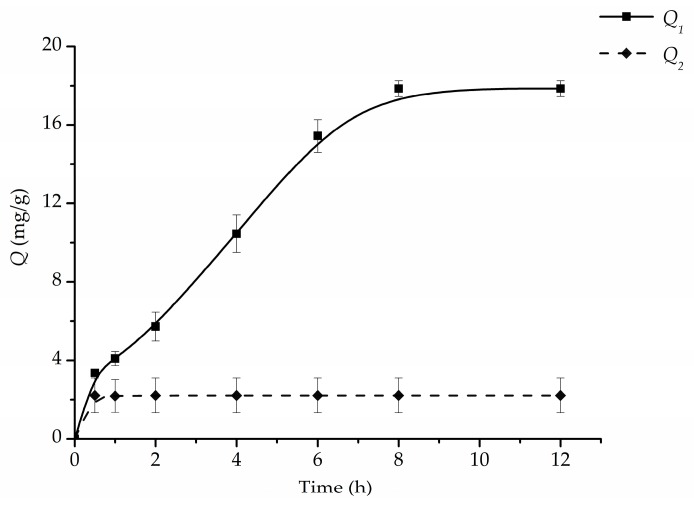
The equilibrium adsorption isotherms of Fe3O4@PDA/Hyp and Fe3O4@PDA NSs for the binding of hypericin were studied, and the results are shown in Figure 6. As observed in Figure 6, the adsorption process of the Fe3O4@PDA/Hyp NSs displayed two periods: the adsorption amount increased quickly and reached to about one third of the total adsorption capacity during the first hour. After this period, adsorption rate slowed down, and the equilibrium was achieved at 8 h. The explanation for this phenomenon is that the recognition sites located on the surface of PDA layer was ascribed to the binding of hypericin molecules in the first period, and then the diffusion of hypericin into the internal binding sites resulted in the slow adsorption rate, when the surface recognition sites became saturated. While the binding of Fe3O4@PDA towards hypericin saturated quickly after 0.25 h, the prolongation of contact time did not have a positive effect on the absorption. This may be explained by the much smaller pore volume and surface area of Fe3O4@PDA (proved by BET), where the non-specific absorption of hypericin mainly occurred on the surface of Fe3O4@PDA, and the mass transfer for hypericin into the interior of the PDA was inhibited. Compared to Fe3O4@PDA, a much stronger adsorption was observed on Fe3O4@PDA/Hyp NSs, which demonstrated the specific recognition sites were well-formed on the surface of Fe3O4@PDA/Hyp NSs.
Figure 6.
Dynamic adsorption of hypericin on Fe3O4@PDA/Hyp and Fe3O4@PDA NSs.
3.5. Maximum of Specific Adsorption Capacity
To investigate the binding performance of Fe3O4@PDA/Hyp NSs prepared under the optimized conditions, binding experiments were conducted with different concentrations of hypericin, varying in a range of 0 to 100 μM.
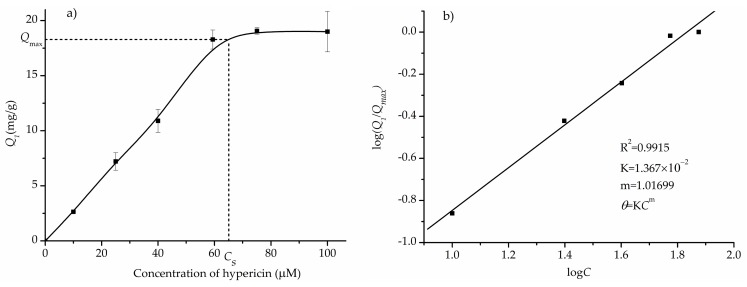
The adsorption isotherm of Fe3O4@PDA/Hyp NSs towards hypericin is shown in Figure 7a. It can be seen that Q1 increased with the concentration of hypericin before the saturation concentration CS (59.4 μM), and reached a maximum adsorption at CS. Further increase in concentration did not cause any difference in adsorption process. Obviously, it fits Langmuir adsorption isotherm. The Langmuir equation is expressed as following:
| (5) |
where θ equals to Q1/Qmax. The fitting plot is shown in Figure 7b. The fact that m value was close to 1 implied that the binding sites of Fe3O4@PDA/Hyps were homogeneous. The associated constant obtained was 1.367 × 10⁻² M−1. The R2 value of 0.9915 showed a good consistency of the Langmuir equation with the measured data.
Figure 7.
(a) The adsorption isotherm of Fe3O4@PDA/Hyp NSs towards hypericin; (b) The fitting plot of the adsorption isotherm of Fe3O4@PDA/Hyp NSs towards hypericin by Langmuir isotherm.
The specific adsorption of Fe3O4@PDA/Hyp NSs towards hypericin (Qs), as shown in Table 4, also increased with the concentration of hypericin, and achieved a maximum value of 16.30 mg/g at CS. It is worth mentioning that Fe3O4@PDA/Hyp NSs prepared under the optimized conditions in this work has a much higher specific absorption capacity for hypericin than that reported MIP via bulk polymerization (0.646 mg/g) [29].
Table 4.
The effect of the concentration of hypericin on Qs.
| Concentration of hypericin (μM) | Q1 (mg/g) | RSD | Qs (mg/g) | RSD |
|---|---|---|---|---|
| 0 | 0 | 0 | 0 | 0 |
| 10 | 2.62 ± 0.03 | 0.006 | 0.92 ± 0.80 | 0.814 |
| 25 | 7.21 ± 0.71 | 0.110 | 3.72 ± 0.68 | 0.067 |
| 40 | 10.89 ± 0.71 | 0.095 | 8.10 ± 0.27 | 0.031 |
| 59.4 | 18.28 ± 0.73 | 0.047 | 16.30 ± 0.12 | 0.007 |
| 75 | 19.06 ± 0.02 | 0.015 | 10.58 ± 1.11 | 0.105 |
| 100 | 19.00 ± 0.04 | 0.096 | 14.96 ± 1.32 | 0.077 |
3.6. Binding Selectivity
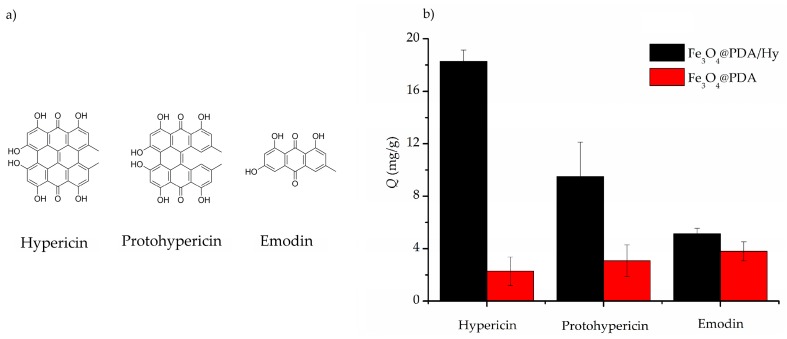
In order to examine the selectivity of Fe3O4@PDA/Hyp NSs toward template hypericin, protohypericin and emodin were chosen as competitors of hypericin they are all quinone-type structures containing common hydroxyl groups, similar to hypericin. Fe3O4@PDA/Hyp or Fe3O4@PDA NSs were incubated respectively with the same amount of hypericin, protohypericin, and emodin under the same conditions. The adsorption capacity of Fe3O4@PDA/Hyp and Fe3O4@PDA NSs towards the three quinone compounds was summarized in Figure 8b. Fe3O4@PDA/Hyp NSs showed a higher adsorption for hypericin (18.2 mg/g) than that for protohypericin and emodin (9.4 and 5.1 mg/g, respectively). The binding selectivity of the polymer particles was evaluated with SF and IF, respectively. The results are listed in Table 5. SF of Fe3O4@PDA/Hyp NSs towards protohypericin (a structurally similar molecule) and emodin (a structurally dissimilar molecule), was 1.92 and 3.55, respectively. IF of Fe3O4@PDA/Hyp NSs towards hypericin, protohypericin, and emodin, was 8.01, 3.07, and 1.36, respectively. These indicated that Fe3O4@PDA/Hyp NSs had the best selectivity for hypericin among the three tested compounds. In addition, the IF value of Fe3O4@PDA/Hyp NSs towards hypericin in this work was much higher than that reported [29,30].
Figure 8.
(a) The chemical structures of hypericin, protohypericin, and emodin; (b) Selective bindings of Fe3O4@PDA/Hyp (black) and Fe3O4@PDA (red) NSs toward to hypericin, protohypericin, and emodin, respectively.
Table 5.
The values of SF and IF.
| Factor | Hypericin | Protohypericin | Emodin |
|---|---|---|---|
| SF | / | 1.92 | 3.55 |
| IF | 8.01 (3.56 a, 4.5 b) | 3.07 | 1.36 |
3.7. Reproducibility and Reusability Evaluation
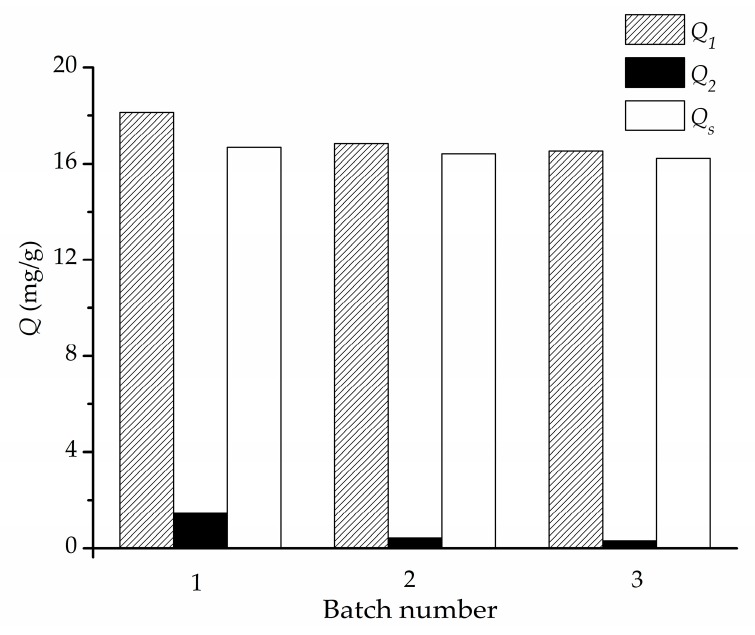
The reproducibility of the approach for fabrication of Fe3O4@PDA/Hyp NSs was evaluated by three parallel experiments. As is shown in Figure 9, similar specific adsorption capacities of Fe3O4@PDA/Hyp NSs prepared individually at the optimal conditions were measured with 16.68, 16.41 and 16.22 mg/g, respectively. The results indicate that the approach established in this work for fabrication of core-shell Fe3O4@PDA/Hyp NSs for selective recognition of hypericin is reproducible.
Figure 9.
Reproducibility study of the approach for fabrication of Fe3O4@PDA/Hyp NSs under the optimized conditions.
The reusability of MIPs is crucial in developing applications that are reliable, economic and sustainable [31]. Unfortunately, the evaluation on the Fe3O4@PDA/Hyp NSs prepared in this work showed that their reusability is not optimal. As shown in Figure S8, the absorption capacity decreased by 35% at the second cycle, and ~50% at the fourth cycle.
3.8. Adsorption of Fe3O4@PDA/Hyp NSs from the Herb Extract
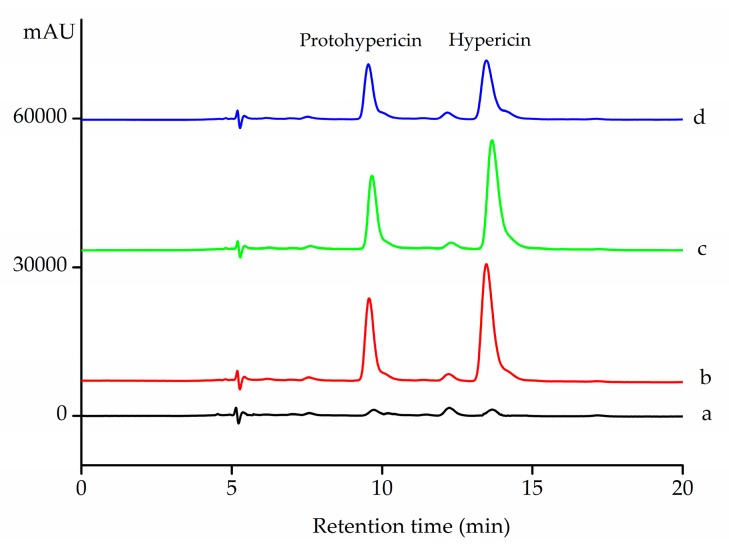
To test the selective adsorption ability of Fe3O4@PDA/Hyp NSs towards hypericin in a real sample, a herb extract was prepared and mixed with equal amount of hypericin and protohypericin. After adsorption, the supernatant was analyzed by HPLC, and the results are shown in Figure 10 and Table 6. According to the HPLC chromatogram of the herb extract, both peaks of hypericin and protohypericin were found (Figure 10a) and were well-separated under the LC conditions used for the analysis. From Table 6, it can be seen that 47.8% of hypericin in the initial sample was absorbed by Fe3O4@PDA/Hyp, while only 8.3% was absorbed by Fe3O4@PDA. Compared to Fe3O4@PDA, Fe3O4@PDA/Hyp showed nearly 6 times higher adsorption toward hypericin. On the other hand, Fe3O4@PDA gave similar adsorption to both hypericin and protohypericin (8.3% and 11.5%, respectively), which implied that the adsorption was non-specific.
Figure 10.
HPLC chromatograms. (a) the herb extract; (b) the mixture of the extract, hypericin and protohypericin before adsorption; (c) the supernatant after the adsorption of Fe3O4@PDA NSs; (d) the supernatant after the adsorption of Fe3O4@PDA/Hyp NSs.
Table 6.
The adsorption capacity of hypericin for hyperforin perforatum.
| Sample | Peak area (Hyp) | Peak area (Protohyp) | Adsorption of Hyp (%) | Adsorption of Protohyp (%) |
|---|---|---|---|---|
| Initial | 676,506.3 | 364,871.0 | / | / |
| Fe3O4@PDA | 620,591.5 | 322,926.9 | 8.3 | 11.5 |
| Fe3O4@PDA/Hyp | 353,391.0 | 246,750.0 | 47.8 | 32.4 |
4. Conclusions
This work has for the first time established a facile approach to fabricate core-shell magnetic molecularly imprinted nanospheres for selective recognition of hypericin (Fe3O4@PDA/Hyp) NSs via self-polymerization of dopamine on the surface of MNSs. The core-shell structure of the synthesized Fe3O4@PDA/Hyp NSs was confirmed by TEM. The reaction conditions for adsorption capacity were screened, which revealed that the ratios of acetone to Tris-HCl buffer and hypericin to dopamine, and post-treatment with ethanolamine, are crucial in maximizing the imprinting efficiency. Fe3O4@PDA/Hyp NSs prepared under the optimized conditions demonstrate a high adsorption capacity (Q = 18.28 mg/g), and possess good binding selectivity towards hypericn. In addition, the approach established in this work has good reproducibility for fabrication of Fe3O4@PDA/Hyp.
Acknowledgments
This research work was supported by the Project of Science and Technology of Social Development in Shaanxi Province (2016SF-029) and the National Natural Science Foundation of China (21174113).
Supplementary Materials
The following are available online at www.mdpi.com/2073-4360/9/4/135/s1. Figure S1: The 1H-NMR spectrum of emodin anthrone; Figure S2: The 1H-NMR spectrum of protohypericin; Figure S3: The 1H-NMR spectrum of hypericin; Figure S4: UV-Vis spectra of hypericin in Tris-HCl and acetone (v/v = 6:1, pH = 8.0) with or without the presence of dopamine; Figure S5: DLS histograms of MNSs and Fe3O4@PDA and magnetic response of MNSs; Figure S6: (a) UV-Vis spetra of hypericin, protohypericin and emodin, respectively, (b–d) Standard curves of hypericin, protohypericin and emodin; Figure S7: TEM images of MNSs (a) and their response to magnet in 10 s (b,c); Figure S8: Reusability study of Fe3O4@PDA/Hyp NSs.
Author Contributions
Wenxia Cheng designed and performed the experiments, analyzed the data, and drafted the experimental part. Fengfeng Fan performed the experiments. Ying Zhang synthesized hypericin and other molecules. Zhichao Pei assisted with data analysis and the revision of the manuscript. Wenji Wang performed the BET surface area analysis. Yuxin Pei directed the entire research work and drafted the manuscript.
Conflicts of Interest
The authors declare no conflict of interest.
References
- 1.Saw C.L., Olivo M., Soo K.C., Heng P.W. Delivery of hypericin for photodynamic applications. Cancer Lett. 2006;241:23–30. doi: 10.1016/j.canlet.2005.10.020. [DOI] [PubMed] [Google Scholar]
- 2.Falk H. From the photosensitizer hypericin to the photoreceptor stentorian—The chemistry of phenanthroperylene quinones. Angew. Chem. Int. Ed. 1999;38:3116–3136. doi: 10.1002/(SICI)1521-3773(19991102)38:21<3116::AID-ANIE3116>3.0.CO;2-S. [DOI] [PubMed] [Google Scholar]
- 3.Roby C.A., Anderson G.D., Kantor E., Dryer D.A., Burstein A.H. St John’s wort: Effect on CYP3A4 activity. Clin. Pharmacol. Ther. 2000;67:451–457. doi: 10.1067/mcp.2000.106793. [DOI] [PubMed] [Google Scholar]
- 4.Williams F.B., Sander L.C., Wise S.A., Girard J. Development and evaluation of methods for determination of naphthodianthrones and flavonoids in St. John’s wort. J. Chromatogr. A. 2006;1115:93–102. doi: 10.1016/j.chroma.2006.02.078. [DOI] [PubMed] [Google Scholar]
- 5.Cheong W.J., Yang S.H., Ali F. Molecular imprinted polymers for separation science: A review of reviews. J. Sep. Sci. 2013;36:609–628. doi: 10.1002/jssc.201200784. [DOI] [PubMed] [Google Scholar]
- 6.Razali M., Kim J.F., Attfield M., Budd P.M., Drioli E., Lee Y.M., Szekely G. Sustainable wastewater treatment and recycling in membrane manufacturing. Green Chem. 2015;17:5196–5205. doi: 10.1039/C5GC01937K. [DOI] [Google Scholar]
- 7.Niu Q., Gao K., Lin Z., Wu W. Surface molecular-imprinting engineering of novel cellulose nanofibril/conjugated polymer film sensors towards highly selective recognition and responsiveness of nitroaromatic vapors. Chem. Commun. 2013;49:9137–9139. doi: 10.1039/c3cc44705g. [DOI] [PubMed] [Google Scholar]
- 8.Deng X., Chen C., Xie J., Cai C., Chen X. Selective adsorption of elastase by surface molecular imprinting materials prepared with novel monomer. RSC Adv. 2016;6:43223–43227. doi: 10.1039/C6RA04805F. [DOI] [Google Scholar]
- 9.Ding X., Heiden P.A. Recent developments in molecularly imprinted nanoparticles by surface imprinting techniques. Macromol. Mater. Eng. 2014;299:268–282. doi: 10.1002/mame.201300160. [DOI] [Google Scholar]
- 10.Liu D., Song N., Feng W., Jia Q. Synthesis of graphene oxide functionalized surface-imprinted polymer for the preconcentration of tetracycline antibiotics. RSC Adv. 2016;6:11742–11748. doi: 10.1039/C5RA22462D. [DOI] [Google Scholar]
- 11.Yang X., Zhang Z., Li J., Chen X., Zhang M., Luo L., Yao S. Novel molecularly imprinted polymers with carbon nanotube as matrix for selective solid-phase extraction of emodin from kiwi fruit root. Food Chem. 2014;145:687–693. doi: 10.1016/j.foodchem.2013.08.114. [DOI] [PubMed] [Google Scholar]
- 12.Abbate V., Bassindale A.R., Brandstadt K.F., Taylor P.G. Biomimetic catalysis at silicon centre using molecularly imprinted polymers. J. Catal. 2011;284:68–76. doi: 10.1016/j.jcat.2011.08.019. [DOI] [Google Scholar]
- 13.Xia Z., Lin Z., Xiao Y., Wang L., Zheng J., Yang H., Chen G. Facile synthesis of polydopamine-coated molecularly imprinted silica nanoparticles for protein recognition and separation. Biosens. Bioelectron. 2013;47:120–126. doi: 10.1016/j.bios.2013.03.024. [DOI] [PubMed] [Google Scholar]
- 14.Zhou W.-H., Lu C.-H., Guo X.-C., Chen F.-R., Yang H.-H., Wang X.-R. Mussel-inspired molecularly imprinted polymer coating superparamagnetic nanoparticles for protein recognition. J. Mater. Chem. 2010;20:880–883. doi: 10.1039/B916619J. [DOI] [Google Scholar]
- 15.Wang X.-N., Liang R.-P., Meng X.-Y., Qiu J.-D. One-step synthesis of mussel-inspired molecularly imprinted magnetic polymer as stationary phase for chip-based open tubular capillary electrochromatography enantioseparation. J. Chromatogr. A. 2014;1362:301–308. doi: 10.1016/j.chroma.2014.08.044. [DOI] [PubMed] [Google Scholar]
- 16.Zhou W.-H., Tang S.-F., Yao Q.-H., Chen F.-R., Yang H.-H., Wang X.-R. A quartz crystal microbalance sensor based on mussel-inspired molecularly imprinted polymer. Biosens. Bioelectron. 2010;26:585–589. doi: 10.1016/j.bios.2010.07.024. [DOI] [PubMed] [Google Scholar]
- 17.Niu M., Pham-Huy C., He H. Core-shell nanoparticles coated with molecularly imprinted polymers: A review. Microchim. Acta. 2016;183:2677–2695. doi: 10.1007/s00604-016-1930-4. [DOI] [Google Scholar]
- 18.Mrowczynski R., Jurga-Stopa J., Markiewicz R., Coy E.L., Jurga S., Wozniak A. Assessment of polydopamine coated magnetic nanoparticles in doxorubicin delivery. RSC Adv. 2016;6:5936–5943. doi: 10.1039/C5RA24222C. [DOI] [Google Scholar]
- 19.Yusof N.A., Rahman S.K.A., Hussein M.Z., Ibrahim N.A. Preparation and characterization of molecularly imprinted polymer as SPE sorbent for melamine isolation. Polymers. 2013;5:1215–1228. doi: 10.3390/polym5041215. [DOI] [Google Scholar]
- 20.Liu Y., Ai K., Lu L. Polydopamine and its derivative materials: Synthesis and promising applications in energy, environmental, and biomedical fields. Chem. Rev. 2014;114:5057–5115. doi: 10.1021/cr400407a. [DOI] [PubMed] [Google Scholar]
- 21.Zhang M., Zhang X., He X., Chen L., Zhang Y. A self-assembled polydopamine film on the surface of magnetic nanoparticles for specific capture of protein. Nanoscale. 2012;4:3141–3147. doi: 10.1039/c2nr30316g. [DOI] [PubMed] [Google Scholar]
- 22.Pei Y.-X., Li Z.-B., Pei Z.-C., Hou Y. An efficient method for the synthesis of hypericin by monochromatic light. CN 103274920 A. 2014 Dec 17;
- 23.Deng H., Li X., Peng Q., Wang X., Chen J., Li Y. Monodisperse Magnetic Single-Crystal Ferrite Microspheres. Angew. Chem. 2005;117:2842–2845. doi: 10.1002/ange.200462551. [DOI] [PubMed] [Google Scholar]
- 24.Kupai J., Rojik E., Huszthy P., Szekely G. Role of chirality and macroring in imprinted polymers with enantiodiscriminative power. Appl. Mater. Interfaces. 2015;7:9516–9525. doi: 10.1021/acsami.5b00755. [DOI] [PubMed] [Google Scholar]
- 25.Hsu C.-W., Yang M.-C. Enhancement of the imprinting effect in cholesterol-imprinted microporous silica. J. Non-Cryst. Solids. 2008;354:4037–4042. doi: 10.1016/j.jnoncrysol.2008.05.037. [DOI] [Google Scholar]
- 26.Lee H., Dellatore S.M., Miller W.M., Messersmith P.B. Mussel-inspired surface chemistry for multifunctional coatings. Science. 2007;318:426–429. doi: 10.1126/science.1147241. [DOI] [PMC free article] [PubMed] [Google Scholar]
- 27.Umpleby Ii R.J., Baxter S.C., Bode M., Berch J.K., Jr., Shah R.N., Shimizu K.D. Application of the Freundlich adsorption isotherm in the characterization of molecularly imprinted polymers. Anal. Chim. Acta. 2001;435:35–42. doi: 10.1016/S0003-2670(00)01211-3. [DOI] [Google Scholar]
- 28.Lynge M.E., van der Westen R., Postma A., Stadler B. Polydopamine-a nature-inspired polymer coating for biomedical science. Nanoscale. 2011;3:4916–4928. doi: 10.1039/c1nr10969c. [DOI] [PubMed] [Google Scholar]
- 29.Li Z., Qin C., Li D., Hou Y., Li S., Sun J. Molecularly imprinted polymer for specific extraction of hypericin from hypericum perforatum l. Herbal extract. J. Pharm. Biomed. 2014;98:210–220. doi: 10.1016/j.jpba.2014.05.031. [DOI] [PubMed] [Google Scholar]
- 30.Florea A.-M., Iordache T.-V., Branger C., Ghiurea M., Avramescu S., Hubca G., Sârbu A. An innovative approach to prepare hypericin molecularly imprinted pearls using a “phyto-template”. Talanta. 2016;148:37–45. doi: 10.1016/j.talanta.2015.10.061. [DOI] [PubMed] [Google Scholar]
- 31.Kupai J., Razali M., Buyuktiryaki S., Kecili R., Szekely G. Long-term stability and reusability of molecularly imprinted polymers. Polym. Chem. 2017;8:666–673. doi: 10.1039/C6PY01853J. [DOI] [PMC free article] [PubMed] [Google Scholar]
Associated Data
This section collects any data citations, data availability statements, or supplementary materials included in this article.


