

SUMMARY
Fever is an evolutionarily conserved response that confers survival benefits during infection. However, the underlying mechanism remains obscure. Here, we report that fever promoted T lymphocyte trafficking through heat shock protein 90 (Hsp90)-induced α4 integrin activation and signaling in T cells. By inducing selective binding of Hsp90 to α4 integrins, but not β2 integrins, fever increased α4-integrin-mediated T cell adhesion and transmigration. Mechanistically, Hsp90 bound to the α4 tail and activated α4 integrins via inside-out signaling. Moreover, the N and C termini of one Hsp90 molecule simultaneously bound to two α4 tails, leading to dimerization and clustering of α4 integrins on the cell membrane and subsequent activation of the FAK-RhoA pathway. Abolishment of Hsp90-α4 interaction inhibited fever-induced T cell trafficking to draining lymph nodes and impaired the clearance of bacterial infection. Our findings identify the Hsp90-α4-integrin axis as a thermal sensory pathway that promotes T lymphocyte trafficking and enhances immune surveillance during infection.
In Brief
Fever is an evolutionarily conserved response in both endothermic and ectothermic species and confers survival benefits during infection and injury. Lin et al. identify that the Hsp90-α4-integrin axis serves as a thermal sensory pathway that responds to fever to promote T cell trafficking and enhance immune surveillance during infection.
Graphical Abstract
INTRODUCTION
The recruitment of lymphocytes from blood circulation to lymphoid organs and inflamed tissues is essential to immune surveillance and host defense (Butcher and Picker, 1996). This recruitment process consists of a highly ordered adhesion cascade that includes tethering and rolling of lymphocytes along vessel walls of high endothelial venules (HEVs), chemokine-induced activation, firm arrest, and transendothelial migration (von Andrian and Mempel, 2003). The initial tethering and rolling of lymphocytes are mainly mediated by the interaction between selectins and their ligands. In addition, inactive α4β1, α4β7, and αLβ2 integrins are also able to support lymphocyte rolling via binding to their endothelial ligands, vascular cell adhesion molecule 1 (VCAM-1), mucosal vascular addressin cell adhesion molecule 1 (MAdCAM-1), and intercellular adhesion molecules (ICAMs) (Ley et al., 2007), respectively. After chemokine-induced activation of lymphocytes on the endothelium, α4 and β2 integrins (e.g., α4β1, α4β7, αLβ2, and αMβ2) are activated to mediate cell firm arrest. During this process, chemokines activate integrins through the rapid triggering of an inside-out signaling network that regulates the binding of intracellular effector proteins (e.g., talin or kindlin) to the cytoplasmic domains of integrins. Binding of effector proteins converts the inactive integrin (in a low-affinity, bent conformation) into its active form, characterized by a high-affinity, extended conformation (Hogg et al., 2011). The final transmigration step across HEVs involves adhesion molecules, including α4β1, αLβ2, VCAM-1, ICAM-1, ICAM-2, platelet endothelial cell adhesion molecule-1 (PECAM-1), junctional adhesion molecule 1 (JAM-1), and JAM-2 (Carman and Springer, 2004). Notably, α4 and β2 integrins are involved in each step during lymphocyte homing and thus have essential roles in regulating lymphocyte trafficking to lymphoid organs and inflamed tissues.
Fever is a highly conserved response to infection or injury in both endothermic and ectothermic species. The increase in core body temperature of 1°C–4°C during fever is associated with improved organism survival and the resolution ofmanyinfections (Evans et al., 2015); however, the mechanism underlying the protective action of fever remains poorly understood. Emerging evidence suggests that fever-range thermal stress (38°C –40°C) plays a role in directing migration of lymphocytes to secondary lymphoid organs or inflammatory sites. Fever-range thermal stress has been shown to enhance endothelial expression of ICAM-1 and chemokine (C-C motif) ligand 21 (CCL21) to increase lymphocyte adhesion to and trafficking across HEVs (Chen et al., 2006). In addition, fever-range temperatures markedly stimulate L-selectin-dependent adhesion of lymphocytes to HEVs (Chen et al., 2004). However, little is known about the regulation of lymphocyte integrins by fever. The only reports on the subject describe that febrile temperatures increase α4β7-integrin-dependent adhesion and homing of lymphocytes (Evans et al., 2000; Evans et al., 2001); however, the mechanism is unknown.
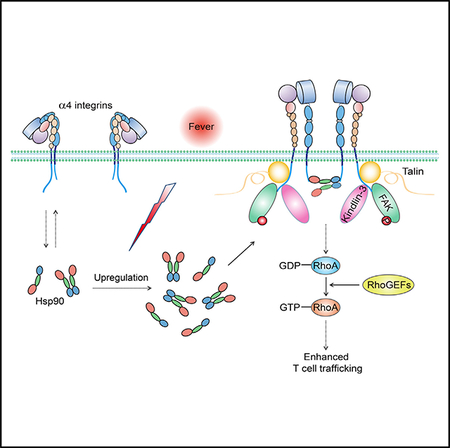
Here, we identified the Hsp90-α4-integrin axis as a thermal sensory pathway that was activated by fever-range thermal stress and subsequently promoted α4-integrin-mediated T cell adhesion and transmigration. Among all heat shock proteins (Hsps) upregulated by fever, Hsp90 selectively bound to the α4 cytoplasmic tail and induced the binding of talin and kindlin-3, which triggered α4 integrin activation via inside-out signaling. Moreover, the N-terminal and C-terminal domains of one Hsp90 molecule simultaneously bound to two α4 tails, resulting in the dimerization and clustering of α4 integrins on the T cell membrane and subsequent activation of the FAK-RhoA (focal adhesion kinase and Ras homolog gene family, member A) signaling pathway to promote cell migration. Abolishment of Hsp90-α4 interaction in vivo inhibited fever-induced T cell trafficking to draining lymph nodes and inflamed tissues and impaired the clearance of bacterial infection in a mouse model of Salmonella typhimurium infection. Our findings reveal a clear-cut molecular mechanism for the control of lymphocyte integrin function by the thermal element of fever, which enhances immune surveillance via heightening α4-integrin-mediated T cell trafficking during febrile inflammatory responses.
RESULTS
Fever-Range Thermal Stress Promotes α4-Integrin-Mediated T Cell Adhesion and Transmigration
In order to study the regulation of integrin function in T lymphocytes by fever, we first investigated the effect of fever-range thermal stress on the expression and function of α4 and β2 integrins in T cells. T cells from C57BL/6J mouse spleens were treated in vitro for 12 hr at normal temperature (37°C) or febrile temperature (40°C). Flow-cytometry analysis indicated no change in cell-surface expression of any α4 or β2 integrins at 40°C (Figure 1A). Next, we examined the effect of fever-range thermal stress on α4β1-, α4β7-, or β2-integrin-mediated cell adhesion to immobilized VCAM-1, MAdCAM-1, or ICAM-1, respectively, under flow conditions in the presence of physiological cations (1 mM Ca2+ + Mg2+) (Figure 1B). For experiments using VCAM-1 substrate, we pre-treated T cells with α4β7-blocking antibody DATK32 to block α4β7-VCAM-1 binding in order to specifically examine the function of α4β1-VCAM-1 interaction. Compared with control cells (37°C), T cells pre-treated at 40°C showed a significant increase in adhesion to immobilized VCAM-1 and MAdCAM-1 at a wall shear stress of 1 dyn/cm2. In contrast, cells pre-treated at 37°C and at 40°C presented similar adhesive behaviors on ICAM-1 substrate (Figure 1B). Pre-treatment of cells with pertussis toxin (PTX) did not affect the enhanced cell adhesion to VCAM-1 or MAdCAM-1, indicating that α4-integrin-mediated cell adhesion induced by fever-range thermal stress was independent of Gi signaling (Figure 1B). As controls, cells treated with α4-blocking antibody PS/2, α4β7-blocking antibody DATK32, or β2-blocking antibody 2E6 did not adhere to VCAM-1, MAdCAM-1, or ICAM-1 substrate, respectively (Figure 1B). Thus, fever-range thermal stress promotes T cell adhesion via α4 integrins, but not via β2 integrins. In addition, compared with control cells (37°C), T cells pre-treated at 40°C showed significantly enhanced chemokine-CCL21-induced transmigration across the VCAM-1- or MAdCAM-1-coated membrane, whereas cell transmigration across the ICAM-1-coated membrane was unaffected by thermal stress (Figure 1C). Cells pre-treated at 37°C or 40°C showed similar low transmigration in the absence of CCL21 (Figure 1C). Collectively, fever-range thermal stress specifically promotes α4-integrin-mediated T cell adhesion and transmigration.
Figure 1. Effect of Fever-Range Thermal Stress on Integrin-Mediated T Cell Adhesion and Transmigration.

T cells from C57BL/6J mouse spleens were pre-treated at 37°C or 40°C in culture medium with or without 100 ng/mL PTX for 12 hr. α4β7-VCAM-1 binding was disrupted by cell pre-treatment with 10 μg/mL α4β7-blocking antibody DATK32 during examination of α4β1-mediated cell adhesion and migration on VCAM-1 substrate in (B) and (C).
(A) Cell-surface expression of α4 and β2 integrins was determined by flow cytometry. Numbers within the table show the specific mean fluorescence intensities and p values.
(B) Adhesion of T cells to the immobilized VCAM-1-Fc (5 μg/mL), MAdCAM-1-Fc (5 μg/mL), or ICAM-1-Fc (5 μg/mL) substrate in the presence of 1 mM Ca2+ + Mg2+ under flow condition. The numbers of rolling and firmly adherent cells were measured at a wall shear stress of 1 dyn/cm2. Cells pre-treated with α4-blockingantibody PS/2 (10 μg/mL), α4β7-blocking antibody DATK32 (10 μg/mL), or β2-blocking-antibody 2E6 (10 μg/mL) were used as controls.
(C) Transmigration of T cells across membranes coated in VCAM-1-Fc (5 μg/mL), MAdCAM-1-Fc (5 μg/mL), or ICAM-1-Fc (5 μg/mL) in the absence and presence of CCL21 (500 ng/mL) in the lower chamber.
Data represent the mean ± SEM (n ≥ 3). **p < 0.01; ***p < 0.001; ns, not significant (Student’s t test). The asterisk in (B) indicates the changes in total adherent cells.
Hsp90 Binds to α4 Integrins and Promotes T Cell Adhesion and Transmigration
Hsps are a family of proteins that display enhanced expression in response to thermal stress (Schlesinger, 1990). We observed by immunoblot analysis that T cells treated at 40°C showed upregulated expression of Hsp110, Hsp90, Hsp70, Hsp60, Hsp40, and Hsp10 (Figure 2A). To examine the interaction between the Hsps and α4 or β2 integrins, we isolated the T cell membrane fractions and carried out a co-immunoprecipitation assay with antibodies specific to α4 or β2 (Figure 2A). The results showed that Hsp90AA1 and Hsp90AB1 (two isoforms of Hsp90) selectively bound to α4, whereas Hsp40, Hsp60, and Hsp70 bound to both α4 and β2, suggesting that Hsp90 might be involved in the selective regulation of α4-integrin-mediated cell adhesion and migration by thermal stress. In addition, we observed enhanced association of Hsp90 with α4 in T cells pre-treated at 40°C (Figure 2A). The thermal-stress-induced Hsp90 expression and enhanced Hsp90-α4 binding were independent of Gi signaling (Figure S1A). The enhanced expression of Hsp90 lasted at least 48 hr after thermal stress (Figure S1B), which enabled a persistent regulation of α4 integrin function even after the temperature went back to normal. To confirm that thermal stress enhances α4-integrin-mediated cell adhesion and migration by upregulating Hsp90 expression, we overexpressed Hsp90 in T cells, which markedly enhanced Hsp90-α4 binding (Figure 2B) and did not influence cell-surface expression of α4 and β2 integrins (Table S1). Hsp90 overexpression significantly promoted α4-integrin-mediated T cell adhesion to and transmigration across VCAM-1 and MAdCAM-1 substrates, whereas β2-integrin-mediated cell adhesion and transmigration on ICAM-1 substrate were unaffected (Figures 2C and 2D). By contrast, overexpression of Hsp40, Hsp60, and Hsp70 did not affect T cell adhesion or transmigration on any substrates (Figure S2). These data suggest that fever-range thermal stress upregulates the expression of Hsp90 and promotes its binding to α4 integrins, which enhances α4-integrin-dependent T cell adhesion and transmigration.
Figure 2. Fever-Range Thermal Stress Upregulates the Expression of Hsp90 and Promotes Its Binding to α4 Integrins in T Cells.

(A) Immunoblot analysis of integrin α4, integrin β2, and Hsps in whole-cell lysate (WCL) of T cells pre-treated at 37°C or 40°C and co-immunoprecipitation of Hsps with integrin α4 or β2 in the cell-membrane fractions.
(B–D) T cells were transiently transfected with vector, Hsp90AA1, or Hsp90AB1. α4β7-VCAM-1 binding was disrupted by cell pre-treatment with 10 μg/mL α4β7-blocking antibody DATK32 during examination of α4β1-mediated cell adhesion and migration on VCAM-1 substrate in (C) and (D). Co-immunoprecipitation of Hsp90AA1 or Hsp90AB1 with integrin α4 in the membrane fractions of T cells is shown in (B). Adhesion of T cells to immobilized VCAM-1-Fc (5 μg/mL), MAdCAM1-Fc (5 μg/mL), or ICAM-1-Fc (5 μg/mL) substrate in 1 mM Ca2+ + Mg2+ at a wall shear stress of 1 dyn/cm2 is shown in (C). Transmigration of T cells across membranes coated in VCAM-1-Fc (5 μg/mL), MAdCAM-1-Fc (5 μg/mL), or ICAM-1-Fc (5 μg/mL) in the presence of CCL21 (500 ng/mL) in the lower chamber is shown in (D).
One representative result of three independent experiments is shown in (A) and (B). Data represent the mean ± SEM (n ≥ 3) in (C) and (D). **p < 0.01; ***p < 0.001; ns, not significant (one-way ANOVA with Dunnett post-tests). The asterisk in (C) indicates the changes in total adherent cells. See also Figures S1 and S2 and Table S1.
Hsp90 Binds to α4 Integrins via a Short Sequence in the α4 Cytoplasmic Domain
Because integrins are α and β heterodimers, Hsp90 can bind to α4 integrins through interaction with either α or β subunits. To determine which integrin subunit binds to Hsp90, we prepared integrin-tail model proteins of the α4, β1, or β7 subunit as previously described (Liu et al., 1999) and incubated them with T cell lysate. Hsp90AA1 and Hsp90AB1 were precipitated only by the α4-tail model protein (Figure 3A), indicating that Hsp90 bound to the α4, but not the β1 or β7, cytoplasmic tail. Using a series of truncations of α4-tail model proteins, we further determined that Hsp90AA1 and Hsp90AB1 bound to the ENRRDSWSY motif in the α4 tail (Figure 3B) and inhibited the binding of paxillin (Figures S3A and S3B) (Liu and Ginsberg, 2000). We then individually mutated each of the nine residues in the ENRRDSWSY motif to alanine in the α4-tail model proteins. R985A, W989A, and Y991A mutations abolished Hsp90 binding to the α4 cytoplasmic tail (Figure 3C), suggesting that residues R985, W989, and Y991 are pivotal for Hsp90 binding to α4 integrins.
Figure 3. The Binding of Hsp90 to the α4 Tail Is Crucial for Fever-Induced T Cell Adhesion and Transmigration.

(A–C) Precipitation of Hsp90AA1 and Hsp90AB1 from T cell lysate by Ni2+-charged resins loaded with the indicated integrin-tail model proteins. Coomassie blue staining of gels was used for assessing the loading of each integrin-tail model protein. WT α4, β1, and β7 tails were used in (A); α4-tail truncations were tested in (B), and the schematic diagram shows WT and truncated α4-tail constructs; and single-point mutants of the α4 tail were tested in (C).
(D) Schematic diagram of Hsp90 structures. Abbreviations are as follows: NTD, N-terminal domain; MD, middle domain; and CTD, C-terminal domain.
(E) The HA-tagged NTD, MD, or CTD of Hsp90AA1 or Hsp90AB1 was overexpressed in T cells and then co-immunoprecipitated with integrin α4 in the cell-membrane fractions.
(F) Precipitation of recombinant GST-tagged NTD and CTD proteins of Hsp90AA1 or Hsp90AB1 by Ni2+-charged resins loaded with α4-tail model protein.
(G–K) WT T cells or Itga4R985A/R985A (KI) T cells were pre-treated at 37°C or 40°C in culture medium for 12 hr. α4β7-VCAM-1 binding was disrupted by cell pre-treatment with 10 μg/mL α4β7-blocking antibody DATK32 during examination of α4β1-mediated cell adhesion and migration on VCAM-1 substrate in (H) and (I). Hsp90AA1 and Hsp90AB1 were co-immunoprecipitated with integrin α4 in the cell-membrane fractions (G). Adhesion of T cells to immobilized VCAM-1-Fc (5 μg/mL) or MAdCAM-1-Fc (5 μg/mL) substrate in 1 mM Ca2+ + Mg2+ at a wall shear stress of 1 dyn/cm2 is shown in (H). Transmigration of T cells across membranes coated in VCAM-1-Fc (5 μg/mL) or MAdCAM-1-Fc (5 μg/mL) in the presence of CCL21 (500 ng/mL) in the lower chamber is shown in (I). Intravital microscopy of the interactions between calcein-labeled WT or KI T cells and the inguinal lymph node venular tree of WT recipient mice is shown. Transient tethering, rolling, and sticking fractions of WT and KI T cells are shown. Cells pre-treated with α4-blocking-antibody PS/2 (10 μg/mL) were used as controls (J). In vivo short-term homing of calcein-labeled WT or KI T cells to inguinal lymph nodes of WT mice is shown. Cells pre-treated with α4-blocking-antibody PS/2 (10 μg/mL) were used as controls. The homing index was calculated as the percentage of the homed T cells in inguinal lymph nodes in relation to that of WT T cells pre-treated at 37°C without PS/2 antibody treatment (K).
One representative result of three independent experiments is shown in (A)–(C) and (E)–(G). Data represent the mean ± SEM (n ≥ 3) in (H)–(K). *p < 0.05; **p < 0.01; ***p < 0.001; ns, not significant (Student’s t test). The asterisk in (H) indicates the changes in total adherent cells. See also Figure S3.
N and C Termini of Hsp90 Bind to the α4 Subunit
Hsp90 consists of three distinct structural domains: the N-terminal domain (NTD), the middle domain (MD), and the C-terminal domain (CTD) (Taipale et al., 2010) (Figure 3D). To map the Hsp90 regions that interact with the α4 subunit, we fused each domain in Hsp90AA1 and Hsp90AB1 with a hemagglutinin (HA) tag at the C terminus and transiently expressed it in T cells. A co-immunoprecipitation assay indicated that both the NTD and CTD of Hsp90 associate with the α4 subunit (Figure 3E), suggesting that Hsp90 can bind to α4 via either the NTD or CTD. Next, we cloned and purified the Hsp90 NTD and CTD fused with a glutathione S-transferase (GST) tag at the N terminus. The purified GST-tagged NTD and CTD of Hsp90 were efficiently precipitated by α4-tail model proteins, indicating that Hsp90’s NTD and CTD directly bind to the α4 tail (Figure 3F).
Hsp90-α4-Integrin Binding Is Essential to Thermal-Stress-Induced T Cell Adhesion and Transmigration
To examine whether Hsp90 promotes α4-integrin-mediated T cell adhesion and transmigration by binding to the α4 cytoplasmic domain, we generated Itga4R985A/R985A genetically targeted C57BL/6J mice to abolish Hsp90-α4 interaction in vivo (Figure S3C). The R985A mutation was chosen to specifically disrupt the Hsp90-α4 interaction because R985A, among the three single-point mutations that abolished Hsp90-α4 interaction in the α4 cytoplasmic domain, did not affect binding of paxillin to the α4 cytoplasmic tail (Figure S3D). α4 integrin expression in T cells was not influenced by the introduction of the α4(R985A) mutation in mice (Figure S3E). As expected, the α4(R985A) mutation abolished Hsp90 binding to α4 in T cells before and after thermal stress (Figure 3G) and thermal-stress-induced T cell adhesion and transmigration on VCAM-1 and MAdCAM-1 substrates (Figures 3H and 3I), suggesting that Hsp90-α4 binding is essential to the fever-induced α4-integrin-mediated T cell adhesion and transmigration. Next, we used intravital microscopy of inguinal lymph nodes to examine the trafficking of thermal-stress-treated T cells in wild-type (WT) C57BL/6J mice. Notably, pre-treatment of T cells at 40°C significantly upregulated the sticking fraction of WT T cells in order IV and V venules (Figure 3J) and increased the homing of WT T cells to inguinal lymph nodes (Figure 3K), but failed to promote the sticking fraction and homing of Itga4R985A/R985A T cells, indicating that Hsp90-α4-integrin interaction is essential to thermal-stress-promoted T cell firm arrest in HEVs and homing to lymph nodes. By contrast, pre-treatment of T cells at 40°C enhanced the transient tethering and rolling fractions of both WT and Itga4R985A/R985A T cells in order IV and V venules (Figure 3J), which could be mainly due to the enhanced L-selectin function on T cells upon thermal stress (Chen et al., 2004). Compared with WT T cells, Itga4R985A/R985A T cells showed a smaller increase in rolling fraction upon thermal stress (Figure 3J), suggesting that thermal-stress-promoted α4 integrin function partially contributes to the enhanced T cell rolling in HEVs. Blockade of α4 integrins with PS/2 antibody had no effect on the adhesion or homing of 37°C-treated T cells to inguinal lymph nodes (Figures 3J and 3K) as reported previously, which could be due to the compensation by integrin αLβ2 (Berlin-Rufenach et al., 1999). Notably, PS/2 specifically inhibited the thermal-stress-enhanced rolling, firm arrest, and homing of WT T cells (Figures 3J and 3K), indicating that fever-induced T cell adhesion and homing is α4 integrin dependent. In addition, there was no change in CCR7 expression in WT or Itga4R985A/R985A T cells before or after thermal stress (Figures S3F and S3G), which excludes a role for increased expression of chemokine receptors in enhancing T cell homing after thermal stress.
Binding of Hsp90 to α4 Induces α4 Integrin Activation
To study whether α4 integrins are activated by Hsp90 upon thermal stress, we first examined the binding of soluble VCAM-1 and MAdCAM-1 to α4β1 and α4β7 on T cells in response to febrile temperature (Figure 4A). Pre-treatment of T cells at 40°C significantly increased VCAM-1 and MAdCAM-1 binding to WT T cells, but not to Itga4R985A/R985A T cells, suggesting that α4-integrin-ligand binding enhanced by thermal stress is dependent on the Hsp90-α4 interaction (Figure 4A). Consistently, overexpression of Hsp90AA1 or Hsp90AB1 enhanced VCAM-1 and MAdCAM-1 binding to WT T cells, but not to Itga4R985A/R985A T cells (Figure 4B).
Figure 4. Hsp90 Induces α4 Integrin Activation.

(A and B) Binding of soluble VCAM-1-Fc and MAdCAM-1-Fc to WT and KI T cells pre-treated at 37°C or 40°C (A) or to T cells transfected with vector, Hsp90AA1, or Hsp90AB1 (B) was calculated with the specific mean fluorescence intensity and quantified as a percentage of α4 expression. α4β7-VCAM-1 binding was disrupted by cell pre-treatment with 10 μg/mL α4β7-blocking antibody DATK32 during examination of α4β1-mediated soluble VCAM-1 binding. Cells pre-treated with the α4-blocking-antibody PS/2 (10 μg/mL) or α4β7-blocking antibody DATK32 (10 μg/mL) were used as a negative control for VCAM-1 or MAdCAM-1 binding, respectively, in (A).
(C and D) Effect of fever-range thermal stress (C) or Hsp90 overexpression (D) on the conformation of α4 ectodomain in WT or KI T cells. FRET efficiency between integrin α4 β-propeller domain and the plasma membrane was calculated.
(E and F) Co-immunoprecipitation of talin or kindlin-3 with α4 integrins in T cells pre-treated at 37°C or 40°C (E) or T cells transfected with vector, Hsp90AA1, or Hsp90AB1 (F).
(G–L) T cells with talin or kindlin-3 silencing were pre-treated at 37°C or 40°C in culture medium for 12 hr. Co-immunoprecipitation of talin (G) or kindlin-3 (H) with α4 integrins in T cells is shown in (G) and (H). Binding of soluble VCAM-1-Fc and MAdCAM-1-Fc to T cells with talin (I) or kindlin-3 (J) silencing was calculated with the specific mean fluorescence intensity and quantified as a percentage of α4 expression. α4β7-VCAM-1 binding was disrupted by cell pre-treatment with 10 μg/mL α4β7-blocking antibody DATK32 during examination of α4β1-mediated soluble VCAM-1 binding (I and J). The conformation of α4 ectodomain in T cells with talin (K) or kindlin-3 (L) silencing is shown. FRET efficiency between integrin α4 β-propeller domain and the plasma membrane was calculated (K and L).
One representative result of three independent experiments is shown in (E)–(H). Data represent the mean ± SEM (n ≥ 3) in (A)–(D) and (I)–(L). *p < 0.05; **p < 0.01; ***p < 0.001; ns, not significant (Student’s t test in A, C, and I–L; one-way ANOVA with Dunnett post-tests in B and D).
Next, we examined the extension of α4 ectodomain, which is coupled with integrin activation, by using fluorescence resonance energy transfer (FRET) as described (Pan et al., 2010). To assess the orientation of α4 ectodomain relative to the plasma membrane, we labeled the α4 β-propeller domain with Alexa Fluor 488-conjugated PS/2 Fab fragment as the FRET donor. The plasma membrane was labeled with FM 4–64FX as the FRET acceptor. Pre-treatment of T cells at 40°C or overexpression of Hsp90AA1 or Hsp90AB1 significantly decreased FRET efficiency in WT T cells, but not in Itga4R985A/R985A T cells (Figures 4C and 4D), indicating that thermal-stress-induced extension of α4 is dependent on Hsp90-α4 interaction. Thus, thermal stress induces the active conformation of α4 integrins by enhancing Hsp90-α4 interaction.
We next examined the association of α4 integrins with talin and kindlin-3, two critical integrin co-activators that trigger integrin inside-out activation by binding to the integrin β tail (Calderwood et al., 2013). A co-immunoprecipitation assay showed that both thermal stress and Hsp90 overexpression markedly enhanced the association between α4 integrins and talin or kindlin-3 in WT T cells, but not in Itga4R985A/R985A T cells (Figures 4E and 4F). Silencing talin and kindlin-3 in T cells reduced talin and kindlin-3 binding to α4 integrins (Figures 4G and 4H) and inhibited thermal-stress-induced activation of α4 integrins (Figures 4I–4L). Thus, thermal-stress-induced Hsp90-α4 interaction triggers α4 integrin activation by enhancing the binding of talin and kindlin-3.
Binding of Hsp90 to α4 Induces the Dimerization and Clustering of α4 Integrins on the Cell Membrane
Because both the NTD and CTD of Hsp90 can directly bind to the α4 tail, we hypothesized that the NTD and CTD of one Hsp90 molecule simultaneously associate with two α4 subunits, which induces α4 integrin dimerization and clustering on the cell membrane and subsequent activation of integrin downstream signaling. To study the dimerization of α4 integrins on the T cell membrane, we established a bimolecular fluorescence complementation (BiFC) system by fusing two complementary parts of green fluorescent protein (GFP), GFP S1–10 and GFP S11, to the C terminus of the α4 cytoplasmic domain (Cabantous and Waldo, 2006). The dimerization of α4 fused to GFP S1–10 and GFP S11 could induce the reconstitution of a functional GFP (Figure 5A). The endogenous α4 was silenced by small hairpin RNA (shRNA) in T cells, and then we co-expressed the GFP S1–10- and GFP S11-fused shRNA-resistant α4 subunits to generate T cells expressing α4 integrin-split GFP. Treatment of cells at 40°C led to higher GFP signal on the plasma membrane of T cells expressing WT α4 integrin-split GFP than on cells treated at 37°C (Figures 5B and 5D), indicating that fever-range thermal stress efficiently induces the dimerization of α4 integrins on the T cell surface. Consistently, clustering of α4 integrins on the plasma membrane was observed in T cells expressing WT α4 integrin-split GFP at 40°C, but not at 37°C (Figure 5D). In contrast, the GFP signal and α4 integrin clustering on the surface of T cells expressing α4(R985A) integrin-split GFP were not induced by thermal stress, which suggests that thermal-stress-induced dimerization of α4 integrins is dependent on the Hsp90-α4 interaction (Figures 5B and 5D). Similar to the effect of thermal stress, overexpression of Hsp90AA1 or Hsp90AB1 significantly induced the GFP signal in T cells expressing WT α4 integrin-split GFP, but not in T cells expressing α4(R985A) integrin-split GFP (Figure 5C). Altogether, Hsp90-α4 binding induces α4 integrin dimerization and clustering on the cell membrane during fever-range thermal stress.
Figure 5. Hsp90 Induces α4 Integrin Dimerization and Clustering on the Plasma Membrane via Its NTD and CTD.

(A) Design of a reporter of integrin α4 dimerization on the plasma membrane according to the BiFC-split GFP system.
(B and C) Relative GFP fluorescence of T cells expressing WT α4 integrin-split GFP or α4(R985A) integrin-split GFP and pre-treated at 37°C or 40°C (B) or transfected with vector, Hsp90AA1, or Hsp90AB1 (C) was calculated with the mean fluorescence intensity of GFP and quantified as a percentage of α4 integrin expression.
(D) Confocal microscopy visualization of the integrin clustering on the plasma membrane. White arrowheads indicate the representative integrin clusters. Scalebars, 3 μm.
(E) Schematic diagram of WT and mutant Hsp90. Abbreviations are as follows: NM, CTD truncation; MC, NTD truncation; and NC5, deletion of C-terminal 49 amino acids in the CTD to disrupt Hsp90 homodimerization.
(F) Cell lysates of T cells transiently expressing HA-tagged Hsp90 WT, NM, or MC mutant were loaded onto a native-PAGE, and then HA-tagged proteins were detected by immunoblot.
(G) Relative GFP fluorescence of T cells expressing WT α4-integrin-split GFP and transfected with vector, Hsp90 WT, or NM or MC mutant was calculated with the mean fluorescence intensity of GFP and quantified as a percentage of α4 integrin expression.
(H) Cell lysates of T cells transiently expressing HA-tagged Hsp90 WT or NC5 mutant were loaded onto a native-PAGE, and then HA-tagged proteins weredetected by immunoblot.
(I) Relative GFP fluorescence of T cells expressing WT α4-integrin-split GFP and transfected with vector, Hsp90 WT, or NC5 mutant was calculated with the mean fluorescence intensity of GFP and quantified as a percentage of α4 integrin expression.
One representative result of three independent experiments is shown in (D), (F), and (H). Data represent the mean ± SEM (n = 3) in (B), (C), (G), and (I). *p < 0.05; **p < 0.01; ***p < 0.001; ns, not significant (Student’s t test in B, G, and I; one-way ANOVA with Dunnett post-tests in C, G, and I). See also Figures S4 and S5.
Both the NTD and CTD of Hsp90 Are Required for Induction of α4 Integrin Dimerization
To investigate whether both the NTD and CTD of Hsp90 are required for mediating α4 integrin dimerization, we deleted either the NTD (Hsp90-MC) or CTD (Hsp90-NM) in Hsp90 (Figure 5E). HA-tagged Hsp90-WT, Hsp90-NM, and Hsp90-MC were transfected into T cells expressing WT α4 integrin-split GFP. Native-polyacrylamide gel electrophoresis (PAGE) results showed that Hsp90AA1-WT and Hsp90AA1-MC existed as homodimers, whereas Hsp90AB1-WT and Hsp90AB1-MC existed predominantly as monomers (Figure 5F). Deletion of the CTD (Hsp90-NM) abolished dimer formation for both Hsp90AA1 and Hsp90AB1 (Figure 5F). These results are consistent with those of previous reports (Kobayakawa et al., 2008). In T cells expressing WT α4 integrin-split GFP, overexpression of Hsp90-WT led to a significant increase in the GFP signal; conversely, overexpression of Hsp90-MC induced much lower GFP signal, and no increase in GFP signal was observed with overexpression of Hsp90-NM (Figure 5G). The weak Hsp90-MC-induced GFP signal could be due to low efficiency of α4 integrin dimerization with the two CTDs in the Hsp90-MC dimer (Figure 5F). These results indicate that both the NTD and CTD of Hsp90 are necessary for mediating efficient α4 integrin dimerization.
Next, we generated an Hsp90 mutant (Hsp90-NC5) bearing a deletion of 49 amino acid residues in the CTD (Figure 5E) to prevent Hsp90 from homodimerizing (Figure 5H) (Meng et al., 1996). The binding of Hsp90’s CTD to the α4 tail was unaffected by the deletion in the CTD (Figure S4). Overexpression of Hsp90-WT or Hsp90-NC5 induced comparable GFP signals in T cells expressing WT α4 integrin-split GFP, indicating that the Hsp90 monomer is sufficient to induce efficient dimerization of α4 integrins (Figure 5I). Thus, one Hsp90 molecule can efficiently mediate α4 integrin dimerization via the simultaneous binding of two α4 subunits to the NTD and CTD of Hsp90.
Moreover, ATPase dominant-negative mutation in Hsp90AA1 (D93N) and Hsp90AB1 (D88N) had no effect on Hsp90-α4 binding (Figure S5A), α4 integrin dimerization on the cell membrane (Figure S5B), or α4-integrin-mediated cell adhesion or transmigration (Figures S5C and S5D).
Hsp90-α4 Binding Activates the FAK-RhoA GTPase Pathway
Integrin clustering on the plasma membrane can induce the activation of intracellular signal pathways. FAK and the Rho-family of GTPases (RhoA, Rac1, and Cdc42) are crucial signaling components that are activated by integrins and promote cell migration (Infante and Ridley, 2013; Mitra et al., 2005). Treatment of WT T cells at 40°C significantly upregulated the phosphorylation of FAK-Tyr397 (Figure 6A) and induced the activation of RhoA (Figure 6B); we observed no effect on the activation of Rac1 or Cdc42 (Figure 6B). In contrast, neither FAK nor RhoA was activated by thermal stress in Itga4R985A/R985A T cells (Figure 6C), suggesting that thermal-stress-induced activation of FAK and RhoA is dependent on Hsp90-α4 binding. Furthermore, overexpression of Hsp90-WT significantly induced the activation of FAK and RhoA in WT T cells; conversely, overexpression of Hsp90-NM, which failed to induce α4 integrin dimerization (Figure 5G), did not activate FAK and RhoA (Figure 6D), suggesting that Hsp90-induced activation of FAK and RhoA is dependent on α4 integrin dimerization. T cells expressing Hsp90-NM showed less activation of FAK and RhoA than vector control cells (Figure 6D), suggesting that Hsp90-NM might compete with endogenous Hsp90 to bind integrin α4 and consequently inhibit basal Hsp90-α4 binding and its downstream signaling. Thus, Hsp90-α4 binding induces α4 integrin dimerization, clustering, and subsequent activation of FAK and RhoA GTPase.
Figure 6. Hsp90-α4 Binding Activates the FAK-RhoA Pathway.

(A) Immunoblot analysis of FAK phosphorylation (pY397) in T cells pre-treated at 37°C or 40°C. The relative pY397-FAK/FAK ratio was normalized to the value of cells pre-treated at 37°C.
(B) Effect of fever-range thermal stress on Rho GTPase activation. GTP-bound RhoA, Rac1, and Cdc42 were detected by binding to recombinant GST-RBD orGST-PBD in T cells pre-treated at 37°C or 40°C by GST precipitation assays. The relative GTP-GTPase/GTPase ratio was normalized to the value of cells pre-treated at 37°C.
(C) Immunoblot analysis of FAK phosphorylation (pY397) and RhoA activation in WT or KI T cells pre-treated at 37°C or 40°C. The relative pY397-FAK/FAK and GTP-RhoA/RhoA ratios were normalized to the values of WT T cells pre-treated at 37°C.
(D) Immunoblot analysis of FAK phosphorylation (pY397) and RhoA activation in T cells transfected with vector, Hsp90 WT, or NM mutants. The relative pY397-FAK/FAK and GTP-RhoA/RhoA ratios were normalized to the values of cells transfected with vector.
One representative result of three independent experiments is shown. Data represent the mean ± SEM (n = 3). *p < 0.05; **p < 0.01; ***p < 0.001; ns, not significant (Student’s t test in A–C; one-way ANOVA with Dunnett post-tests in D).
Disruption of Hsp90-α4 Interaction Inhibits Thermal-Stress-Induced T Cell Trafficking In vivo
To study the contribution of the Hsp90-α4 axis in T cell trafficking during thermal stress, we treated WT and Itga4R985A/R985A mice with normothermia (NT; core temperature 36.8°C ± 0.2°C) or fever-range whole-body hyperthermia (WBH; core temperature 39.5°C ± 0.5°C) for 6 hr (Chen et al., 2006) and then isolated T cells from mouse spleens. WT and Itga4R985A/R985A mice showed similar α4 integrin expression in T cells (Figure 7A). Compared with the normothermia group, WT mice with WBH showed increased Hsp90 expression and enhanced Hsp90-α4 binding in T cells (Figure 7A). No Hsp90-α4 binding was observed in T cells from Itga4R985A/R985A mice either before or after WBH treatment (Figure 7A). Consistently, the α4(R985A) mutation completely abolished WBH-induced T cell adhesion and transmigration on VCAM-1 and MAdCAM-1 substrates (Figures 7B and 7C).
Figure 7. Disruption of Hsp90-α4 Interaction Inhibits Fever-Induced T Cell Trafficking In vivo and Impairs the Clearance of Bacterial Infection.

(A–D) WT and KI C57BL/6J mice were treated with normothermia (NT; core temperature 36.8°C ± 0.2°C) or fever-range whole-body hyperthermia (WBH; core temperature 39.5°C ± 0.5°C) for 6 hr (n = 7–10 mice per group) and then were sacrificed. T cells were isolated from the spleen. α4β7-VCAM-1 binding was disrupted by cell pre-treatment with 10 μg/mL α4β7-blocking antibody DATK32 during examination of α4β1-mediated cell adhesion and migration on VCAM-1 substrate in (B) and (C). Co-immunoprecipitation of Hsp90AA1 and Hsp90AB1 with integrin α4 in the cell-membrane fractions is shown in (A). Adhesion of T cells to immobilized VCAM-1-Fc (5 μg/mL) or MAdCAM-1-Fc (5 μg/mL) substrate in 1 mM Ca2+ + Mg2+ at a wall shear stress of 1 dyn/cm2 is shown in (B). Transmigration of T cells across membranes coated in VCAM-1-Fc (5 μg/mL) or MAdCAM-1-Fc (5 μg/mL) in the presence of CCL21 (500 ng/mL) in the lower chamber is shown in (C). The total numbers of T cells in PLNs, MLNs, PPs, spleen, and PB were quantified (D).
(E–G) WT and KI mice were injected with LPS (10 μg/kg) or PBS at time zero (n = 3 mice per group). Body temperature was monitored every hour. The bar shows the dark period (E). Immunoblot analysis of Hsp90AA1 and Hsp90AB1 in T cells isolated from PLNs in mice is shown in (F). The total numbers of T cells in PLNs, MLNs, PPs, spleen, and PB were quantified (G).
(H) Effect of different temperatures on the expression of Hsp90. T cells were isolated from PLNs in WT mice and then treated at 37°C, 38°C, 38.5°C, 39°C, or 40°C for 12 hr. Immunoblot analysis of Hsp90AA1 and Hsp90AB1 in T cells is shown.
(I–M) WT and KI mice were orally injected with PBS or S. typhimurium strain SL1344 (108 CFU per mouse; n = 4–12 mice per group). Body temperature was monitored for 5 days (I). The survival rates of WT and KI mice are shown in (J), and significance was calculated as given. H&E staining of the small intestine at day 5 after infection is shown in (K) (scale bar, 100 mm). Immunofluorescence analysis of the small intestine sections at day 5 after infection is shown. Stain coloring is as follows: DAPI, blue; S. typhimurium expressing GFP, green; and CD3, red. Quantifications of S. typhimurium colonies and CD3+ cells are shown below in (L) (scale bar, 100 mm). The total numbers of T cells in PLNs, MLNs, PPs, spleen, and PB were quantified at day 5 after infection (M).
One representative result of three independent experiments is shown in (A), (F), (H), (K), and (L). Data represent the mean ± SEM in (B)–(E), (G), (I), (L), and (M). *p < 0.05; **p < 0.01; ***p < 0.001; ns, not significant (Student’s t test). The asterisk in (B) indicates the changes in total adherent cells. See also Figures S6 and S7.
Next, we examined the distribution of T cells in various lymphoid tissues after normothermia or WBH treatment (Figure 7D). Normothermic WT and Itga4R985A/R985A mice showed similar T cell distributions in peripheral lymph nodes (PLNs), mesenteric lymph nodes (MLNs), Peyer’s patches (PPs), spleen, and peripheral blood (PB) (Figure 7D). In WT mice, an increase in T cell accumulation in PLNs, MLNs, or PPs and a concomitant decrease in PB were observed after WBH treatment. T cell distribution in the spleen was barely altered because it lacks HEV structures (Chen et al., 2006). In contrast, the changes in T cell distribution in PLNs, MLNs, and PPs were significantly less drastic in Itga4R985A/R985A mice than in WT mice after WBH treatment (Figure 7D), indicating that disruption of Hsp90-α4 binding significantly inhibits WBH-enhanced T cell trafficking to these lymph nodes. The observed increase in T cell trafficking to PLNs and MLNs in Itga4R985A/R985A mice after WBH treatment could be potentially due to the enhanced L-selectin function on T cells and the upregulated ICAM-1 expression on HEVs during thermal stress (Chen et al., 2006; Chen et al., 2004). We observed no significant change in VCAM-1 or MAdCAM-1 expression on HEVs in PLNs, MLNs, or PPs after WBH treatment (Figure S6A). Thus, the enhanced Hsp90-α4 interaction is critical to promote T cell trafficking to draining lymph nodes during thermal stress.
To investigate whether thermal stress affects the retention of T cells in lymph nodes, we examined the T cell egress from PLNs in normothermia and WBH mice within 6 hr after injection of β2- and α4-integrin-blocking antibodies to inhibit T cell homing to lymph nodes (Berlin-Rufenach et al., 1999; Nakai et al., 2014). The results showed no difference in T cell numbers in PLNs between normothermia and fever-range WBH mice groups, suggesting that thermal stress does not affect the egress of T cells from lymph nodes (Figures S6B and S6C). Moreover, we also examined the expression of sphingosine-1 phosphate receptor-1 (S1PR1) in T cells in PLNs (Figure S6D) because it is positively correlated with the exit of lymphocytes from secondary lymphoid organs (Matloubian et al., 2004). The results showed that S1PR1 expression did not change in WT or Itga4R985A/R985A mice before or after thermal stress (Figure S6D).
LPS-Induced Moderate Fever Does Not Affect T Cell Trafficking in Mice
Next, we established a lipopolysaccharide (LPS)-induced fever model by injecting mice with LPS (10 μg/kg) or PBS (Oka et al., 2003). Body temperature was monitored for every hour after injection (Figure 7E). Consistent with the previous report (Oka et al., 2003), LPS increased mouse body temperature to about 38°C, which was sustained for fewer than 6 hr (Figure 7E). However, the moderate increase in body temperature did not change Hsp90 expression or T cell distribution in mice (Figures 7F and 7G). Further in vitro study showed that Hsp90 expression was upregulated in T cells treated at 38.5°C and above, but not in cells treated at 38°C (Figure 7H). Therefore, high fever is required for inducing Hsp90 expression and promoting T cell trafficking.
Disruption of Hsp90-α4 Interaction Impairs the Clearance of Bacterial Infection
To further evaluate the role of the Hsp90-α4 axis in the pathological process associated with high fever, we established a mouse model of Salmonella typhimurium infection, which can cause food- and water-borne gastroenteritis and typhoid fever (Mathur et al., 2012). WT and Itga4R985A/R985A mice developed fever at day 2 and reached the highest body temperature of ~40°C at day 4 after oral administration of S. typhimurium (SL1344) (Figure 7I). Notably, S. typhimurium infection led to much more severe lethality in Itga4R985A/R985A mice than in WT mice (Figure 7J). Compared with WT mice, Itga4R985A/R985A mice showed more severe intestinal tissue damage with areas of epithelial breakdown (Figure 7K) and significantly increased bacterial dissemination in the small intestine (SI) 5 days after oral administration of S. typhimurium (Figure 7L). WT mice with S. typhimurium infection displayed increased T cells in the SI (Figure 7L), PLNs, and spleen and decreased T cells in MLNs, PPs, and PB (Figure 7M). The decrease in T cells in MLNs and PPs and increase in T cells in the spleen are consistent with previous reports that S. typhimurium infects MLNs, PPs, and the spleen, causes damage to these lymph organs, and directly affects the lymphocyte distribution (Jones et al., 1994). Disruption of Hsp90-α4 binding in Itga4R985A/R985A mice significantly inhibited the changes in T cell distribution in PLNs, but not in MLNs and PPs (Figure 7M), which might be due to the damage of MLNs and PPs by S. typhimurium. Markedly fewer T cells were found in the SI in the S. typhimurium-infected Itga4R985A/R985A mice (Figure 7L), indicating that disruption of Hsp90-α4 binding significantly inhibits the recruitment of T cells to inflamed tissues during bacterial infection. Moreover, the Hsp90-α4-integrin axis also promoted the trafficking of α4-positive innate immune cells, such as monocytes, into draining lymph nodes in the S. typhimurium-infected mice (Figure S7). Altogether, the fever-enhanced Hsp90-α4 axis is critical for promoting immune cell trafficking to inflamed tissues and facilitating the clearance of bacterial infection, which is important for efficient immune surveillance during febrile inflammatory responses.
DISCUSSION
Fever is a complex physiologic response to bacterial or viral infection and damage, which enhances immune surveillance during inflammation by promoting lymphocyte trafficking to lymphoid organs and inflamed tissues (Evans et al., 2015). Lymphocyte integrins, such as α4 and β2 integrins, are critical cell-adhesion molecules that control lymphocyte trafficking during inflammation (Kinashi, 2005). Our study demonstrates that the Hsp90-α4-integrin axis functions as a thermal sensory pathway that is activated by fever-range thermal stress to promote T cell adhesion and migration and facilitate T cell trafficking to draining lymph nodes and inflamed tissues to enhance immune surveillance during infection.
Because α4 integrins are expressed on some innate immune cells, such as monocytes (Shi and Pamer, 2011), monocyte trafficking could also be regulated by fever via the Hsp90-α4 axis. Indeed, Itga4R985A/R985A mice showed a significantly smaller increase in monocytes in PLNs, MLNs, and PPs than did WT mice at day 3 after oral infection of S. typhimurium, indicating that Hsp90-α4-integrin interaction enhances monocyte migration to draining lymph nodes during fever. However, neutrophils, which do not express α4 integrins (Kuijpers, 1995), showed comparable recruitment to PLNs, MLNs, and PPs in WT and Itga4R985A/R985A mice. Thus, Hsp90-α4-integrin signaling can promote the trafficking of α4 integrin-expressing innate and adaptive immune cells during fever, which facilitates the clearance of bacterial infection.
Although VCAM-1 expression has been detected on rat PLN HEVs (May et al., 1993), whether VCAM-1 is expressed on mouse PLN HEVs is controversial. Several studies have shown that VCAM-1 is expressed on uninflamed PLN HEVs and that α4-integrin-VCAM-1 interaction plays an important role in lymphocyte homing to PLNs (Berlin-Rufenach et al., 1999; Boscacci et al., 2010). However, in a previous study, immunofluorescence staining showed that VCAM-1 expression on HEVs in PLNs was undetectably low in normal mice and even in LPS- and TNF-α-treated mice (Hahne et al., 1993), possibly because the antibodies used had lower sensitivity against VCAM-1 than other VCAM-1 antibodies used in studies reporting positive VCAM-1 expression on PLN HEVs (Berlin-Rufenach et al., 1999; Boscacci et al., 2010).
The function of Hsp90 as a molecular chaperone is dependent on the binding and hydrolysis of ATP, which is the key driving force for conformational conversions within the dimeric chaperone (Obermann et al., 1998). Previous studies have reported that Hsp90 might participate in integrin-related signals and functions by stabilizing integrin-linked kinase (ILK) and FAK in an ATPase-activity-dependent manner (Radovanac et al., 2013; Xiong et al., 2014). However, our data show that regulation of integrin function by Hsp90 does not require Hsp90’s ATPase activity because this function is distinct from Hsp90’s chaperone function, which is dependent on the energy released from ATP hydrolysis.
Paxillin is an intracellular-signaling adaptor protein that binds to the cytoplasmic domain of α4 subunits and regulates α4 integrin signaling, cell spreading, and cell migration (Liu et al., 1999). Effective cell migration requires the dynamic spatial regulation of α4-integrin-paxillin binding (Goldfinger et al., 2003). Our data show that Hsp90 and paxillin share the same binding motif, ENRRDSWSY, in the α4 tail. Binding of Hsp90 to the α4 cytoplasmic domain inhibits the binding of paxillin to α4 integrins. Notably, the R985A mutation in the α4 tail disrupts Hsp90 binding, but not paxillin binding (Liu and Ginsberg, 2000). Moreover, phosphorylation-mimic mutation S988D in the α4 tail inhibits paxillin binding, but not Hsp90 binding (Han et al., 2001). Altogether, these findings suggest that Hsp90 and paxillin potentially bind to the same region in the α4 cytoplasmic domain via distinct mechanisms.
In summary, our study has provided an important insight into the complex mechanisms whereby fever-range thermal stress amplifies immune protection during infection and inflammatory responses. In addition to the previously reported enhanced L-selectin-dependent adhesion of lymphocytes and increased CCL21 and ICAM-1 expression on HEVs during thermal stress (Chen et al., 2006; Chen et al., 2004), we identified a thermal sensory Hsp90-α4-integrin pathway that responds to fever to promote α4-integrin-expressing immune cell trafficking, which could enhance immune surveillance. Considering the critical roles of α4 integrins in inflammatory response and gut immune-homeostasis, the Hsp90-α4-integrin pathway could have important α4-integrin-related roles in inflammation, gut immunity, and diseases, such as multiple sclerosis and inflammatory bowel disease. We can promote immune cell trafficking to enhance the immune response to fight infection or cancer development by upregulating Hsp90 expression in immune cells or temper immunity during chronic inflammation or in autoimmune disorders by inhibiting the Hsp90-α4-integrin pathway, which could lead to the development of strategies for the management of diseases.
STAR⋆METHODS
CONTACT FOR REAGENT AND RESOURCE SHARING
Further information and requests for resources and reagents should be directed to and will be fulfilled by the Lead Contact, JianFeng Chen (jfchen@sibcb.ac.cn).
EXPERIMENTAL MODEL AND SUBJECT DETAILS
Mice
WT C57BL/6J mice were obtained from Jackson Laboratory. Itga4R985A/R985A C57BL/6J mice were generated by Shanghai Biomodel Organism Science & Technology Development Co., Ltd. The genotype of Itga4R985A/R985A mice was verified by PCR amplification (Taq DNA Polymerase, Vazyme) and DNA sequencing. Age-matched (8–10 weeks of age) female Itga4R985A/R985A mice and littermate controls were used. All mice were maintained under specific pathogen-free conditions. All animal studies were approved by the Institutional Animal Care and Use Committee of the Shanghai Institute of Biochemistry and Cell Biology, Chinese Academy of Sciences.
METHOD DETAILS
Flow cytometry
Flow cytometry was done as described (Lu et al., 2016). T Cells were stained with antibodies against α4 or β2 integrins and then measured using FACSCelesta (BD Biosciences). Data were analyzed using FlowJo 7.6.1 software.
Flow chamber assay
Flow chamber assay was performed as described (Chen et al., 2003; Lu et al., 2016; Sun et al., 2014). A polystyrene Petri dish was coated with a 5 mm diameter, 20 μL spot of 5 μg/mL mouse VCAM-1-Fc, MAdCAM-1-Fc or ICAM-1-Fc in coating buffer (PBS, 10 mM NaHCO3, pH 9.0) for 1 hr at 37°C, followed by 2% BSA in coating buffer for 1 hr at 37°C to block non-specific binding sites. Cells were diluted to 1×10⁶/mL in buffer A (HBSS, 0.5% BSA) containing 1 mM Ca2+ + Mg2+ immediately before infusion in the flow chamber. Cells were infused into flow chamber at a consistent shear stress of 1 dyn/cm2 for 1 min. The motion of each adherent cell was monitored for 10 s following the initial adhesion point, and two categories of cell adhesion (rolling and firm adhesion) were defined. Adhesion was defined as rolling adhesion if the adherent cells were followed by rolling motions ≥ 5 s with a velocity of at least 1 μm/s; a firmly adherent cell was defined as a cell that remained adherent and stationary for at least 10 s.
Chemokine-induced transwell migration
Chemokine-induced transwell migration was performed as described (Kliche et al., 2012). Both sides of transwell chambers (5 μm pore, Millipore) were coated with 5 μg/mL mouse VCAM-1-Fc, MAdCAM-1-Fc or ICAM-1-Fc. T cells were added to the upper chamber and the lower chamber was filled with RPMI 1640 medium with CCL21 (500 ng/mL). After incubation at 37°C for 4 hr, cells remaining on the upper surface of the chamber were scraped with a cotton swab, and cells migrating to the bottom surface were counted.
Co-immunoprecipitation and immunoblot
Cells were treated with 5 mM DTBP (Thermo Fisher Scientific) for 30 min, and then cell membrane fractions were isolated and lysed with lysis buffer (TBS containing 1% Triton X-100, 0.05% NP-40, Complete Protease Inhibitor Cocktail, 1 mM Ca2+ + Mg2+) for 30 min on ice. The lysates were then immunoprecipitated with indicated antibodies. Rabbit IgG was used as a control. β-actin was detected by immune blot as a loading control.
Precipitation with integrin tail model proteins
The design, production and purification of integrin tail model proteins were performed as described (Liu et al., 1999). Ni2+-charged resins loaded with indicated integrin tail model proteins were incubated with T cell lysate for 2 hr at 4°C. After washing twice to remove unbound proteins with buffer (50 mM NaCl, 10 mM Pipes, 150 mM sucrose, 50 mM NaF, 40 mM Na4P2O7·10 H2O, 1 mM Na3VO4, 1% Triton X-100, pH 6.8), the precipitates were detected by immunoblot using indicated antibodies.
Protein expression and purification
Recombinant mouse Hsp90 proteins fused with GST tag were produced and purified in Escherichia coli strain Rosetta BL21 (DE3) according to the manufacturer’s instructions (GE Healthcare).
Intravital microscopy
Intravital microscopy of inguinal lymph nodes was done as described (Chen et al., 2006; von Andrian, 1996). 2.5 × 10⁷ T cells from WT and Itga4R985A/R985A mice were pre-treated at 37°C or 40°C for 12 hr, then labeled with calcein and injected into the right femoral artery of WT C57BL/6J mice. The left inguinal lymph node was exposed and the surrounding fatty tissue was removed to expose the lymph node microvasculature. Cells were visualized with a customized intravital microscopy system (Axio Zoom.V16, ZEISS). The transient tethering fraction was defined as cells tethered to HEVs for a certain time and then detached in the flow; rolling fraction was defined as cells with movement detectably slower than the speed of non-interacting cells; sticking fraction was defined as cells adhered to HEVs for 30 s or more. Each fraction was shown as the percentage of total cells passing through the vessel during the observation period.
In vivo homing assay
Homing of T cells to inguinal lymph nodes was assessed by a short-term homing assay (Berlin-Rufenach et al., 1999). 5 × 10⁶ T cells from WT or Itga4R985A/R985A mice were pre-treated at 37°C or 40°C in culture medium for 12 hr. Then cells were labeled with calcein and incubated with PBS or PS/2 (10 μg/mL) for 15 min at room temperature, then injected intravenously into WT C57BL/6J mice. Inguinal lymph nodes were collected 1 hr after cell transfer. The homing index was calculated as the percentage of the homed T cells in inguinal lymph nodes relative to WT T cells pre-treated at 37°C without PS/2 antibody treatment.
Soluble ligand binding assay
The soluble ligand binding assay was performed as described (Lu et al., 2016). 5 μg/mL VCAM-1-Fc or MAdCAM-1-Fc fusion protein was pre-incubated with APC-conjugated goat anti-human IgG in 50 mL of HEPES-buffered saline (20 mM HEPES, pH 7.4) containing 1 mM Ca2+ + Mg2+ and then incubated with cells for 30 min at room temperature. Cells were washed twice before flow cytometry analysis. As a control, cells were pre-incubated with 10 μg/mL α4 blocking antibody PS/2 or α4β7 blocking antibody DATK32 for 5 min at 37°C before addition of VCAM-1-Fc or MAdCAM-1-Fc complexes.
Fluorescence resonance energy transfer (FRET)
Integrin intramolecular FRET was measured as described (Pan et al., 2010). For detecting the orientation of integrin ectodomain relative to cell membrane, cells were seeded on poly-L-Lysine (100 μg/mL) coated surface in HEPES-buffered saline (20 mM HEPES, pH 7.4) containing 1 mM Ca2+ + Mg2+ and incubated for 30 min at 37°C. Adherent cells were fixed with 3.7% paraformaldehyde for 15 min at room temperature and non-specific sites were blocked by incubation with 10% serum rich medium for 10 min at room temperature. Then cells were stained with 10 μg/mL Alexa Fluor 488-conjugated PS/2 Fab fragment for 30 min at 37°C. After two washes, cells were labeled with 10 mM FM 4–64FX (Invitrogen) for 1 min on ice, washed once, immediately mounted with Mowiol® 4–88 (Polysciences Inc.) mounting solution under a coverslip. The mounted slides were kept in the dark and subjected to photobleach FRET acquisition by a confocal microscope (TCS SP8, Leica). FRET efficiency (E) was calculated as E = 1-(Fdonor(d)Pre/Fdonor(d)Post), where Fdonor(d)Pre and Fdonor(d)Post are the mean donor emission intensity of pre- and post-photobleaching.
Silencing of talin, kindlin-3 and α4 in T cells
Silencing of mouse talin, kindlin-3 or α4 expression in T cells was achieved by shRNA. Cells with talin, kindlin-3 or α4 silencing were generated by infection with the recombinant lentivirus, which express the shRNAs that annealed to talin (shTalin-1#: 5′-GCAGAAGG GAGAGCGTAAGAT-3′; shTalin-2#: 5′-GAAGCACAGAGCCGATTGAAT-3′), annealed to kindlin-3 (shKindlin-3–1#: 5′-GCCTCATG CAGCAAGGTATCA-3′; shKindlin-3–2#: 5′-GGTTCCAGCGAAAGTTCAAGG-3′), or annealed to α4 (shITGA4: 5′-GTGTATGGATC TAGCGAAG-3′). Silencing of talin or kindlin-3 was confirmed by immunoblot 48 hr after transfection.
Integrin clustering
T cells expressing WT α4 integrin-split-GFP or α4(R985A) integrin-split-GFP were pre-treated at 37°C or 40°C in culture medium for 12 hr and then fixed in suspension with 3.7% paraformaldehyde in PBS at room temperature for 10 min. Anti-α4 monoclonal antibody PS/2 (10 μg/mL) was used to stain integrin α4 at room temperature for 2 hr, followed by staining with Cy3-conjugated goat anti-rat IgG (5 μg/mL) at room temperature for 1 hr. Coverslips were then mounted with Mowiol® 4–88 (Polysciences Inc.) and images were obtained with Leica TCS SP8 confocal microscope under a 63 × oil objective.
Rho GTPases activation assay
Cells were lysed and the supernatants were used to carry out a GST precipitation assay to detect the Rho GTPases activation. GTP-bound RhoA was assayed by binding to recombinant GST-fused Rho-binding domain of the effector Rhotekin (GST-RBD) as described (Pertz et al., 2006). GTP-bound Rac1 and Cdc42 were assayed by binding to recombinant GST-fused p21-binding domain of PAK1 (GST-PBD) as described (Price et al., 1998). RhoA, Rac1 and Cdc42 activation were normalized to total RhoA, Rac1 and Cdc42, respectively.
Treatment with fever-range WBH
Mice were treated with fever-range WBH (core temperature of 39.5 ± 0.5°C for 6 hr) by being placed in an environmental chamber at 38.8°C (ZRQ-150, GEMTOP) as described (Chen et al., 2006). Normothermia control mice (core temperature 36.8 ± 0.2°C) were maintained at 22°C for the experimental period. The total numbers of T cells in PLNs (pooled inguinal, brachial, axillary, sciatic, superficial and deep cervical nodes), MLNs, PPs, spleen and PB were quantified. n = 7–10 mice per group.
In vivo S. typhimurium infection
In vivo mouse model of S. typhimurium infection was established as described (Mathur et al., 2012). WT and Itga4R985A/R985A C57BL/ 6J mice were orally infected with S. typhimurium (108 CFU per mouse) using a gavage needle. Rectal temperature of mice was monitored with BAT-12 Microprobe Thermometer (Physitemp). Survival was monitored by daily observation and Kaplan Meier survival graphs were generated by Prism software (GraphPad, version 5.01). n = 4–12 mice were taken for each condition. Significance was calculated and as given. The S. typhimurium strain SL1344 was a kind gift from Prof. WeiHuan Fang (Zhejiang University, China) and Prof. HongYan Wang (Shanghai Institute of Biochemistry and Cell Biology, Chinese Academy of Sciences, China).
RNA isolation and real-time quantitative PCR
Total RNA was extracted from mouse primary T cells with TRIzol reagent according to the manufacturer’s instructions (Invitrogen). For cDNA synthesis, RNA was reverse-transcribed with an M-MLV reverse transcriptase (Promega). Then cDNA was amplified by real-time PCR with a SYBR® Premix Ex Taq (TaKaRa) on an ABI Prism 7500 sequence detector (Applied Biosystems). Real-time PCR primers (5′−3′) were S1PR1-F: ATGGTGTCCACTAGCATCCC, S1PR1-R: CGATGTTCAACTTGCCTGTGTAG; GAPDH-F: AGGTCGGTGTGAACGGATTTG, GAPDH-R: TGTAGACCATGTAGTTGAGGTCA; Hsp90AA1-F: AATGCTTAGAACTATTTACTGAAC TAGCAGAA, Hsp90AA1-R: GTCCTCGTGAATTCCAAGCTTT; Hsp90AB1-F: GCGCACGCTGACTTTGGT, Hsp90AB1-R: CCTGGA GAGCCTCCATGAAC. The expression of target genes was normalized to expression of the housekeeping gene GAPDH.
Histology and immunofluorescence microscopy
4% paraformaldehyde-fixed, paraffin-embedded small intestine sections were mounted on glass slides and followed by hematoxylin and eosin (H&E) staining. For immunofluorescence analysis, frozen sections were made permeable with cold acetone and blocked with 1% BSA. Samples were incubated with PerCP-Cy5.5 anti-CD3e (5 μg/mL) and counterstaining of nuclei was with DAPI (1 μg/mL). Images were acquired with a Leica TCS SP8 confocal microscope.
QUANTIFICATION AND STATISTICAL ANALYSIS
Statistical significance was determined by Student’s t test or one-way ANOVA with Dunnett post-tests using Prism software (GraphPad, version 5.01). The Student’s t test was used to analyze data from two groups. The ANOVA test was used to analyze experiments involving multiple tests. For the bar graph, one representative experiment of at least three independent experiments is shown. For the dot plot graph, each dot point represents one independent biological replicate. The resulting p values are indicated as follows: ns, not significant; *, p < 0.05; **, p < 0.01; ***, p < 0.001. Data represent the mean ± SEM of at least three independent experiments.
DATA AND SOFTWARE AVAILABILITY
Raw and analyzed data have been deposited in Mendeley Data and can be found online at https://doi.org/10.17632/63yhwfmzjk.1.
Supplementary Material
KEY RESOURCES TABLE.
| REAGENT or RESOURCE | SOURCE | IDENTIFIER |
|---|---|---|
| Antibodies | ||
| Rabbit monoclonal anti-α4 integrin (clone EPR1355Y) | Abcam | Cat# 2101-1; RRID: AB_991702 |
| Rabbit monoclonal anti-β2 integrin (clone EP1286Y) | Abcam | Cat# 1890-1; RRID: AB_764494 |
| Mouse monoclonal anti-αX integrin (clone 3.9) | Abcam | Cat# ab11029; RRID: AB_297683 |
| Rabbit polyclonal anti-Hsp90AA1 | Abcam | Cat# ab2928; RRID: AB_303423 |
| Rabbit polyclonal anti-Hsp90AB1 | Abcam | Cat# ab2927; RRID: AB_303422 |
| Rabbit monoclonal anti-FAK (phospho Y397) (clone EP2160Y) |
Abcam | Cat# 2211-1; RRID: AB_1267144 |
| Rabbit monoclonal anti-RhoA (clone EPR18134) | Abcam | Cat# ab187027 |
| Rat monoclonal FITC anti-MAdCAM-1 (clone MECA-367) | Abcam | Cat# ab24941; RRID: AB_2139543 |
| Rabbit polyclonal anti-Hsp10 (HSPE1) | ABclonal | Cat# A7437 |
| Rabbit polyclonal anti-Hsp40 (DNAJB1) | ABclonal | Cat# A5504 |
| Rabbit polyclonal anti-Hsp60 (HSPD1) | ABclonal | Cat# A0969 |
| Rabbit polyclonal anti-Hsp70 (HSPA1A) | ABclonal | Cat# A0284 |
| Rabbit polyclonal anti-Hsp110 (HSPH1) | ABclonal | Cat# A6622 |
| Rabbit polyclonal anti-GST tag | ABclonal | Cat# AE006 |
| Rat monoclonal PE anti-α4 integrin (clone 9C10) | BD Biosciences | Cat# 557420; RRID: AB_396693 |
| Rat monoclonal PE anti-αL integrin (clone 2D7) | BD Biosciences | Cat# 553121; RRID: AB_394637 |
| Rat monoclonal PE anti-β2 integrin (clone C71/16) | BD Biosciences | Cat# 553293; RRID: AB_394762 |
| Mouse monoclonal anti-Paxillin (clone 349) | BD Biosciences | Cat# 612405; RRID: AB_647289 |
| Mouse monoclonal anti-FAK (clone 77) | BD Biosciences | Cat# 610088; RRID: AB_397495 |
| Mouse monoclonal anti-Rac1 (clone 102) | BD Biosciences | Cat# 610650; RRID: AB_397977 |
| Mouse monoclonal anti-Cdc42 (clone 44) | BD Biosciences | Cat# 610928; RRID: AB_398243 |
| Hamster monoclonal PerCP-Cy™5.5 anti-CD3e (clone 145–2C11) | BD Biosciences | Cat# 551163; RRID: AB_394082 |
| Rat monoclonal PE anti-Ly-6G (clone 1A8) | BD Biosciences | Cat# 551461; RRID: AB_394208 |
| Rat monoclonal PE/Cy7 anti-αM integrin (clone M1/70) | Biolegend | Cat# 101215; RRID: AB_312798 |
| Rat monoclonal APC anti-αM integrin (clone M1/70) | Biolegend | Cat# 101211; RRID: AB_312794 |
| Hamster monoclonal PE anti-αX integrin (clone N418) | Biolegend | Cat# 117307; RRID: AB_313776 |
| Rat monoclonal PE anti-mouse CD197 (CCR7, clone 4B12) | Biolegend | Cat# 120106; RRID: AB_389358 |
| Rat monoclonal PerCP/Cy5.5 anti-Ly-6C (clone HK1.4) | Biolegend | Cat# 128011; RRID: AB_1659242 |
| Rabbit monoclonal anti-Kindlin-3 (clone D8I7V) | Cell Signaling Technology | Cat# 10459 |
| Mouse monoclonal anti-β-actin (clone 6G3) | Multi Sciences | Cat# ab008 |
| Rabbit anti-αD integrin | Novus | Cat# NBP1-90237; RRID: AB_11036350 |
| Hamster monoclonal FITC anti-β1 integrin | Santa Cruz | Cat# sc-19656; RRID: AB_627005 |
| Mouse monoclonal anti-Talin (clone 8d4) | Sigma-Aldrich | Cat# T3287; RRID: AB_477572 |
| Mouse monoclonal anti-HA tag (clone HA-7) | Sigma-Aldrich | Cat# H9658; RRID: AB_260092 |
| Rat monoclonal anti-α4 integrin (clone PS/2) | Berlin-Rufenach et al., 1999 | N/A |
| Rat monoclonal anti-α4β7 integrin (clone DATK32) | Berlin-Rufenach et al., 1999 | N/A |
| Rat monoclonal anti-β7 integrin (clone FIB504) | Sun et al., 2014 | N/A |
| Hamster monoclonal anti-β2 integrin (clone 2E6) | This paper | N/A |
| Rat monoclonal anti-VCAM-1 (MK2.7) | Berlin-Rufenach et al., 1999 | N/A |
| Bacterial and Virus Strains | ||
| Salmonella typhimurium | Mathur et al., 2012 | Cat# SL1344; RRID: WB-STRAIN:SL1344 |
| Escherichia coli strain Rosetta BL21 (DE3) | This paper | N/A |
| Chemicals, Peptides, and Recombinant Proteins | ||
| Recombinant Mouse ICAM-1/CD54 Fc Chimera Protein | R&D Systems | Cat# 796-IC-050 |
| Recombinant Mouse CCL21/6Ckine Protein | R&D Systems | Cat# 457-6C-025 |
| Pertussis Toxin | Merck Millipore | Cat# 516560-50UGCN |
| LPS | Merck Millipore | Cat# LPS25 |
| cOmplete™, Mini, EDTA-free Protease Inhibitor Cocktail | Roche | Cat# 4693159001 |
| PhosSTOP™ phosphatase inhibitor tablets | Roche | Cat# 4906837001 |
| Taq DNA Polymerase | Vazyme | Cat# P101 |
| DTBP | Thermo Fisher Scientific | Cat# 20665 |
| FM™ 4-4FX | Invitrogen | Cat# F34653 |
| TRIzol™ Reagent | Invitrogen | Cat# 15596026 |
| Mowiol® 4–88 | Polysciences Inc. | Cat# 17951-1 |
| M-MLV Reverse Transcriptase | Promega | Cat# M1701 |
| SYBR® Premix Ex Taq™ | TaKaRa | Cat# RR420L |
| DAPI | Sigma-Aldrich | Cat# D9542; CAS: 28718-90-3 |
| Critical Commercial Assays | ||
| EasySep™ Mouse T Cell Isolation Kit | STEMCELL Technologies | Cat# 19851 |
| Deposited Data | ||
| Raw and analyzed data | Mendeley Data | https://doi.org/10.17632/63yhwfmzjk.1 |
| Experimental Models: Cell Lines | ||
| PS/2 | ATCC | Cat# CRL-1911 |
| DATK32 | ATCC | Cat# HB-294 |
| FIB504 | ATCC | Cat# HB-293 |
| 2E6 | ATCC | Cat# HB-226 |
| MK2.7 | ATCC | Cat# CRL-1909 |
| 293T | ATCC | Cat# CRL-3216 |
| Experimental Models: Organisms/Strains | ||
| Mouse: C57BL/6J | Jackson Laboratory | Cat# JAX:000664, RRID: IMSR_JAX:000664 |
| Mouse: Itga4R985A/R985A C57BL/6J | This paper | N/A |
| Recombinant DNA | ||
| pHLsec-VCAM-1/Fc | This paper | N/A |
| pHLsec-MAdCAM-1/Fc | This paper | N/A |
| psPAX2 | Addgene#12260 | N/A |
| pMD2.G | Addgene#12259 | N/A |
| pCDH-Hsp90AA1 | This paper | N/A |
| pCDH-Hsp90AB1 | This paper | N/A |
| pET-Duet-α4 tail | This paper | N/A |
| pET-Duet-b1 tail | This paper | N/A |
| pET-Duet-b7 tail | This paper | N/A |
| pET-Duet-α4 tail-D991 | This paper | N/A |
| pET-Duet-α4 tail-D982 | This paper | N/A |
| pET-Duet-α4 tail-D974 | This paper | N/A |
| pET-Duet-α4 tail-E983A | This paper | N/A |
| pET-Duet-α4 tail-N984A | This paper | N/A |
| pET-Duet-α4 tail-R985A | This paper | N/A |
| pET-Duet-α4 tail-R986A | This paper | N/A |
| pET-Duet-α4 tail-D987A | This paper | N/A |
| pET-Duet-α4 tail-S988A | This paper | N/A |
| pET-Duet-α4 tail-W989A | This paper | N/A |
| pET-Duet-α4 tail-S990A | This paper | N/A |
| pET-Duet-α4 tail-Y991A | This paper | N/A |
| pET-Duet-α4 tail-S988D | This paper | N/A |
| pCDH-Hsp90AA1-NTD-HA | This paper | N/A |
| pCDH-Hsp90AA1-MD-HA | This paper | N/A |
| pCDH-Hsp90AA1-CTD-HA | This paper | N/A |
| pCDH-Hsp90AB1-NTD-HA | This paper | N/A |
| pCDH-Hsp90AB1-MD-HA | This paper | N/A |
| pCDH-Hsp90AB1-CTD-HA | This paper | N/A |
| pGEX-6P-1-Hsp90AA1-NTD | This paper | N/A |
| pGEX-6P-1-Hsp90AA1-CTD | This paper | N/A |
| pGEX-6P-1-Hsp90AB1-NTD | This paper | N/A |
| pGEX-6P-1-Hsp90AB1-CTD | This paper | N/A |
| pLKO.1-shTalin-1# | This paper | N/A |
| pLKO.1-shTalin-2# | This paper | N/A |
| pLKO.1-shKindlin-3-1# | This paper | N/A |
| pLKO.1-shKindlin-3-2# | This paper | N/A |
| pLKO.1-shITGA4 | This paper | N/A |
| pLKO.1-scramble | This paper | N/A |
| pCDH-α4 (shRNA resistant)-GFP S1-10 | This paper | N/A |
| pCDH-α4 (shRNA resistant)-GFP S11 | This paper | N/A |
| pCDH-α4 (R985A, shRNA resistant)-GFP S1-10 | This paper | N/A |
| pCDH-α4 (R985A, shRNA resistant)-GFP S11 | This paper | N/A |
| pCDH-Hsp90AA1-HA | This paper | N/A |
| pCDH-Hsp90AA1-NM-HA | This paper | N/A |
| pCDH-Hsp90AA1-MC-HA | This paper | N/A |
| pCDH-Hsp90AA1-NC5-HA | This paper | N/A |
| pCDH-Hsp90AB1-HA | This paper | N/A |
| pCDH-Hsp90AB1-NM-HA | This paper | N/A |
| pCDH-Hsp90AB1-MC-HA | This paper | N/A |
| pCDH-Hsp90AB1-NC5-HA | This paper | N/A |
| pCDH-Hsp40 | This paper | N/A |
| pCDH-Hsp60 | This paper | N/A |
| pCDH-Hsp70 | This paper | N/A |
| pCDH-Hsp90AA1-CTD-NC5-HA | This paper | N/A |
| pCDH-Hsp90AB1-CTD-NC5-HA | This paper | N/A |
| pCDH-Hsp90AA1-D93N-HA | This paper | N/A |
| pCDH-Hsp90AB1-D88N-HA | This paper | N/A |
| Software and Algorithms | ||
| Graphpad Prism 5.01 software | GraphPad | http://www.graphpad.com/ |
| FlowJo 7.6.1 software | FlowJo | http://www.flowjo.com |
| Image-Pro Plus 6.0.0.260 | Media Cybernetics | http://www.mediacy.com/ |
| LAS AF Lite 3.1.0 | Leica | http://www.leica.com/ |
| ImageJ | NIH software | http://imagej.nih.gov/ij/; RRID: SCR_003070 |
| Adobe Illustrator CS5 | Adobe | http://www.adobe.com |
| Adobe Photoshop CS4 | Adobe | http://www.adobe.com |
Highlights.
Fever promotes α4-integrin-mediated T cell adhesion and transmigration
Hsp90 binds to α4 tails and activates α4 integrins via inside-out signaling
Hsp90 triggers dimerization and clustering of α4 integrins to activate FAK-RhoA
Disruption of Hsp90-α4 interaction impairs fever-induced T cell trafficking
ACKNOWLEDGMENTS
This work was supported by grants from the National Natural Science Foundation of China (31525016, 31830112, 31601129, 31701219, and 31190061), National Basic Research Program of China (2014CB541905), Personalized Medicines-Molecular Signature-based Drug Discovery and Development, the Strategic Priority Research Program of the Chinese Academy of Sciences (XDA12010101), China Postdoctoral Science Foundation (2016M601670), and the CAS/SAFEA International Partnership Program for Creative Research Teams. The authors gratefully acknowledge the support of SA-SIBS scholarship program. We thank the Genome Tagging Project (GTP) Center, Shanghai Institute of Biochemistry and Cell Biology, Chinese Academy of Sciences for technical support.
Footnotes
DECLARATION OF INTERESTS
The authors declare no competing interests.
SUPPLEMENTAL INFORMATION
Supplemental Information includes seven figures and one table and can be found with this article online at https://doi.org/10.1016/j.immuni.2018.11.013.
REFERENCES
- Berlin-Rufenach C, Otto F, Mathies M, Westermann J, Owen MJ, Hamann A, and Hogg N (1999). Lymphocyte migration in lymphocyte function-associated antigen (LFA)-1-deficient mice. J. Exp. Med 189, 1467–1478. [DOI] [PMC free article] [PubMed] [Google Scholar]
- Boscacci RT, Pfeiffer F, Gollmer K, Sevilla AI, Martin AM, Soriano SF, Natale D, Henrickson S, von Andrian UH, Fukui Y, et al. (2010). Comprehensive analysis of lymph node stroma-expressed Ig superfamily members reveals redundant and nonredundant roles for ICAM-1, ICAM-2, and VCAM-1 in lymphocyte homing. Blood 116, 915–925. [DOI] [PMC free article] [PubMed] [Google Scholar]
- Butcher EC, and Picker LJ (1996). Lymphocyte homing and homeostasis. Science 272, 60–66. [DOI] [PubMed] [Google Scholar]
- Cabantous S, and Waldo GS (2006). In vivo and in vitro protein solubility assays using split GFP. Nat. Methods 3, 845–854. [DOI] [PubMed] [Google Scholar]
- Calderwood DA, Campbell ID, and Critchley DR (2013). Talins and kindlins: partners in integrin-mediated adhesion. Nat. Rev. Mol. Cell Biol 14, 503–517. [DOI] [PMC free article] [PubMed] [Google Scholar]
- Carman CV, and Springer TA (2004). A transmigratory cup in leukocyte diapedesis both through individual vascular endothelial cells and between them. J. Cell Biol 167, 377–388. [DOI] [PMC free article] [PubMed] [Google Scholar]
- Chen J, Salas A, and Springer TA (2003). Bistable regulation of integrin adhesiveness by a bipolar metal ion cluster. Nat. Struct. Biol 10, 995–1001. [DOI] [PubMed] [Google Scholar]
- Chen Q, Wang WC, Bruce R, Li H, Schleider DM, Mulbury MJ, Bain MD, Wallace PK, Baumann H, and Evans SS (2004). Central role of IL-6 receptor signal-transducing chain gp130 in activation of L-selectin adhesion by fever-range thermal stress. Immunity 20, 59–70. [DOI] [PubMed] [Google Scholar]
- Chen Q, Fisher DT, Clancy KA, Gauguet JM, Wang WC, Unger E, Rose-John S, von Andrian UH, Baumann H, and Evans SS (2006). Fever-range thermal stress promotes lymphocyte trafficking across high endothelial venules via an interleukin 6 trans-signaling mechanism. Nat. Immunol 7, 1299–1308. [DOI] [PubMed] [Google Scholar]
- Evans SS, Bain MD, and Wang WC (2000). Fever-range hyperthermia stimulates alpha4beta7 integrin-dependent lymphocyte-endothelial adhesion. Int. J. Hyperthermia 16, 45–59. [DOI] [PubMed] [Google Scholar]
- Evans SS, Wang WC, Bain MD, Burd R, Ostberg JR, and Repasky EA (2001). Fever-range hyperthermia dynamically regulates lymphocyte delivery to high endothelial venules. Blood 97, 2727–2733. [DOI] [PubMed] [Google Scholar]
- Evans SS, Repasky EA, and Fisher DT (2015). Fever and the thermal regulation of immunity: the immune system feels the heat. Nat. Rev. Immunol 15, 335–349. [DOI] [PMC free article] [PubMed] [Google Scholar]
- Goldfinger LE, Han J, Kiosses WB, Howe AK, and Ginsberg MH (2003). Spatial restriction of alpha4 integrin phosphorylation regulates lamellipodial stability and alpha4beta1-dependent cell migration. J. Cell Biol 162, 731–741. [DOI] [PMC free article] [PubMed] [Google Scholar]
- Hahne M, Lenter M, Jäger U, Isenmann S, and Vestweber D (1993). VCAM-1 is not involved in LPAM-1 (alpha 4 beta p/alpha 4 beta 7) mediated binding of lymphoma cells to high endothelial venules of mucosa-associated lymph nodes. Eur. J. Cell Biol 61, 290–298. [PubMed] [Google Scholar]
- Han J, Liu S, Rose DM, Schlaepfer DD, McDonald H, and Ginsberg MH (2001). Phosphorylation of the integrin alpha 4 cytoplasmic domain regulates paxillin binding. J. Biol. Chem 276, 40903–40909. [DOI] [PubMed] [Google Scholar]
- Hogg N, Patzak I, and Willenbrock F (2011). The insider’s guide to leukocyte integrin signalling and function. Nat. Rev. Immunol 11, 416–426. [DOI] [PubMed] [Google Scholar]
- Infante E, and Ridley AJ (2013). Roles of Rho GTPases in leucocyte and leukaemia cell transendothelial migration. Philos. Trans. R. Soc. Lond. B Biol. Sci 368, 20130013. [DOI] [PMC free article] [PubMed] [Google Scholar]
- Jones BD, Ghori N, and Falkow S (1994). Salmonella typhimurium initiates murine infection by penetrating and destroying the specialized epithelial M cells of the Peyer’s patches. J. Exp. Med 180, 15–23. [DOI] [PMC free article] [PubMed] [Google Scholar]
- Kinashi T (2005). Intracellular signalling controlling integrin activation in lymphocytes. Nat. Rev. Immunol 5, 546–559. [DOI] [PubMed] [Google Scholar]
- Kliche S, Worbs T, Wang X, Degen J, Patzak I, Meineke B, Togni M, Moser M, Reinhold A, Kiefer F, et al. (2012). CCR7-mediated LFA-1 functions in T cells are regulated by 2 independent ADAP/SKAP55 modules. Blood 119, 777–785. [DOI] [PubMed] [Google Scholar]
- Kobayakawa T, Yamada S, Mizuno A, and Nemoto TK (2008). Substitution of only two residues of human Hsp90alpha causes impeded dimerization of Hsp90beta. Cell Stress Chaperones 13, 97–104. [DOI] [PMC free article] [PubMed] [Google Scholar]
- Kuijpers TW (1995). Pathophysiological aspects of VLA-4 interactions and possibilities for therapeutical interventions. Springer Semin. Immunopathol 16, 379–389. [DOI] [PubMed] [Google Scholar]
- Ley K, Laudanna C, Cybulsky MI, and Nourshargh S (2007). Getting to the site of inflammation: the leukocyte adhesion cascade updated. Nat. Rev. Immunol 7, 678–689. [DOI] [PubMed] [Google Scholar]
- Liu S, and Ginsberg MH (2000). Paxillin binding to a conserved sequence motif in the alpha 4 integrin cytoplasmic domain. J. Biol. Chem 275, 22736–22742. [DOI] [PubMed] [Google Scholar]
- Liu S, Thomas SM, Woodside DG, Rose DM, Kiosses WB, Pfaff M, and Ginsberg MH (1999). Binding of paxillin to alpha4 integrins modifies integrin-dependent biological responses. Nature 402, 676–681. [DOI] [PubMed] [Google Scholar]
- Lu L, Lin C, Yan Z, Wang S, Zhang Y, Wang S, Wang J, Liu C, and Chen J (2016). Kindlin-3 is essential for the resting alpha4beta1 integrinmediated firm cell adhesion under shear flow conditions. J. Biol. Chem 291, 10363–10371. [DOI] [PMC free article] [PubMed] [Google Scholar]
- Mathur R, Oh H, Zhang D, Park SG, Seo J, Koblansky A, Hayden MS, and Ghosh S (2012). A mouse model of Salmonella typhi infection. Cell 151, 590–602. [DOI] [PMC free article] [PubMed] [Google Scholar]
- Matloubian M, Lo CG, Cinamon G, Lesneski MJ, Xu Y, Brinkmann V, Allende ML, Proia RL, and Cyster JG (2004). Lymphocyte egress from thymus and peripheral lymphoid organs is dependent on S1P receptor 1. Nature 427, 355–360. [DOI] [PubMed] [Google Scholar]
- May MJ, Entwistle G, Humphries MJ, and Ager A (1993). VCAM-1 is a CS1 peptide-inhibitable adhesion molecule expressed by lymph node high endothelium. J. Cell Sci 106, 109–119. [DOI] [PubMed] [Google Scholar]
- Meng X, Devin J, Sullivan WP, Toft D, Baulieu EE, and Catelli MG (1996). Mutational analysis of Hsp90 alpha dimerization and subcellular localization: dimer disruption does not impede “in vivo’ interaction with estrogen receptor. J. Cell Sci 109, 1677–1687. [DOI] [PubMed] [Google Scholar]
- Mitra SK, Hanson DA, and Schlaepfer DD (2005). Focal adhesion kinase: in command and control of cell motility. Nat. Rev. Mol. Cell Biol 6, 56–68. [DOI] [PubMed] [Google Scholar]
- Nakai A, Hayano Y, Furuta F, Noda M, and Suzuki K (2014). Control of lymphocyte egress from lymph nodes through β2-adrenergic receptors. J. Exp. Med 211, 2583–2598. [DOI] [PMC free article] [PubMed] [Google Scholar]
- Obermann WM, Sondermann H, Russo AA, Pavletich NP, and Hartl FU (1998). In vivo function of Hsp90 is dependent on ATP binding and ATP hydrolysis. J. Cell Biol 143, 901–910. [DOI] [PMC free article] [PubMed] [Google Scholar]
- Oka T, Oka K, Kobayashi T, Sugimoto Y, Ichikawa A, Ushikubi F, Narumiya S, and Saper CB (2003). Characteristics of thermoregulatory and febrile responses in mice deficient in prostaglandin EP1 and EP3 receptors. J. Physiol 551, 945–954. [DOI] [PMC free article] [PubMed] [Google Scholar]
- Pan Y, Zhang K, Qi J, Yue J, Springer TA, and Chen J (2010). Cation-pi interaction regulates ligand-binding affinity and signaling of integrin alpha4beta7. Proc. Natl. Acad. Sci. USA 107, 21388–21393. [DOI] [PMC free article] [PubMed] [Google Scholar]
- Pertz O, Hodgson L, Klemke RL, and Hahn KM (2006). Spatiotemporal dynamics of RhoA activity in migrating cells. Nature 440, 1069–1072. [DOI] [PubMed] [Google Scholar]
- Price LS, Leng J, Schwartz MA, and Bokoch GM (1998). Activation of Rac and Cdc42 by integrins mediates cell spreading. Mol. Biol. Cell 9, 1863–1871. [DOI] [PMC free article] [PubMed] [Google Scholar]
- Radovanac K, Morgner J, Schulz JN, Blumbach K, Patterson C, Geiger T, Mann M, Krieg T, Eckes B, Fässler R, and Wickström SA (2013). Stabilization of integrin-linked kinase by the Hsp90-CHIP axis impacts cellular force generation, migration and the fibrotic response. EMBO J. 32, 1409–1424. [DOI] [PMC free article] [PubMed] [Google Scholar]
- Schlesinger MJ (1990). Heat shock proteins. J. Biol. Chem 265, 12111–12114. [PubMed] [Google Scholar]
- Shi C, and Pamer EG (2011). Monocyte recruitment during infection and inflammation. Nat. Rev. Immunol 11, 762–774. [DOI] [PMC free article] [PubMed] [Google Scholar]
- Sun H, Liu J, Zheng Y, Pan Y, Zhang K, and Chen J (2014). Distinct chemokine signaling regulates integrin ligand specificity to dictate tissue-specific lymphocyte homing. Dev. Cell 30, 61–70. [DOI] [PubMed] [Google Scholar]
- Taipale M, Jarosz DF, and Lindquist S (2010). HSP90 at the hub of protein homeostasis: emerging mechanistic insights. Nat. Rev. Mol. Cell Biol 11, 515–528. [DOI] [PubMed] [Google Scholar]
- von Andrian UH (1996). Intravital microscopy of the peripheral lymph node microcirculation in mice. Microcirculation 3, 287–300. [DOI] [PubMed] [Google Scholar]
- von Andrian UH, and Mempel TR (2003). Homing and cellular traffic in lymph nodes. Nat. Rev. Immunol 3, 867–878. [DOI] [PubMed] [Google Scholar]
- Xiong X, Wang Y, Liu C, Lu Q, Liu T, Chen G, Rao H, and Luo S (2014). Heat shock protein 90β stabilizes focal adhesion kinase and enhances cell migration and invasion in breast cancer cells. Exp. Cell Res 326, 78–89. [DOI] [PMC free article] [PubMed] [Google Scholar]
Associated Data
This section collects any data citations, data availability statements, or supplementary materials included in this article.
Supplementary Materials
Data Availability Statement
Raw and analyzed data have been deposited in Mendeley Data and can be found online at https://doi.org/10.17632/63yhwfmzjk.1.