Abstract
A new product prototype system for diagnosing vision and neurological disorders, called NeuroDotVR, is described herein: this system utilizes a novel wireless NeuroDot brain sensor [Versek C et al. J Neural Eng. 2018 Aug; 15(4):046027] that quantitatively measures visual evoked potentials and fields resulting from custom visual stimuli displayed on a smartphone housed in a virtual reality headset. The NeuroDot brain sensor is unique in that it can be operated both in regular electroencephalography mode, as well as a new electric field encephalography mode, which yields improvements in signal sensitivity and provides new diagnostic information. Steady state and transient visual evoked potentials and fields using reversing checkerboard stimuli are presented with case studies in amblyopia, glaucoma, and dark adaptation. These preliminary data sets highlight potential clinical applications that may be pursued in further product development and scientific studies.
Keywords: neurology, ophthalmology, EEG, vision diagnostics, portable system, TBI, glaucoma, amblyopia, VEP
INTRODUCTION
Military personnel are particularly susceptible to visual impairment even if refractive vision is 20/20 arising from several factors associated with their professional duties such as blast exposure, eye injury, concussion, or traumatic brain injury (TBI).1–3 Visual disorders involve dysfunction of the eye-brain system (the interior and exterior parts of the eye, extraocular muscles, optic nerve, and dedicated regions of the mid-brain and occipital lobes of the cortex) and can be distinct even from cognitive dysfunction that is commonly associated with TBI.4,5 However, optometrists and ophthalmologists seeking to diagnose and treat such disorders may be burdened with tools that are cumbersome to use, resulting in long set up or measurement times, have low signal quality, or lack objective evaluation.2 Furthermore, many new visual rehabilitation methods involve perceptual training on visual displays and assessment of such functional remediation cannot easily be integrated with therapy.6,7
Photoreceptors in the eye convert visual stimuli to electrical signals that are then processed by the brain, resulting in electric fields and potentials called visual evoked potentials (VEPs) that manifest on the scalp and can be measured using electroencephalography (EEG) techniques. Modern digital signal acquisition and processing enables accurate VEP measurement that provides biomarkers for the function of visual pathways from the retina via the optic nerve, optic chiasm, and optic radiations to the occipital cortex; analysis of these stimulus responses yield a more objective and comprehensive assessment of the health of the eye-brain system than can self-reporting.2,8 The EEG-based techniques like VEP have much greater time resolution than magnetic resonance imaging (MRI), and hence can provide complimentary functional diagnostics while also being less expensive to employ.8,9 MRI does give superior internal spatial imaging that can be of immense value in the diagnosis of eye and brain conditions that manifest as obvious anatomical features. Although, functional MRI techniques exist (even combined with EEG), they are most often only specialist research modalities that measure the after-effects of cognitive stimulation (such as the blood oxygen content and flow into specific regions of the brain) and do not have broad clinical applications.9 Despite its promise and cost efficacy, the authors believe that routine use of VEPs in clinical assessment has been hampered by practical problems associated with the traditional EEG methods used: long setup times, limited portability, uncomfortable head preparation, the use of messy conductive pastes and gels, and the lack of seamless integration with stimuli generation.
Three main cellular pathways are believed to comprise the human vision system.10 Starting in retinal cone cells of differing wavelength sensitivity, neural signals travel through the optic nerve to the lateral geniculate nuclei in the mid-brain, then arrive at the V1 visual cortex on the occipital lobes: the magnocelluar (MC) pathway reacts especially to low spatial contrast and fast-moving stimuli regardless of color; the parvocellular (PC) pathway reacts to high spatial contrast (structure/texture) and red/green color information; and the koniocellular (KC) reacts to blue/yellow spectral content. Careful design of visual stimuli can selectively evoke contributions from these neural circuits. Transient Visually Evoked Potentials (tVEP) are neuroelectric signals arising after the presentation of a brief impulse or stepped visual stimulus (such as a flash or pattern-reversal) and lasting approximately 250–500 ms; generally, tVEPs are time-averaged over repeated trials in order to extract them from the background noise of spontaneous EEG (at least enough trials to yield a signal-to-noise ratio (SNR) significantly higher than 1), and they tend to have the highest amplitudes for sensors located near V1 (electrodes O1, Oz, and O2 in the 10–20 EEG system). A steady state VEP (ssVEP) is a neuroelectric signal generated from the presentation of repetitive visual stimulus - at rates typically from 3–50 Hz – which has relatively stable frequency components at the stimulus fundamental and harmonics; spectral analysis of ssVEPs will potentially lead to robust biomarkers of visual function and these stimuli have also found use as frequency tags in cognitive paradigms and brain-computer interfaces.
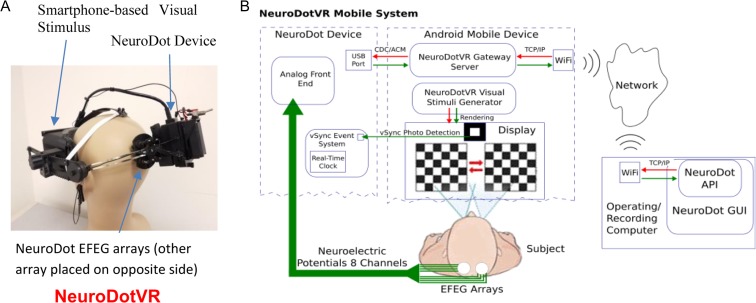
NeuroFieldz Inc., is developing a next generation neuro-opthalmic diagnostics system called NeuroDotVR (Fig. 1) that utilizes the breakthrough NeuroDot brain sensor developed by the Sridhar group.11–14 In the following description of this product prototype system, the NeuroDot device quantitatively measures Visual Evoked Potentials and Fields (VEPF) resulting from custom visual stimuli generated by a smartphone (running Google’s Daydream mobile VR platform15 on Android OS) housed in a customized virtual reality headset that supports a broad range of diagnostic and therapeutic stimuli. The NeuroDotVR system has been designed with the following innovative features:
Integrated visual stimulus, eye tracking, and neuromonitoring in a single unit that is completely portable, usable in any position upright or reclined, and potentially could be deployed anywhere such as battle field, trauma center, field hospital, home, or ambulance. This may be the first device that integrates portable brain monitoring with a mobile virtual reality visual display headset.
Nanostructured hydrogel biopotential electrodes resulting in a rapid setup times which can take as little as 2 min, and can be used without special scalp preparations, pastes or gels. Super-absorbent sponge electrode caps along with a saline electrolyte provide a low impedance scalp contact without dripping or leaving messy residues (typically 50–100 kOhms is sufficient for most paradigms using the NeuroDot sensor).11 The electrode diameters are small (<8 mm), so can be positioned in between thickly growing hair.
Dual neuroelectric signal modality operation: VEP mode where it measures potentials (EEG mode) and a new VEF mode where it measures local electric fields (EFEG mode) with enhanced sensitivity and information content.
The NeuroDot sensor has eight electrode channels, providing good coverage of the primary visual cortex areas. The typical montage which is employed covers the standard 10–20 System locations of O1, Oz, and O2 with groups of four channels in order to compute EEG (using the spatial average) and EFEG modalities (discrete gradient-based electric field estimate). (See the Methods section for details.)
A variety of visual stimuli will be utilized, such as monocular, dichoptic, stereoscopic, binocular, hemifield, multi-focal, static, dynamic and chromatic stimuli, and even Virtual Reality scenes and 3D movies. Additionally, the custom NeuroDotVR viewer is designed to be completely light-tight (unlike the standard Daydream Viewer) and to accommodate even rather large spectacles of patients. Light-tightness is crucial for measuring the patient’s response to very dim stimuli, such as in dark-adapted vision paradigms.
High quality data streaming and physician access: cloud connected to provide 24/7 monitoring and assessment. Removes the need for patient visits to physicians for diagnostics or testing response to therapy.
Adaptive algorithms can be implemented that update the stimulus parameters in real-time, based on the patient’s ongoing responses. This feature can help to optimize diagnostic information collection within a limited testing time.
Quantitative, objective diagnostics rather than subjective responses are obtained; TBI and other trauma patients may have trouble cooperating with demanding cognitive tasks so objective diagnostics may prove more reliable. Furthermore, the obtainment of unbiased functional estimates which cannot be fabricated eliminates the trust problem when patients are suspected of malingering.2
FIGURE 1.
Portable wireless NeuroDotVR system. (A) NeuroDotVR prototype device integrating NeuroDot sensor with custom visual stimulus headset (running Google’s Daydream mobile VR platform). (B) Schematic for NeuroDotVR system with Android smartphone and cloud control signals.
METHODS
The NeuroDot sensor is unique in that it can be operated simultaneously in regular EEG mode, as well as the new electric field encephalography (EFEG) mode which can provide enhancements in signal quality and can drastically improve the sensitivity of paradigms that probe the limits of visual function.14,16,17 Each NeuroDot sensor array comprises 4 small-diameter biopotential electrode pins arranged in a grid with a small spacing of 1.5 cm (considered to be “ultra” or “very” high-density17,18). The NeuroDotVR system (Fig. 1a,b) uses two independently positionable sensor arrays, yielding 8 independent channels of EEG data which are typically combined to produce derivative EFEG signals covering up to three contiguous (or two non-contiguous) standard 10–20 System scalp locations, e.g., O1, Oz, O2 where the central location, Oz, uses the rightmost two channels of the left array and the leftmost two of the right array. Each of the sensor pins connects to its own amplifier channel, which amplifies the potential difference between it and a separate reference electrode, which is clipped to the left ear of the subject. The average potential of the symmetric array (with respect to the remote reference) , is analogous to a single EEG channel at the center of the array, albeit with lower noise, where index i runs over the four sensor pins and stands for the ith pin sensor’s potential. In this montage, local electric field components tangential to the scalp can be estimated via local gradients about this central potential – the polarity of which is independent of the remote reference location. Using the assumption of approximate linear variation over the small length scales of the array and the fundamental relation between the electric field and the gradient of the potential, we suppose that the measured potentials approximately obey the 2D linear form ; hence, the determination of the electric field components tangential to the scalp can be treated as the parameters in a two-dimensional linear fitting problem. The ordinary least squares (OLS) solution minimizes the sum of the squared error terms (For example, see Bevington chapters 6 and 7.).19 Further, with the spatial symmetry of the array designed such that , the OLS estimation of the electric field components simplifies to where index i runs over the four sensor pins, stands for the x-coordinate (or the y-coordinate) of the pin with respect to the center of the array, stands for the ith pin sensor’s potential, and is the central array potential.
The stimuli that were used for most experiments described in this report, consisted of “reversing” checkerboard patterns (alternating light and dark squares which switch colors at precise times) with check size equal to 1 degree of visual field. The display device was a Google Pixel 2 XL smartphone, which has a maximum illuminance (for full white screen) measured at approximately 400 lux per eye in the custom VR viewing headset. The OLED screen of this smartphone has truly dark black pixels (unlike LCD screens which leak a small amount of backlighting), enabling a larger range of contrasts. Stimuli were displayed at a fixed 90 degree viewing angle, at a simulated distance of 100 cm on a virtual 2D screen (rather than a simulated screen embedded in a virtual reality scene which would change viewing angle with head posture). Stimuli textures were mapped to this virtual screen surface that was rendered in stereoscopic 3D and updated at a rate of 60 frames per second using the Google VR Android software development kit with OpenGL ES 2 library according to the Daydream platform specifications. Additionally, the feature of “low persistence display mode” (interframe blanking), which is popular in many modern VR platforms to reduce perceived motion blur in updating VR scenes, was disabled in order to prevent possible VEP artifacts induced by this fast flicker (60 frames per second).
The NeuroDotVR custom viewer closely matches the optical characteristics of the official Google Daydream viewer (1st edition released in 2016), using the same lenses it has approximately 90 degrees of visual field diameter; however, the custom viewer has fully compartmentalized individual eye views and superior overall light-tightness, enabling automated eye-blanking for single eye testing and the usage of very low light level stimuli. Lower phototopic to mid-mesopic illuminances (400 – 0.1 lux) are attainable without an additional filter; however, because of platform limitations to the displayable pixel brightness, the lower mesopic to scotopic ranges (<0.1 lux) used in dark-adapted vision protocols requires the use of a neutral density filter, which is insertable into the viewer in front of the phone screen. A photodetector and real-time clock system (with sub-millisecond precision), which is integrated into the NeuroDot sensor device, is used to detect the onset of the first frame of a new stimulus presentation with precise low-latency timing, by marking the on/off changes of an embedded signaling patch (hidden from the subject’s view). These presentation timing signals, which are referenced to the same clock as the neuroelectric samples, form the basis of a system for accurate phase-locked tVEP epoch averaging in the time domain – a process which effectively cancels out the other background signal components that are not synchronized to the stimulus display events.
RESULTS
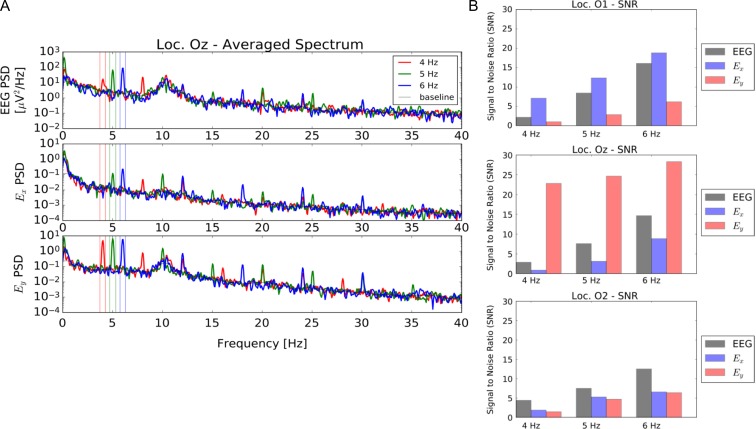
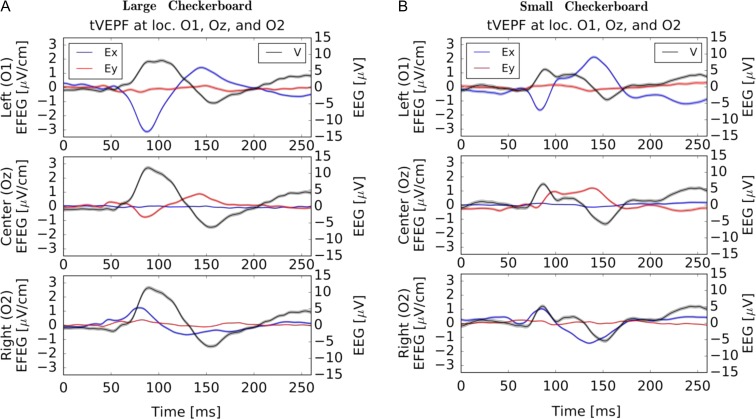
The NeuroDotVR has been benchmarked for several standard VEP tests (Figs 2–6). The EFEG regime is most useful when estimating local brain activity in the vicinity of the NeuroDot sensor, and unlike EEG, EFEG is free from the ambiguity of choosing the potential reference. Usability studies on human subjects were carried out and show that the NeuroDotVR is well configured for rapid use in clinical, laboratory, home/outreach and medically underserved settings, and had excellent signal quality and low intrinsic noise. Figure 2 shows sample data from an ssVEPF paradigm, where the subject was presented with full contrast checkerboard pattern reversals flashing at rates of 4, 5, and 6 Hz. Figure 3 shows tVEPF measurements for checkerboard pattern reversals using stimuli that span different visual field diameters: (A) “Large” (90 degrees) and (B) “Small” (30 degrees). A few short case studies are presented below in order to illustrate the kinds of paradigms and data sets that may be useful for the conduct of in-depth clinical studies:
FIGURE 2.
Summary of established results with NeuroDot sensor for reversing black and white checkerboard ssVEP at 4, 5, 6 Hz at O1, Oz, and O2 scalp locations using EEG and new EFEG mode data acquisition. (A) NeuroDot spectral analysis sample for the Oz location, showing peaks in narrow bands around the stimulus frequencies; also more harmonics are visible in the EFEG signal (Ex and Ey components) than in EEG. (B) Measured signal to noise of the fundamental steady state Visual Evoked Potentials peaks for EEG and EFEG (Ex and Ey components) over the three scalp locations. Note that the Ey component shows the strongest overall SNR at Oz, indicating a vertical polarization of electric field; whereas, for O1 the polarization is mostly horizontal and for O2 the polarization is minimal, but may be diagonally oriented. These relative SNR variations are expected vary somewhat among even healthy subjects, though there may be feature patterns that are more general. For instance, the greater Ey polarization of Oz might be explained by the fact that the brain’s interhemispheric cleft is oriented vertically in-line with this electrode position.
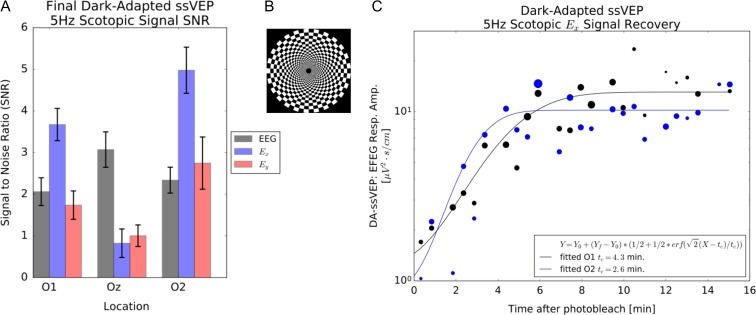
FIGURE 6.
(A) ssVEPF SNR for a 5 Hz scotopic stimulus for a normal subject after dark adaptation. The superior sensitivity of the EFEG mode Ex compared with standard EEG mode is evident. (B) Peripheral log polar checkerboard stimulus pattern. (C) Fitted recovery of the EFEG Ex signal at locations O1 and O2 during dark adaptation following a photobleaching stimulus. Asymmetry between O1 and O2 recovery times may be subject specific.
FIGURE 3.
Binocular tVEPF responses (average of 180 trials, 500 ms each) at locations O1, Oz, and O2 for a normal sighted adult with (A) “Large” (90 degrees) and (B) “Small” (30 degrees) reversing checkerboard patterns. The EFEG signal scales are on the left and EEG scales are on the right-hand side of axes. Colored bands show mean error estimates: the thinner bands for EFEG indicate potentially lower noise levels (higher signal-to noise ratio). The EEG shows typical P100 peaks with approximately a factor of 2 amplitude difference, but little change in peak latency. For strong signals, the EFEG peak locations are less ambiguous than EEG. The EFEG data show an interesting pattern for both data sets: Ex signals peak in opposite directions between O1 and O2 and have higher amplitudes here than Ey; at the central position Ey has higher amplitude, but it is weak on the side locations. In contrasting the data sets, the Ey signal is qualitatively different with Oz initial peak polarization reversed and latency increased by 14 ms for the “Small” pattern relative to the “Large” pattern. These differences may arise from the rentinotopic mapping of the peripheral visual field into the cortical layers extending into the interhemispheric cleft.
Case Study: Monocular Visual Impairment
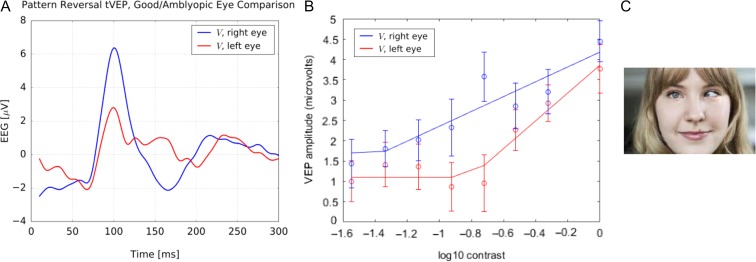
The dichoptic capability (targeting stimuli to each eye independently) of the NeuroDotVR is well suited for diagnostic measurements of Amblyopia. Each eye was presented with a monocular “reversing” checkerboard pattern (with check size equal to 1 degree of visual field) that switches grayscale brightnesses between alternating checks every 0.5 seconds for a total of 128 trials. The untested eye was shown a blank screen which looked completely dark (similar to eye-patching) in the custom VR viewer, and both eyes were tested, alternately, during the same session. The contrast of the pattern was varied exponentially over eight different levels. From the trial average tVEP responses for each contrast level, the root-mean-squared amplitude was computed (over a window of 0–300 ms) and plotted against the log of the contrast level (such that full contrast equals 1.0). Three repetitions of the protocol were performed on the same subject during separate sessions (over the course of a few days) in order to produce average values and error estimates. In Figure 4, data are presented from an adult amblyope, age 50: impaired left eye shows (A) greatly decreased P100 amplitude and (B) reduced contrast sensitivity, compared with the healthy right eye.
FIGURE 4.
tVEP response for an amblyopic adult. The amblyopic left eye shows (A) greatly decreased P100 amplitude and (B) stronger contrast sensitivity, compared with the normal right eye. (C) Representative example of amblyopia (not the actual subject).
Case Study: Visual Field Loss
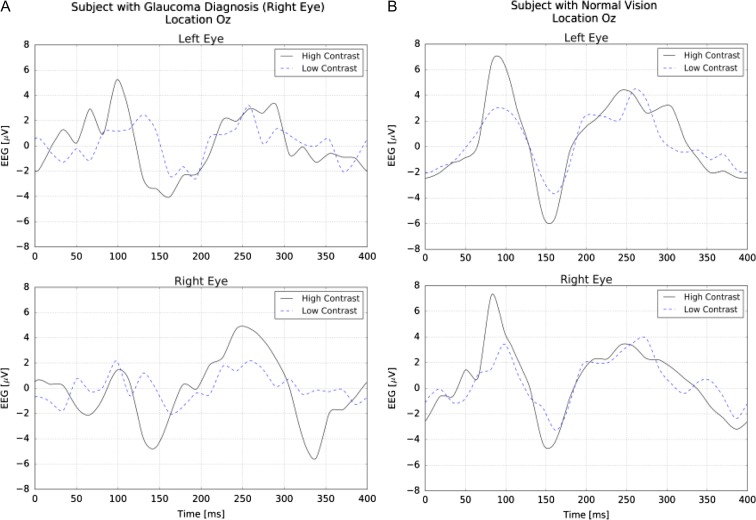
The NeuroDotVR enables very convenient diagnostic measurement of glaucoma at early stages that is critical for success of treatment. A dichoptic, reversing checkerboard stimulus of check size equal to 1 degree of visual field was used at “high” (full screen brightness/darkness) and “low” (approximately 10 times lower levels, centered around mid-gray) contrast levels to probe subjects with normal and impaired vision. The tVEP response was computed as the average of 128 trial EEG responses that were phase-aligned to the stimulus presentation time. Figure 5 (A) “Right Eye” (with Glaucoma diagnosis) shows strong contrast sensitivity, suppressed P100 peak amplitude, and abnormally high amplitude for later peaks as compared with the tVEP for a normal subject (B). We note that the left eye of this subject also may show anomalies, possibly due to retinal repair surgery that was self-reported. Repeated tVEP measurements on an individual over time or after various treatments might be used clinically to track the progression of the disease state.
FIGURE 5.
(A) tVEP for a subject diagnosed with early glaucoma in the right eye. The signals show strong contrast sensitivity, suppressed P100 peak amplitude, and abnormally high amplitude for later peaks.(B) tVEP for a normal subject.
Case Study: Dark Adaptation Recovery
The NeuroDotVR can be configured in the DA-VEPF paradigm to measure VEPF recovery under Dark Adaptation, following a bright photobleaching stimulus. Figure 6 shows typical ssVEPF signals from a normal subject viewing a 5 Hz scotopic (stimulating only rod photoreceptors) reversing log polar checkerboard stimulus. It is apparent that the EFEG mode gives higher SNR than EEG mode for these measurements, which is crucial, since recovering responses may be very weak (initially below the noise floor, SNR ≈ 1) and fluctuating. The DA-VEPF mode is hypothesized to be particularly suited for diagnosis of Photosensitivity following Concussion and retinal metabolism delays in age-related macular degeneration (AMD). Early stage clinical experiments using a related protocol based on tVEPF stimuli (not published) suggest that signal recovery times are significantly delayed in individuals with AMD.
DISCUSSION
NeuroDotVR is a product prototype system, which has moved past the academic proof-of-concept stage, and is chugging along towards commercialization. Using a philosophy of rapid design iteration and a do-it-yourself attitude, the NeuroFieldz team has continued to innovate in the sphere of portable neuroelectric diagnostics. The product development work thus far has led to the following technological breakthroughs:
Breakthrough #1: In order to meet the high performance demands of the ultra-dense EFEG array application, proprietary electrodes with small form-factor (<8 mm diameter), high electrochemical potential stability (<10 mV offset), low baseline drift (<1μV/s), and low motion-induced artifacts (typically <100μV for moderate head movements) were developed. A custom nanoparticle AgCl suspension functionalizes a metallic silver electrode surface which is encapsulated in a mechanically robust hydrogel formulation. In order to reduce the inherently high impedance of dry scalp contact, removable saline-wetted sponge tips that cap each electrode were developed. Repeatable results were obtained over dozens of mounting/demounting usages with minimal maintenance. There are no comparable electrodes on the market today.
Breakthrough #2: The mechanical challenges of mounting neurosensory arrays to human subjects were overcome with custom hardware designs and integrated with a custom stereoimage/VR stimulus viewer that is compatible with the Google Daydream platform; weight and tension band forces are balanced to reduce effect of head movements inducing motion artifacts. NeuroDotVR setup time is fast (wet tips with saline solution, place on head and start recording, typically <2 mins), addressing a key pain point with current sensors. No scalp preparation or use of gels or pastes is required. Built-in impedance measurement allows for signal quality assurance if adjustment is needed.
Breakthrough #3: The NeuroDot provides clean wireless EEG and EFEG recordings, with very high signal to noise ratio. This dual modality enables comparison to standard EEG signals well-known to clinicians, while enabling new ultra-high sensitivity EFEG measurements. Sample data are provided for steady-state Visual Evoked Potentials and Fields (ssVEPF) (Fig. 2A, B).
Breakthrough #4: The NeuroDotVR system can measure accurately timed transient Visual Evoked Potentials and Fields (tVEPF) (Fig. 3) that have better than 1 millisecond resolution. The new EFEG data traces contain more detailed information, have lower noise, and have better defined peak shapes than the standard tVEP (EEG data only) that are used by clinicians currently. (Fig. 3A, B).
Like any other system based on neuroelectric signal detection at the scalp, there are limitations to NeuroDotVR’s capabilities that may emerge, especially in clinical settings. Signal artifacts, having several different mechanistic causes, typically afflict non-invasive neuroelectric measurements. In particular, motion-induced changes to electrode contact can cause large signal variance that swamps weak brain signals by several orders of magnitude, so it is especially important to detect and reject these afflicted trials from subsequent data processing steps. Developing testing paradigms with many short duration trials along with adaptive artifact rejection algorithms is an effective approach to assuring data quality. The design of the electrode materials’ properties and mounting mechanics can help to raise the threshold forces needed to cause disruptive artifacts. Currently, the NeuroDotVR system does track head posture at a rate of 60 times per second through the Google VR platform’s sensor fusion pipeline, which could be used to unambiguously detect and possibly correct motion artifacts with future developments. Furthermore, most vision-based tests require subjects to fixate their eye positions as well as to avoid excessive eye closure; careful design of stimuli with fixation targets as well as providing rest periods and alertness reminders can help with these issues. Ideally, an eye-tracking camera would be integrated into a complete neuro-opthalmic diagnostic system as a further source of error detection or, additionally, as an extra modality for diagnostics. Although the current NeuroDotVR prototype does not have eye-tracking capabilities, it is planned as an avenue for future development. Coaching a patient/research subject to be cooperative – sitting relatively still and keeping eyes open for the majority of trials – is also an essential part of a successful recording session. The NeuroDotVR system can be programmed to deliver automated voiced instructions to subjects at key times or in response to certain events, e.g., a swift head movement by the subject during the recording phase might trigger an audible warning message: “Please try to keep still while testing is in progress.” Another innovative approach would be to estimate the number of rejected trials in real time using available sensor data and to compensate by increasing the length of the testing phase with additional trials.
CONCLUSIONS
The NeuroDotVR may be the first disclosed technology platform that integrates portable brain monitoring with a mobile virtual reality head mounted display. It will provide optometrists and ophthalmologists with a new and powerful tool for neuro-ophthalmic diagnostics, that can have significant clinical impact within all patient segments from infants to aged adults. A variety of clinical indications such as optical neuritis, amblyopia, multiple sclerosis, glaucoma, age-related diseases, and others are manifestations of abnormalities in the visual pathways. Beyond the primary addressable market of neuro-ophthalmic diagnostics, the NeuroDotVR platform can be configured with different visual stimuli, for applications in TBI, eye blast phenomenon, attention disorders, and stroke.
In-depth studies are currently underway to assess the potential clinical impact of the NeuroDotVR system on two major eye conditions. An active study (supported by Phase I NIH STTR grant 1R41AG057250-01) on AMD patients and age-matched controls is testing the capability of a custom Dark-Adapted tVEPF protocol to discriminate disease status on the basis of detecting delayed recovery time of the response from photobleached retinal regions (macular and near peripheral). A separate study just getting underway (funded by current Phase I NIH/NEI STTR grant 1R41EY028466-01A1) will involve testing novel diagnostic stimuli on 15 amblyopic adults and 15 amblyopic children (>6 years old). These stimuli will consist of temporally and spatially filtered noise, which can be embedded within video frames (e.g., from Hollywood movie clips) and have minimal disruption on viewing. The study protocol will measure the contrast sensitivity function of each eye in the context of eventual integration with novel VR-based therapies.
The NeuroDotVR system offers a new option for mobile optometry/ophthalmology that is portable to field or office clinic, configured to test for the eye and brain health of warfighters and base personnel. The tests will be rapid and comfortable and provide results in formats that are directly comparable with existing behavioral tests, but at a fraction of the time and inconvenience of those tests. The VEPF tests do not require any active participation of the subject and hence provide an objective measure of neuro-ophthalmic performance. This is particularly useful for testing trauma patients who may have difficulty providing subjective assessment, and in identifying conversion disorders or malingerers. The system will also enable Vision Therapy methods utilizing the Virtual Reality display, as well as monitoring the subjects' therapeutic benefit and eye movement control. Due to its portability and versatility, NeuroDotVR is a disruptive system that will transform current office-based practice by enabling field testing almost anywhere, significantly expanding the client base.
Previous Presentation
Presented as a poster at the 2017 Military Health System Research Symposium, August 2017, Kissimmee, FL; abstract # MHSRS-17-0007.
Funding
This work was supported in part by the United States National Institutes of Health grant 1R41AG057250-01. This supplement was sponsored by the Office of the Secretary of Defense for Health Affairs.
References
- 1. Alliance for Vision Research : Decade of Vision 2010–2020. Available at http://www.eyeresearch.org/pdf/brochure/DEFENSE_VISION_BROCHURE.pdf; accessed April 13, 2018.
- 2. Ciuffreda KJ, Ludlam DP: Objective diagnostic and interventional vision test protocol for the mild traumatic brain injury population. Optometry 2011; 82(6): 337–339. [DOI] [PubMed] [Google Scholar]
- 3. Lew HL, Poole JH, Vanderploeg RD, et al. : Program development and defining characteristics of returning military in a VA Polytrauma Network Site. J Rehabil Res Dev 2007; 44(7): 1027–34. [PubMed] [Google Scholar]
- 4. Magone MT, Kwon E, Shin SY: Chronic visual dysfunction after blast-induced mild traumatic brain injury. J Rehabil Res Dev 2014; 51(1): 71–80. [DOI] [PubMed] [Google Scholar]
- 5. Dougherty AL, MacGregor AJ, Han PP, Heltemes KJ, Galarneau MR: Visual dysfunction following blast-related traumatic brain injury from the battlefield. Brain Inj 2011; 25(1): 8–13. [DOI] [PubMed] [Google Scholar]
- 6. Long T, Thompson B, Blum JR, Maehara G, Hess RF, Cooperstock JR: A game platform for treatment of amblyopia . IEEE Trans Neural Syst Rehabil Eng 2011; 19: 280–289. [DOI] [PubMed] [Google Scholar]
- 7. Bossi M, et al. : Binocular therapy for childhood amblyopia improves vision without breaking interocular suppression. Invest Ophthalmol Vis Sci 2017; 58(7): 3031–3043. [DOI] [PubMed] [Google Scholar]
- 8. Tobimatsu S, Celesia G: Invited review: studies of human visual pathophysiology with visual evoked potentials. Clin Neurophysiol 2006; 117: 1414–1433. [DOI] [PubMed] [Google Scholar]
- 9. Hüsing B, Jäncke L, Tag B: Impact Assessment of Neuroimaging: Final Report. IOS Press 2006; ISBN: 9781586036133.
- 10. Vialatte FB, Maurice M, Dauwels J, Cichocki A: Steady-state visually evoked potentials: focus on essential paradigms and future perspectives. Prog Neurobiol 2010; 90: 418–38. [DOI] [PubMed] [Google Scholar]
- 11. Versek C, Frasca T, Zhou J, Chowdhury K, Sridhar S: Electric field encephalography for brain activity monitoring. J Neural Eng 2018; 15(4): 046027 10.1088/1741-2552/aac3f9. [DOI] [PubMed] [Google Scholar]
- 12. Sridhar S, Petrov Y, Yavuzcetin O, Chowdhury K: Sensor system and process for measuring electric activity of the brain, including electric field encephalography. PCT/US2016/0120432, June 20, 2014. Available at https://patentscope.wipo.int/search/en/detail.jsf?docId=US163445330; accessed July 10, 2018.
- 13. Sridhar S, Petrov Y, Yavuzcetin O: Electric field encephalography: electric field based brain signal detection and monitoring. PCT/US2016/0081577, August 9, 2012. Available at https://patentscope.wipo.int/search/en/detail.jsf?docId=WO2014025353; accessed July 10, 2018.
- 14. Sridhar S, Versek C, Bex P: Portable brain and vision diagnostic and therapeutic system, PCT/US2017/059803, November 2017. Available at https://patentscope.wipo.int/search/en/detail.jsf?docId=WO2018085598; accessed July 10, 2018.
- 15. Google VR: Discover: Platforms: Daydream. Available at https://developers.google.com/vr/discover/daydream; accessed September 24, 2018.
- 16. Petrov Y, Sridhar S: Electric field encephalography as a tool for functional brain research: a modeling study. PLoS One 2013; 8(7): e67692. [DOI] [PMC free article] [PubMed] [Google Scholar]
- 17. Petrov Y, Nador J, Hughes C, Tran S, Yavuzcetin O, Sridhar S: Ultra-dense EEG sampling results in two-fold increase of functional brain information. Neuroimage 2014; 90: 140–45. [DOI] [PubMed] [Google Scholar]
- 18. Robinson AK, Venkatesh P, Boring MJ, Tarr MJ, Grover P, Behrmann M: Very high density EEG elucidates spatiotemporal aspects of early visual processing. Scientific Reports 2017; 7: 16248. [DOI] [PMC free article] [PubMed] [Google Scholar]
- 19. Bevington PR, Robinson DK: Data Reduction and Error Analysis for the Physical Sciences, Ed 3, New York, NY:McGraw-Hill, 2003. [Google Scholar]


