

INTRODUCTION
The Chippewa Ottawa Resource Authority (CORA) in Sault Ste. Marie, Michigan, formerly through the Inter-Tribal Fisheries and Assessment Program (ITFAP), has been monitoring contaminant concentrations in the fillet portions of lake trout (Salvelinus namaycush) and lake whitefish (Coregonus clupeaformus) from the 1836 treaty-ceded waters (Figure 1) of lakes Superior, Huron, and Michigan since 1991. CORA represents the fisheries interests of five Ojibwa and Ottawa tribes (collectively called Anishinaabe) whose ancestors ceded lands through the 1836 Treaty of Washington but retained the rights to hunt and fish on those lands and waters. The contaminant monitoring program was initiated because the CORA-regulated commercial fishery annually harvests about 2 million kg of lake whitefish and 0.5 million kg of lake trout from the three upper Great Lakes, and many Native American families derive income from the fishery (Taylor and Ferreri 2000). Despite the cultural history (Quaife 1947) and known benefits of eating fish (Mozaffarian and Rimm 2006, Mozaffarian and Wu 2011, Mozaffarian and Wu 2012, Turyk et al. 2012), the Anishinaabe) report to consume only one third of the recommended daily fish intake (USDA 2015, Dellinger 2004). An aversion to culturally-insensitive State and Federal advisories is often suggested as a factor influencing these consumption rates. The loss of traditional foods creates a nutritional health disparity for indigenous North Americans (Ho et al. 2008, Schell 2012, Whiting and Mackenzie 1998). The decreased access to fishery and other traditional foods has coincided with a general trend of decreased dietary quality, obesity, and cardiovascular disease within Native Americans (Story et al. 2003, GLITEC 2011). We recently reported that application of a novel risk-benefit quantification (Ginsberg and Toal 2009, Ginsberg et al. 2015) to the tribal harvests monitored by CORA reveals potential health benefits from Omega-3 Polyunsaturated Fatty Acids (PUFA-3) adjusted for methylmercury (MeHg) risks (Dellinger and Ripley 2016). We further suggested that presentation of the risk-benefit quantification, along with culturally-tailored fish consumption advice (to cover other PBTs such as Polychlorinated Biphenyls (PCBs)) would serve as an acceptable and effective vector to operationalize CORA data for Anishinaabe fish consumers.
Figure 1:
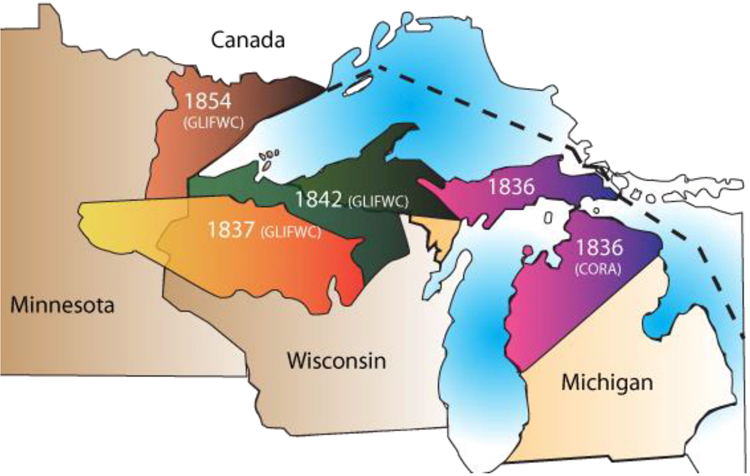
The Treaty-ceded territories associated with the U.S. Upper Great Lakes Anishinaabe tribes. Tribal commercial fishing is monitored by The Chippewa Ottawa Resource Authority (CORA) and Great Lakes Indian Fish and Wildlife Commission (GLIFWC).
Improved efforts to share fish contaminant and nutrition data with the tribal community are important priorities for tribal governments. Inter-Tribal Council of Michigan (ITCM) is actively engaged in leveraging mobile technology to meet the needs of their rural service area. Generally, 71% of Midwest residents have access to internet access (File 2013). Most people in the ITCM service area have internet access and use it. Furthermore, ITCM reports that over half of Anishinaabe adults in their area own smart phones compared to 46.5% in the Midwestern population (File 2013, Pingatore 2014). We anticipated that culturally-tailored fish consumption advisories using mobile technology will best meet the needs of Anishinaabe fish consumers. In the spring of 2016 we investigated this by presenting a pilot version of a novel fish consumption advisory to Anishinaabe focus groups.
This paper reports the process for creation, and preliminary community reception, of an interactive fish consumption advisory for the Anishinaabe using software that can be accessed via mobile phones and/or the internet. The software program (app) “Gigiigoo’inaan” [Our Fish] offers personalized, culturally-tailored advice that presents contaminant and PUFA-3 data in a user-friendly format. Gigiigoo’inaan employs some crucial innovations based on our previously-identified best practices as well as some novel features. It also provides personalized consumption advice based on user-input. In addition to evaluating the mobile software format using focus groups, we explored participant reactions to a quantitative method for comparing the risks and benefits of fish consumption put forward by Ginsberg et al. (2009, 2015). Project partners include the Medical College of Wisconsin (MCW), Great Lakes Inter-Tribal Council (GLITC), Inter Tribal Council of Michigan (ITCM), and the Chippewa Ottawa Resource Authority (CORA). These activities were conducted as part of the collaborative project “An Anishinaabe Fish Consumption Advisory to Promote Environmental Health Literacy,” funded by the National Institutes of Health (Dellinger et al. 2015−2017).
METHODS
Tribal Data Collection of PBTs to Generate Recommendations
Methods for fish collection and contaminant analysis are reported in more detail in (Dellinger et al. 2014). The sampling design is based on established ITFAP/CORA methods (Dellinger 2004, Dellinger et al. 2014, Moths et al. 2013, ITFAP 2008). Briefly: samples for contaminant analysis were harvested from 1992–2014 as part of routine Anishinaabe commercial fishing. From 1992–present, lake trout (Salvelinus namaycush) and lake whitefish (Coregonus clupeaformis) (n = 12 per species) were purchased from Native American commercial fishers or harvested during routine assessments conducted by ITFAP personnel. These fish were sampled in three-year rotations between Lakes: Superior, Michigan, and Huron (within the CORA/ITFAP service area). In 2004 Walleye (Sander vitreus) from Lake Superior (n = 9), Lake Huron (St. Marys River) (n = 12) and Lake Michigan (n = ) were sampled by ITFAP. These data were the most recent CORA sampling of walleye, an updated version of the app is already underway and will use Walleye, and 9 other Great Lakes fish data from 2016.
Since they are of high interest to Anishinaabe fish consumers, and CORA maintains corresponding PBT data, these three species of fish were selected to create the pilot version of the software. The most recent average total PCB (µg/g) and Hg (µg/g) for each species (12 lake trout, 12 whitefish, and7 walleye from Lake Huron/St. Marys River) and lake (Michigan: 2012, Superior: 2013, and Huron 2014) were compared to past trends and deemed appropriate by CORA/ITFAP for the generation of new recommendations. PUFA-3 concentrations were sourced from other published data on Great Lakes fish (Williams et al. 2014). Fish data are average for all lengths since most users would not know the actual length of these commercially/locally caught fish. Advice on choosing shorter length fish will be inlcuded in future iterations.
Software Programing
Gigiigoo’inaan was programmed by the University of Wisconsin-Milwaukee Mobile Innovation Lab to the specifications of the research partners at MCW, ITCMI, and CORA/ITFAP. The software was built using a popular scripting language (PHP 5.6.6) that is used to develop websites, native apps (downloaded to a device), and web apps (run through web browser). The pilot version (evaluated here) works on both Android™ and IOS™ allowing for on-demand calculation of safe consumption rates for three species of fish (lake trout, whitefish, and walleye) based on user input data of age, sex, and weight. The app features custom-made woodland-styled digital images made in the Woodland Style founded by the Anishinaabe artist Norval Morrisseau (Figure 2). The development process followed our proposed model of community feedback and input from tribal scientists and policy makers which is illustrated in Figure 4. The model is developed from the team’s 13 years of experience working with tribal organizations on health research and environmental issue. Recommendations are updated based on community responses and as tribal fish harvest data is updated.
Figure 2:

Screen shots from Gigiigoo’inaan: main data entry page (A), main results page (B), and advisory details page (C). Orginal art by: Matthew Dellinger
Figure 4.

Conceptual model outlining advisory development process. The community and tribal authorities are both consulted throughout. The software is developed iteratively based on these inputs and updated using tribal data. Orange arrows represent the first pass, which has already occurred, blue arrows represent future iterations of the process.
The introductory page states that the app helps users to choose which fish are safest to eat. All risk (and benefit) estimates are calculated within the software, on demand, based on user inputs. On the first results page (after personalization data is entered) fish are ranked in order of the most to least beneficial fish using the Ginsberg and Toal method (described below). When selected from this list, the fish displayed specific consumption advice using safe consumption ranges based on the user input. These fish can also be browsed by water body (Lakes: Huron, Michigan, and Superior) to represent the options within the fisheries of the Anishinaabe tribes. Figure 3 outlines basic app architecture (sample screen shots in Figure 2). Distinct from conventional advisories, the software uses input data (bodyweight and selection of illustrated 4oz, 6oz, and 8oz serving sizes) to calculate a ratio of fish grams/meal/bodyweight which can be linked to pre-determined safe consumption ranges per fish using the appropriate guidelines determined by CORA/ITFAP.
Figure 3:

Example of backend calculations in Gigiigoo’inaan for an adult 82kg male. Recommended grams of fish per bodyweight per meal are calculated based on Hg and PCB using ITFAP data on Walleye and Lake Trout. The software uses input data (bodyweight and 4oz, 6oz, and 8oz serving sizes) to calculate a ratio of fish grams/meal/bodyweight. For MeHg, the app uses the Agency for Toxic Substances & Disease Registry (ATSDR) minimum risk level (MRL) (ATSDR 2014). For PCBs, health protective values from the Protocol for a Uniform Great Lakes Sport Fish Consumption Advisory were selected (Anderson et al. 1993).
For now, MeHg and PCBs remain the contaminants of greatest concerns in CORA-monitored fish. Following consumption guidelines of federal agencies for these PBTs should also protect against other contaminants that, to our best knowledge, occur at lower levels relative to their boilogically-significant doses. The software cross-references the user-data with these consumption categories and display the appropriate advice. For example: the app internally calculates a meal ration of 2.8 grams/kg/meal for an adult male who weighs 82kg and typically eats 6oz (227 grams). At that rate he can safely eat one meal of walleye (MeHg concern) or one meal of lake trout (PCB concern) per week from the CORA service area (Figure 3). For MeHg, the app uses the Agency for Toxic Substances & Disease Registry (ATSDR) chronic oral minimum risk level (MRL) of 0.3 µg/kg/day was (ATSDR 2014). For PCBs, the health protective value (HPV) from the Protocol for a Uniform Great Lakes Sport Fish Consumption Advisory of 0.5 µg/kg/day was selected by CORA/ITFAP (Anderson et al. 1993) since it was designed to wholistically protect Great Lakes fish consumers while aknowledging the potential benefits of fish consumption as well as the considering emeliorating factors such as trimming and cooking. Amore sensitive calculation, for fetuses and children, was not included in the pilot version of Gigiigoo’inaan. This will be included in the future iterations.
Calculation of Risk/Benefit Metric
Ginsberg and Toal (2009) selected studies from the literature (Guallar et al. 2002, Oken et al. 2005, Mozaffarian and Rimm 2006, Oken et al. 2008) to support an integrated risk/benefit analysis for adult cardiovascular and in utero neuro developmental end points on a species-specific basis. These studies describe dose-response relationships between MeHg (but not other contaminants such as PCBs), PUFA-3s and common health endpoints for adults and fetuses. Mozzafarian and Rimm (2006) observed a 14.6% decreased relative risk to Coronary Heart Disease (CHD) per 100 mg/day of PUFA-3, whereas a 23% increased relative risk for CHD was observed per 1 pmm hair Hg by others (Guallar et al. 2002, Ohno et al. 2007). The method therefore subtracts risk of adult CHD from MeHg (23% higher risk/1 ppm hair Hg) from the benefit (14.6% lower risk/100 mg PUFA-3). For fetal development (more sensitive) the method subtracts risk (3.5 VRM points/1 ppm maternal hair Hg) from the benefit (3.04 VRM points/100 mg maternal PUFA-3).This is based on observations of 6-month mother-infant pars by Oken et al (2015) in which 2.0-point VRM increase per 100 mg/day of PUFA-3 was observed contrasted with a 7.5-point VRM decrease per 1 ppm hair Hg. Ginsberg et al. (2015) recently updated the model for infant neural development, which estimates changes in Visual Recall Memory (VRM points) in children who were exposed -in utero to material MeHg.
Reproductive females (categorized from the personalization home page in Gigiigoo’inaan) received fish rankings based on estimated net VRM scores, all others adults received rankings based on CHD risk changes. Thus, reproductive age females receive advice describing the potential impact of MeHg/PUFA-3 on the neurodevelopment of a fetus. The following equations were therefore programmed into Gigiigoo’inaan to calculate the appropriate risk/benefit metric based on self-reported meal size for presentation of fish rankings:
Net risk/benefit for adult CHD = [(PUFA-3 mg/meal) × (no. meals/week) × (1 week/7 days) × (14.6% lower risk/100 mg PUFA-3)] – | [(hair Hg change/fish meal) × (no. meals/week)] – (0.51 ppm hair Hg)| × (23% higher risk/1 ppm hair Hg) Net risk/benefit for infant VRM = [(PUFA-3 mg/meal) × (no. meals/week) × (1 week/7 days) × (3.04 VRM points/100 mg PUFA-3)] – [(hair Hg change per fish meal) × (no. meals/week) × (3.5 VRM points/1 ppm hair Hg)]
Focus Groups to Evaluate Gigiigoo’inaan
Each focus group consisted of eight to ten (8 −10) participants from the Anishinaabe community. Specific inclusion criteria were: 1) age 18+ years who make dietary decisions 2) reside in the area covered by CORA (Figure 1), and 3) self-reported tribal membership. Project partners at ITCM recruited from their member tribes in the Great Lakes region. A complete list of these eleven tribes can be found at http://www.ITCMI.org. All participants were offered a meal, which included fish, during the meetings and a $25 gift card as incentive to participate.
A 19 item questionnaire was developed in collaboration with tribal partners (ITCM and CORA) and following ODPHP assessment guidelines (ODPHP 2014). Gigiigoo;inaan was designed to target the following a-priori qualities based on past focus groups within the population (Dellinger et al. 2008, Dellinger et al. 2006): 1) The app was interesting and engaging; 2) This tool helped me identify which fish are best to eat; 3) This tool is culturally appropriate; 3) This tool would help me exercise my treaty rights; 4) This tool provides information that is useful for my everyday life; 5) I would use this tool on a regular basis; and 6) I would eat more fish if I could use this tool. Affirmative responses to these questions was considered an indication of acceptability and utility. Twelve additional questions were also developed in collaboration with ITCM and CORA to assess fish consumption behaviors and basic, de-identified demographic information (summary of all questions with responses: Table 2)
Table 2 –
Anonymous Response data from focus group questionnaire
| Questions (n = 24 participants) | Strongly Agree, n (%) |
Agree, n (%) |
Neither Agree nor Disagree, n (%) |
Disagree, n (%) |
Strongly Disagree, n (%) |
|
|---|---|---|---|---|---|---|
| Pre-App Viewing | Limit store bought fish consumption b/c of contaminantsa | 2 (9%) | 9 (39%) | 8 (35%) | 4 (17%) | 0 (0%) |
| Limit wild caught fish consumption b/c of contaminants |
1 (4%) | 2 (8%) | 5 (21%) | 8 (33%) | 3 (33%) | |
| Limit consumption b/c of taste | 1 (4%) | 1 (4%) | 2 (8%) | 6 (25%) | 14 (58%) | |
| Believe regular exposure to chemicals | 14 (61%) | 7 (30%) | 1 (4%) | 0 (0%) | 1 (4%) | |
| Eat fish b/c it’s healthy | 12 (50%) | 8 (33%) | 3 (13%) | 0 (0%) | 1 (4%) | |
| Mostly eat store fish | 2 (8%) | 5 (21%) | 2 (8%) | 12 (50%) | 3 (13%) | |
| Mostly eat fish I catch | 3 (13%) | 9 (38%) | 5 (21%) | 7 (29%) | 0 (0%) | |
| Post-App Viewing | App is engaginga | 7 (30%) | 9 (39%) | 5 (22%) | 1 (4%) | 1 (4%) |
| Helped id best fish to eata | 11 (49%) | 7 (30%) | 3 (13%) | 2 (8%) | 0 (0%) | |
| Tool is culturally appropriatea | 7 (30%) | 10 (43%) | 5 (22%) | 1 (4%) | 0 (0%) | |
| Help exercise treaty rightsa | 3 (13%) | 5 (21%) | 9 (39%) | 3 (13%) | 3 (13%) | |
| Provides useful info for everyday lifea | 9 (39%) | 9 (39%) | 3 (22%) | 0 (0%) | 0 (0%) | |
| Would use regularlyb | 4 (18%) | 10 (45%) | 3 (14%) | 3 (14%) | 2 (9%) | |
| Would eat more fish with this toolb | 5 (22%) | 9 (39%) | 5 (22%) | 2 (9%) | 2 (9%) |
Missing data n = 1
Missing data n = 2
An Anishinaabe facilitator held on-site (ITCM) focus group discussions with a total of 24 participants. These sessions provided information in two ways: electronic responses using an Audience Response System (ARS) and group discussion. Participants were trained on App usage with Android™ tablets accompanied by the 19-item survey and discussion. All focus group activities were facilitated by trained ITCM staff members who were Anishinaabe tribal members. The focus group results are being used to guide the next iteration of Gigiigoo’inaan at which point a formal evaluation of behavior change is planned.
Results
Estimates of Risk, Benefits and Consumption Advice
Table 1 outlines the results when applying the Ginsberg et al. risk/benefit estimation based on mean MeHg and PUFA-3 if the app user reports consuming six ounces of fish per week. Lake trout and whitefish caught in the tribal fishery areas impart substantial benefits even when attenuated for MeHg, but not other PBT, risks (Table 1). For example, predicted benefits for whitefish were +3.9 VRM points/ −22.5% CHD risk (L. Superior), +1.7 VRM points/−14.1% CHD risk (L. Michigan), and +2.2 VRM points/−16% CHD risk (L. Huron). Walleye returned slightly increased risks from MeHg even when attenuated for PUFA-3 benefits, and consequently appeared at the bottom of the list when ranked by magnitude of predicted benefit (Figure 2B). MeHg is the leading health concern in Walleye and the benefits of consumption to both fetuses and adults do not clearly outweigh the risks. For these sorts of fish Ginsberg et al. recommend adherence to a reference dose (Ginsberg, et al. 2015). Therefore, the ATSDR MRL of 0.3 ug/kg/day was applied to Walleye in the recommendations page for meal frequencies. Since whitefish and lake trout demonstrate clear PUFA-3 benefits when adjusting for MeHg using the Ginsberg et al (2009, 2015) method, the upper limits of recommended consumption for these fish were based on mean PCB burdens and the corresponding HPV as described in Figure 3.
Table 1:
Data and risk estimates used to rank fish from the 1836 treaty-ceded waters. VRM indicates estimated net effect of MeHg and fish oils on neurodevelopment at 6 months of age, one 6-oz fish meal per week. Mean PCBs also provided per fish. CHD indicates estimated net effect of MeHg and fish oils on percent reduction in relative cardiovascular risk, one 6-oz meal per week. Negative number indicate decreased CHD risk.
| Species | Source | Mean PCB (ppm) |
Mean Hg(ppm) |
Mean PUFA- 3(mg/6oz) |
CHD Risk | VRM Net |
|
|---|---|---|---|---|---|---|---|
| 2012–2014 | Whitefish | Superior | 0.018 | 0.055 | 1080 | −22.53% | 3.92 |
| Michigan | 0.110 | 0.088 | 675 | −14.10% | 1.71 | ||
| Huron | 0.034 | 0.084 | 765 | −15.96% | 2.15 | ||
| Lake Trout |
Superior | 0.078 | 0.194 | 1575 | −31.87%% | 5.52 | |
| Michigan | 0.139 | 0.078 | 2325 | −64.66% | 12.02 | ||
| Huron | 0.079 | 0.118 | 1688 | −44.27% | 7.58 | ||
| 2004 | Walleye | Superiora | 0.005 | 0.25 | 320 | 12% | −1.46 |
| Michiganb | 0.033 | 0.31 | 400 | −18% | −2.23 | ||
| Huronc | 0.043 | 0.31 | 240 | 21% | −2.93 |
Waishkey Bay
Bay de Noc
Lake Munuscong
Meal frequency recommendation results depended on personal data input and lake selection. Given the following inputs; female, 155 lbs (70kg), <50 years of age, and 8-ounce meals, the app would return: 1 meals/week of walleye, 1 meals/week of lake trout, or 6 meals/week whitefish for Lake Superior. For Lake Michigan: 1 meals/week of walleye, 1 meal/week of lake trout, or 2 meal/week of whitefish. For Lake Huron, this hypothetical woman could consume 1 meals/week of lake trout or 3 meals/week of whitefish. In future iterations, the addition of fish length considerations could influence these recommendations. Also, a more sensitive reference dose/MRL may be selected in the future to protect children and fetuses from PCBs. App participants were advised that these estimates are not final and were only for app testing purposes.
Focus Group Responses and Discussions
Thirteen women and ten men participated in the three focus groups; one participant did not indicate a gender. Eight participants indicated that they were age 25−34; six individuals indicated age 35−44; five individuals indicated age 45−54; three individuals indicated age 55 and above; two participants did not indicate their age. All 24 respondents indicated that they had a high school or greater education. Almost all, (95%) of participants reported using the internet for food or medical information in the past year, indicating a strong tendency to use new technology for health information.
Table 2 summarizes the ARS data from focus group questions. Both the quantitative responses (ARS) and the qualitative discussions (summarized by the Anishinaabe facilitators) revealed similar concerns and themes. When asked about fish consumption, two concerns were highlighted: 1) that fish consumption was a healthy and culturally important practice and 2) exposing themselves and their families to chemical contaminants that might pose health risks. Some resented any restrictive recommendations saying, “The app is too negative, it’s going to scare people away from eating fish.” Another participant said, “Warnings can turn people off from consuming fish.” Nevertheless, in the ARS questionnaire, most (61%) of participants stated they would consume more fish if they had regular access to Gigiigoo’inaan.
Stigmatizing fish consumption via risk assessment was a prominent concern in disucssion: “It needs to say, ‘safe and healthy to eat fish’ to focus on the healthy parts and not the contaminants of the fish. It’s not the fish – [advisories] make it seem like the fish are bad, but it’s not the fish, it’s the environment.” Pollution of the lakes was common knowledge and discussed at length. Many of the questionnaire responses (66%) reported that they do not limit consumption of wild caught fish due to contamination although 92% believed they are regularly exposed to contaminants. Perceived sources of contaminants were discussed: “freighters pull around by the Island and dump their waste.” Someone noted that: “It’d make you not want to go in the water, let alone eat the fish.” In tension with these concerns, another respondent worried that children were losing their cultural connection to fish: “We need to educate children, especially ages 9−12 or 2−3 grade, we need to teach them early, fresh out the gate. We used to be fishing families…we would harvest the fish.”
Many appreciated the culturally-tailored components of the app including the use of Ojibwe fish names and woodland art to represent the fish (Figure 2B). During the ARS questionnaire, most (75%) of the participants agreed that the app was useful, culturally appropriate (74%) and helped them identify the best fish to eat (78%). Recommendations included integrating more cultural features into the app such as use of Anishinaabe Great Lake names, fish preparation and cooking instructions, cultural stories, and access to details on treaty rights. Some requested further traditional teachings to complement the cultural artwork.
The focus group discussions, as well as the ARS data, reiterated previous findings (Dellinger, et al. 2008, Dellinger, et al. 2006) that the Anishinaabe are culturally motivated to consume fish. However, many respondents also expressed concerns about safely eating fish and feeding their families, particularly for vulnerable groups such as women and children. Users appreciated the ability to change serving sizes and weights to calculate safe consumption for their whole family. Suggestions for future software versions include more data summaries of PBTs in lakes and fish, further access to the data and calculations, and explanations of the recommendations. Respondents expressed an interest to better understand the meaning of contaminant levels. One participant requested, “…how does mercury and contaminants affect you – should I really be worried? How will it really affect me?”
DISCUSSION
Lessons learned from Gigiigoo’inaan programing and advisory outputs
We recently reported that tribal harvests in the area covered by CORA (Figure 1) may offer considerable health benefits, especially when compared to popular alternatives such as tuna, tilapia, swordfish, and processed fish sticks (Dellinger and Ripley 2016). The updated data in Table 1 support this and the results from fish throughout the Great Lakes would likely follow similar trends. The Ginsberg et al. (2009, 2015) calculations were therefore used to rank fish by benefit for the app using updated data in the hopes of presenting a positive message at the outset of the advisory. This presentation of fish healthfulness was met with mixed reactions both from the focus groups and from the research team during development. Although the desire for positive messaging has been unanimous from Anishinaabe focus groups both now and in past projects, it was clear that the primary metric of interest was: “how much can I safely eat?” Thus, many were confused by the discordance between the app reporting a highly beneficial fish (i.e. lake trout) and the advice that it should be eaten less than a fish with less PUFA-3s such as whitefish (which is lower in PCBs). It also presents a conundrum in which advisories lead to the primacy of consumption limits based on risk assessment. This approach is generally viewed negatively by the Anishinaabe as illustrated from the current focus group reports.
Presenting benefits as Hg vs PUFA-3 can mislead the consumer since fish with relatively low PUFA-3 and MeHg (such as perch) could seem “less beneficial” which would be an overgeneralization. For example, the PUFA-3 benefit coefficient for neurodevelopment in Ginsberg et al (2015) is calibrated to match observational studies that demonstrate health benefits from consuming fish meals. The positive health associations found in the epidemiological literature do not necessarily reflect an exclusive PUFA-3 effect and consumption of species like perch and walleye may impart more benefits that the model accounts for. It is therefore crucial that advisories seeking to convey a fair representation of fish consumption benefits include other, thoughtfully-placed, information. This may include PUFA-3/6 ratios, selenium, and traditional/cultural knowledge.
The next version of the app will include more species of local fish and rank them by their highest recommended consumption rate (based on PBTs and the formula described in Figure 3). Advice will be carefully crafted to clearly emphasize advice that promotes consumption of fish to gain the benefits and exercise cultural practices whilst minimizing PBT exposure. Discussions are underway with programmers and tribal representatives to explore improved messaging using this new format. Ideas for future iterations include: dietary tracking and budgeting, further personalization of recommendations based on fish length, as well as fish cooking recipes and traditional knowledge from Anishinaabe culture. Since meal recommendations and risk/benefit quantifications can lead to conflicting messaging (i.e. a trout scoring high PUFA-3 benefits but also high PCB risks), future iterations will order the fish from most to least consumable meals based on PBT reference doses/MRLs. Calculations relating to the Ginsberg and Toal method will be featured in the specific recommendations page along with guidelines based on PBT reference doses. Also, changes are underway to add a more sensitive calculation for upper-limit PBT advice to accommodate women who may become pregnant and small children. These criteria will be discussed with Anishinaabe stakeholders and added to Gigiigoo’inaan via the process illustrated in Figure 4.
Lessons Learned from Preliminary Evaluation of Gigiigoo’inaan
These results emphasize the importance of culturally-tailored fish consumption advice. The focus group responses should be interpreted with the understanding that the focus group sample size is small and non-random. Selection bias, in this case, may favor those who are inclined to eat fish. Nevertheless, these results are consistent with past focus groups in which negative sentiments towards pollution in fish were coupled with an unfulfilled desire to consume them (Dellinger, et al. 2006, Dellinger 2007). This appears less paradoxical if Anishinaabe (and Native American) culture is considered. In these cultures, environmental priorities are bound to subsistence practices and natural resource security is considered a health outcome (Donatuto et al. 2014, Arquette et al. 2002). The health of the ecosystem is therefore considered a spiritual link to well-being. Negative emotions relating to risk assessment and consumption advisories are compounded by: 1) historical distrust due to ethical violations from past research practices and policies, 2) the potential for emotional harm (disproportionate to the actual risk) from learning of an above-average exposure, 3) concerns that the data may be misinterpreted or misused to stigmatize Anishinaabe culture, and 4) an attitude of communal privacy, in which exposure levels are perhaps best left unshared with the outside world.
Gigiigoo’inaan was built with the understanding that contamination of the food chain generates multiple forms of harm to human wellbeing. This harm may occur via excess health risks to those who choose to ignore fish consumption advisories for cultural reasons. There is also indirect harm to those who reduce their cultural practices which would normally improve their health (i.e. safe consumption of nutritious fish, exercise, and stress reduction by engaging with the local ecosystem). Moreover, the economic harms to commercial tribal fishermen have been cited in multiple focus groups from related projects over the past decade (Dellinger, et al. 2008, Dellinger 2007, Dellinger et al. 2012). Quantifications of the human consequences of these factors would greatly further the science. Furthermore, the consequences of selecting nutritionally-unhealthy foods as a response to avoiding certain PBTs require more investigation. Mobil technology may open doors to investigating these dynamics by allowing for reliable dietary tracking and reporting.
The focus group notes reveal that at least two of the participants hold subsistence licenses, indicating that consumption of fish (contaminated or otherwise) is part of their livelihood. The question was not asked directly but, based on the discussion notes and the ARS responses, 10−20% of participants appear to represent a subgroup of Anishinaabe who would not change their behaviors in response to fish consumption advisories due to the cultural and economic importance of fishing. Special care will be given to the updated versions of the software to motivate their usage of the app. Future studies are planned to provide a large cohort with an updated, more comprehensive, version of Gigiigoo’inaan and track usage as well as behavior (fish consumption and species selection) change.
CONCLUSION
Testing of the pilot software, Gigiigoo’inaan [Our Fish], demonstrates the importance of designing culturally-adapted risk communication to resonate with vulnerable populations. These preliminary results are being used to guide the next iteration of testing Gigiigoo’inaan for acceptability, utility, and behavior change. Participants expressed a desire for a culturally appropriate app that recognizes Great Lakes fish as positive nutritional and cultural resources for Anishinaabe. Of further importance is the need to regain the community’s interest and faith in natural resources by demonstrating that risk assessment techniques do reveal the nutritional value, and relative safety, of many fish including culturally-important species. The focus groups’ interest in Gigiigoo’inaan supports our a priori assumptions that the Anishinaabe tribes desire messaging that promotes the stewardship and use of natural resources.
ACKNOWLEDGEMENTS
The authors would like to thank the Dustin Hahn and the students at the University of Milwaukee, WI Mobile Innovation Laboratory for programming Gigiigoo’inaan. They also thank the Great Lakes Native American Research Center for Health for providing support to this and other similar projects in the region. This work was funded by the National Institute for Environmental Health Sciences (NIEHS) grant number: 1R21ES025788–01 with additional support from the Sault Ste. Marie Tribe of Chippewa Indians. The authors thank the tribal fishing families, the Sault Ste Marie Tribe, and the Chippewa Ottawa Resource Authority who have dedicated two decades of work to collecting these data. Tribal resources provided most of the analytical support in addition to partial support from the Agency for Toxic Substances and Disease Registry’s Great Lakes Human Health Effects program with Dr. J. Dellinger as the principal investigator, and the Indian Health Service’s Native American Research Centers for Health program.
REFERENCES
- United States v. Michigan, 471 F. Supp. 192 (W.D. Mich. 1979), aff’d 653 F.2d 277 (6th Cir. 1981), cert. denied, 454 U.S. 1124 (1981).
- Quaife MM. 1947. The western country in the 17th century: the memoirs of Lamothe Cadillac and Pierre Liette, The Lakeside Press, Chicago [Google Scholar]
- Mozaffarian D and Rimm EB 2006. Fish intake, contaminants, and human health – Evaluating the risks and the benefits. JAMA-J Am Med Assoc 296: 1885−99 [DOI] [PubMed] [Google Scholar]
- Mozaffarian D and Wu JH 2011. Omega-3 fatty acids and cardiovascular disease: effects on risk factors, molecular pathways, and clinical events. Journal of the American College of Cardiology 58: 2047−67 [DOI] [PubMed] [Google Scholar]
- Mozaffarian D and Wu JH 2012. (n-3) fatty acids and cardiovascular health: are effects of EPA and DHA shared or complementary? The Journal of nutrition 142: 614s-25s [DOI] [PMC free article] [PubMed] [Google Scholar]
- Turyk ME , et al. 2012. Risks and benefits of consumption of Great Lakes fish. Environ Health Perspect 120: 11−8 [DOI] [PMC free article] [PubMed] [Google Scholar]
- USDA. 2015. 2015 – 2020 Dietary Guidelines for Americans US Government Printing Office, 8th ed. U.S. Department of Agriculture and U.S. Department of Health and Human Services, Wasington, D.C. [Google Scholar]
- Dellinger JA 2004. Exposure assessment and initial intervention regarding fish consumption of tribal members of the Upper Great Lakes Region in the United States. Environ Res 95: 325−40 [DOI] [PubMed] [Google Scholar]
- Ho L , et al. 2008. Food-related behavior, physical activity, and dietary intake in First Nations – a population at high risk for diabetes. Ethnicity & health 13: 335−49 [DOI] [PubMed] [Google Scholar]
- Schell LM 2012. Transitioning from traditional: pollution, diet and the development of children. Collegium antropologicum 36: 1129−34 [PubMed] [Google Scholar]
- Whiting SJ and Mackenzie ML 1998. Assessing the changing diet of indigenous peoples. Nutrition reviews 56: 248−50 [DOI] [PubMed] [Google Scholar]
- Story M , et al. 2003. Obesity in American-Indian children: prevalence, consequences, and prevention. Preventive medicine 37: S3-12 [DOI] [PubMed] [Google Scholar]
- GLITEC. 2011. Community Health Data Profile: Michigan, Minnesota, and Wisconsin Tribal Communities, 2010. Lac du Flabeau, WI [Google Scholar]
- Ginsberg GL and Toal BF 2009. Quantitative approach for incorporating methylmercury risks and omega-3 fatty acid benefits in developing species-specific fish consumption advice. Environ Health Perspect 117: 267−75 [DOI] [PMC free article] [PubMed] [Google Scholar]
- Ginsberg GL , et al. 2015. Updated Risk/Benefit Analysis of Fish Consumption Effects on Neurodevelopment: Implications for Setting Advisories. Human and Ecological Risk Assessment: An International Journal 21: 1810—39 [Google Scholar]
- Dellinger MJ and Ripley MP 2016. Mercury risks versus nutritional benefits of tribal commercial fish harvests in the Upper Laurentian Great Lakes. Human and Ecological Risk Assessment: An International Journal 22: 1036−49 [Google Scholar]
- File T 2013. Computer and Internet Use in the United States Washington, DC. [Google Scholar]
- Pingatore N 2014. Sag Chip Tech Survey. In: Dellinger MJ (ed). Inter-Tribal Council of Michigan, unpublished [Google Scholar]
- Dellinger MJ , et al. 2015−2017. A Fish Consumption Advisory to Promote Anishinabe Environmental Health Literacy. National Institute for Environmental Health Sciences 1R21ES025788–01, Medical College of Wisconsin [Google Scholar]
- Dellinger JA , et al. 2014. Contaminant Trends in Freshwater Fish from the Great Lakes: A 20 Year Analysis. Human and Ecological Risk Assessment 20: 461−78 [Google Scholar]
- Moths MD , et al. 2013. Omega-3 Fatty Acids in Fish from the Laurentian Great Lakes Tribal Fisheries. Human and Ecological Risk Assessment 19: 1628−43 [Google Scholar]
- ITFAP. 2008. Quality Assurance Project Plan for Fish Contaminant Monitoring Program 179 West Three Mile Road, Sault Sainte Marie, Michigan: 49783 [Google Scholar]
- Williams MCW , et al. 2014. Fatty acids in thirteen Wisconsin sport fish species. Journal of Great Lakes Research 40: 771−7 [Google Scholar]
- ATSDR. 2014. Minimal Risk Levels for Hazardous Substances Atlanta, Georgia [Google Scholar]
- Anderson H , et al. 1993. Protocol for a Uniform Great Lakes Sport Fish Consumption Advisory Great. Wisconsin Department of Natural Resources, Wisconsin Department of Health and Social Services [Google Scholar]
- Guallar E , et al. 2002. Mercury, fish oils, and the risk of myocardial infarction. The New England journal of medicine 347: 1747−54 [DOI] [PubMed] [Google Scholar]
- Ohno T , et al. 2007. Total mercury levels in hair, toenail, and urine among women free from occupational exposure and their relations to renal tubular function. Environ Res 103: 191−7 [DOI] [PubMed] [Google Scholar]
- ODPHP. 2014. Health Literacy Online: A Guide to Writing and Designing Easy-to-Use Health Web Sites. Office of Disease Prevention and Health Promotion, vol 2014 Office of Disease Prevention and Health Promotion, [DOI] [PubMed] [Google Scholar]
- Dellinger J , et al. 2008. ‘Eat More Fish but Choose Wisely’ Risk Reduction Strategy for Michigan Anishnaabe Tribes: Preliminary Evaluation of DVD. Native American Health Research Portland, Oregon [Google Scholar]
- Dellinger M , et al. 2006. From the Lab to the Community: Helping Tribal Members Choose the Safest Fish to Eat., Indian Health Service Research Albuquerque, NM [Google Scholar]
- Dellinger MJ. 2007. Using Translational Research to Create Culturally Relevant Fish Consumption Advisories. Clinical Laboratory Department, vol Master of Science, pp. 79 University of Wisconsin-Milwaukee, UW Libraries [Google Scholar]
- Donatuto J , et al. 2014. Indigenous Community Health and Climate Change: Integrating Biophysical and Social Science Indicators. Coastal Management 42: 355−73 [Google Scholar]
- Arquette M , et al. 2002. Holistic risk-based environmental decision making: a Native perspective. Environ Health Perspect 110 Suppl 2: 259−64 [DOI] [PMC free article] [PubMed] [Google Scholar]
- Dellinger JA , et al. 2012. Chapter 14 Mercury Exposure in Vulnerable Populations: Guidelines for Fish Consumption. In: Bank MS (ed), Mercury in the Environment: Pattern & Process, pp. 289−300. University of California Press, Berkeley, CA [Google Scholar]