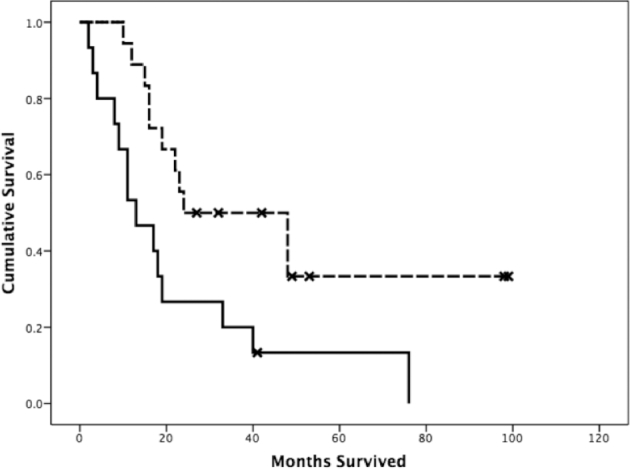
FIGURE 5.

Kaplan–Meier log-rank survival functions (measured in months from DTI) grouped by left SLF LTD and tumor grade. The dashed line represents subjects with high-grade tumors and SLF LTD > 1 cm, while the bottom solid line represents subjects with high-grade tumors with SLF LTD < 1 cm.
