

Supplemental Digital Content is available in the text.
Keywords: blood pressure; cholesterol, LDL; coronary disease; lipoproteins, HDL2; population; risk factors
Abstract
Background:
To optimize preventive strategies for coronary heart disease (CHD), it is essential to understand and appropriately quantify the contribution of its key risk factors. Our objective was to compare the associations of key modifiable CHD risk factors—specifically lipids, systolic blood pressure (SBP), diabetes mellitus, and smoking—with incident CHD events based on their prognostic performance, attributable risk fractions, and treatment benefits, overall and by age.
Methods:
Pooled participant-level data from 4 observational cohort studies sponsored by the National Heart, Lung, and Blood Institute were used to create a cohort of 22 626 individuals aged 45 to 84 years who were initially free of cardiovascular disease. Individuals were followed for 10 years from baseline evaluation for incident CHD. Proportional hazards regression was used to estimate metrics of prognostic model performance (likelihood ratio, C index, net reclassification, discrimination slope), hazard ratios, and population attributable fractions for SBP, non–high-density lipoprotein cholesterol (non–HDL-C), diabetes mellitus, and smoking. Expected absolute risk reductions for antihypertensive and lipid-lowering treatment were assessed.
Results:
Age, sex, and race capture 63% to 80% of the prognostic performance of cardiovascular risk models. In contrast, adding either SBP, non–HDL-C, diabetes mellitus, or smoking to a model with other risk factors increases the C index by only 0.004 to 0.013. However, primordial prevention could have a substantial effect as demonstrated by population attributable fractions of 28% for SBP≥130 mm Hg and 17% for non–HDL-C≥130 mg/dL. Similarly, lowering the SBP of all individuals to <130 mm Hg or lowering low-density lipoprotein cholesterol by 30% would be expected to lower a baseline 10-year CHD risk of 10.7% to 7.0 and 8.0, respectively (absolute risk reductions: 3.7% and 2.7%, respectively). Prognostic performance decreases with age (C indices for age groups 45–54, 55–64, 65–74, 75–84 are 0.75, 0.72, 0.66, and 0.62, respectively), whereas absolute risk reductions increase (SBP: 1.1%, 2.3%, 5.4%, 10.3%, respectively; non–HDL-C: 1.1%, 2.0%, 3.7%, 5.9%, respectively).
Conclusions:
Although individual modifiable CHD risk factors contribute only modestly to prognostic performance, our models indicate that eliminating or controlling these individual factors would lead to substantial reductions in total population CHD events. Metrics used to judge importance of risk factors should be tailored to the research objectives.
Clinical Perspective.
What Is New?
We estimate that age, sex, and race capture 63% to 80% of the prognostic performance of cardiovascular risk models.
Adding either systolic blood pressure, non–high-density lipoprotein cholesterol, diabetes mellitus, or smoking to a model with other risk factors increases prognostic performance as measured by the C index by only 0.004 to 0.013.
Lowering the systolic blood pressure of all individuals to <130 mm Hg or lowering low-density lipoprotein cholesterol by 30% would be expected to lower a baseline 10-year coronary heart disease risk of 10.7% to 7.0 and 8.0, respectively (absolute risk reduction: 3.7 and 2.7%, respectively).
Prognostic performance of risk models decreases with age whereas absolute risk reductions increase with age.
What Are the Clinical Implications?
Although individual modifiable coronary heart disease risk factors contribute only modestly to model prognostic performance, eliminating or controlling these factors would lead to substantial reductions in total population coronary heart disease events.
The absolute risk reductions associated with lowering the systolic blood pressure of all individuals to <130 mm Hg or low-density lipoprotein cholesterol by 30% correspond to the respective numbers needed to treat of 27 and 37. These absolute risk reductions increase with increasing risk and age.
Metrics used to judge importance of risk factors should be tailored to the research objectives.
Historically, the importance of individual risk factors has often been quantified by measures of association such as the hazard ratio (HR). More recently, researchers began quantifying the importance of these factors based on their ability to increase the overall prognostic performance (eg, area under the receiver operating characteristic curve or C index) of a multivariable risk prediction model.1,2 Alternatively, population attributable fractions (PAFs), which incorporate both the strength of association between the risk factor and disease outcome, as well as the prevalence of the risk factor, have been used to reflect the risk factor’s public health burden with a focus on primordial prevention.3,4 Primordial prevention refers to preventative efforts intended to eradicate risk factors before they occur, such as elimination of smoking. In contrast, primary prevention is focused on reducing levels of risk factors that already exist. In the last few years, several authors have stressed the importance of the concept of treatment benefit in primary prevention.5,6 Treatment benefit because of reduction of risk factor levels estimated by the absolute risk reduction (ARR) and number needed to treat (NNT) offers another framework through which to evaluate the importance of a risk factor.
Given that different measures of association and model performance address different questions, it is conceivable that they might give different impressions regarding the relative importance of various coronary heart disease (CHD) risk factors. We sought to quantify and compare the relative importance of modifiable CHD risk factors (lipids, systolic blood pressure [SBP], diabetes mellitus, and smoking) on the likelihood of CHD events in a large cohort of individuals free of cardiovascular disease by utilizing several widely used metrics of association, including change in prognostic performance of risk models, PAF, and treatment benefit. We also investigated how these measures changed as a function of age and risk-factor thresholds applied.
Methods
We used publicly available data (therefore, we will not be making them available) from four large observational cohorts from the National Heart, Lung, and Blood Institute’s (NHLBI) Biological Specimen and Data Repository Information Coordinating Center7: (1) Atherosclerosis Risk in Communities (ARIC) study; (2) Cardiovascular Health Study (CHS); (3) Framingham Offspring study; and (4) Multi-Ethnic Study of Atherosclerosis (MESA). Patient-level data were pooled to create the analytic dataset. Participants aged 45 to 84 years were eligible for inclusion if they were free of cardiovascular disease (myocardial infarction, angina or coronary insufficiency, stroke, transient ischemic attack, claudication, peripheral arterial disease, or heart failure) at the study examination selected as baseline (1992–2002; Table 1). After excluding 332 individuals with missing covariate information or no follow-up data, 22 626 persons were included in the analysis (see Table I in the online-only Data Supplement for detailed exclusions by cohort).
Table 1.
Baseline Characteristics

Follow-up for new-onset CHD events (defined as myocardial infarction, CHD death, angina, or coronary insufficiency) was censored at 10 years, which was the overall median for follow-up in the study cohort. A piecewise constant hazards model with 1-year intervals was used to evaluate the association between incident CHD and the following prespecified risk factors: non–high-density lipoprotein cholesterol (non–HDL-C; the difference between total cholesterol and HDL-C), SBP, diabetes mellitus, and smoking (defined as smoking within the past year or currently smoking). Given the primary interest in the contribution to the model of the underlying risk factor, to reduce confounding because of antihypertensive and lipid-lowering therapy, SBP and total cholesterol were adjusted for treatment using a nonparametric approach, which imputes the most plausible value of the risk factor if the person was not on treatment (Methods in the online-only Data Supplement).8,9 Models were adjusted for age, sex, and black race. We elected to use non–HDL-C (versus total or low-density lipoprotein-cholesterol [LDL-C] and HDL-C separately) to include a composite measure of dyslipidemia with a single HR which matches the lipid parameters used in the Pooled Cohorts Equations.10
Statistical Analysis
Prognostic performance of risk models was assessed for each risk factor included in the model as a single predictor (variable-added-first), as well as the loss of performance because of omission of the risk factor from the full model (variable-added-last), which included age, sex, race, adjusted SBP, adjusted non–HDL-C, diabetes mellitus, and smoking. Four standard metrics of model performance were used: the −2 log likelihood ratio,11 discrimination C index, maximum relative utility, and discrimination slope. The −2 log likelihood ratio is a measure of model fit and is related to the probability of observing the data, given the model as specified. The C index estimates the probability that given 2 individuals, a model assigns a higher risk to a person who experiences an event compared with one who experiences an event later in time, or does not experience the event.12 The maximum relative utility, also called reclassification from the null model, is the difference in the net proportions of individuals with events versus those without events whose predicted risks move higher under the full model compared with the null model, which assigns everyone the same risk equal to the event incidence rate. The difference in maximum relative utilities is a version of the net reclassification index with 2 categories defined by the event rate, which avoids the limitations of other forms of the net reclassification index.13 The discrimination slope estimates the difference in mean estimated risks between those who do and do not experience the event.14
An alternative approach to quantifying the importance of risk factors focuses on HRs, PAFs, and ARRs or NNTs. The same full model described above was used to estimate and compare the HRs and PAFs of CHD attributable to each risk factor taking into account the time-to-event nature of the data described by Laaksonen et al with confidence interval for the PAFs derived using the delta method and a normal approximation for the sampling distribution of PAFs.4,15 The PAF quantifies the percentage decrease in total disease burden across the population, had the risk factor not been present (primordial prevention). Reference categories for PAFs were <130 mm Hg for SBP and <130 mg/dL for non–HDL-C—that is, the PAF for SBP at <130 mm Hg is the proportion of incident CHD in 10 years that would have been avoided if every person’s SBP were <130 mm Hg. To evaluate the impact of varying thresholds on PAF, we evaluated the PAF of SBP and non–HDL-C using the 20th through the 90th percentiles of their distribution in our sample.
The potential benefits of lipid lowering and blood pressure treatment (primary prevention) were estimated using treatment effects observed in randomized clinical trials.5 For lipids, every 38.7 mg/dL reduction in LDL-C is expected to reduce CHD risk by 25%; for SBP, every reduction of 10 mm Hg is expected to lower risk by 21%.16 To estimate the degree of LDL-C lowering, we applied a 30% reduction in LDL-C among those with LDL-C >70 mg/dL, consistent with what is expected with a moderate intensity statin. We also modeled 50% reduction consistent with high-intensity statin as a sensitivity analysis. For SBP, we calculated the degree of elevation over 130 mm Hg to estimate the impact of treating all adults to an SBP <130 mm Hg, a level consistent with the most recent guidelines.17 The relative risk reduction was estimated for each individual by combining the expected reductions in CHD because of LDL-C or SBP lowering. The relative risk reduction was then applied to the 10-year estimated risk for each individual and ARRs were derived as the average of these quantities. The NNTs were computed as the inverse of the ARR (see the Methods in the online-only Data Supplement for more details).
All analyses were first conducted in the full cohort and then repeated separately by age group: 45 to 54, 55 to 64, 65 to 74, and 75 to 84 years. Two key sensitivity analyses were conducted. First, we investigated the impact of study effect on the observed results by adding study as a fixed as well as a random effect (frailty model). Second, we reran all models adjusting for the potential impact of the competing risk of noncardiovascular mortality. Finally, we ran models separately for women and men. We used SAS version 9.4 (SAS Institute Inc, Cary, NC). The study was approved by the Duke University Health System Institutional Review Board (Pro00051569). All cohorts obtained informed consent from participants for inclusion.
Results
Overall, 22 626 individuals free of cardiovascular disease at baseline examination between 1992 and 2002 met the inclusion criterion. Table 1 summarizes the baseline characteristics of the study cohort, overall and by age. Mean SBP, the prevalence of blood pressure treatment, and the prevalence of diabetes mellitus increased with age while smoking declined. Conversely, lipid levels were more stable across the age groups, with the highest percentage of individuals on lipid-lowering treatment in the 65 to 74 age group.
Risk Factors and Their Effects on Metrics of Prognostic Model Performance
Table 2 summarizes prognostic metrics (−2 log likelihood, C index, reclassification from the null, and discrimination slope) for modifiable risk factors, and age, sex, and race grouped as 1 nonmodifiable factor. Three scenarios are presented with only an individual risk factor, the full model with all risk factors (age, sex, race, SBP, non–HDL-C, smoking, and diabetes mellitus), and the full model minus each risk factor. We observed that, depending on the metric, nonmodifiable risk factors (age, sex, and race) account for 63% to 80% of the overall prognostic model performance. Among the modifiable risk factors, SBP is the strongest predictor as assessed by each of the 4 performance metrics; for example, a model using SBP alone can achieve >50% of the full model’s prognostic value as measured by the C index or reclassification from the null.
Table 2.
Contribution of Risk Factors to Prognostic Performance of 10-Year CHD Risk Model
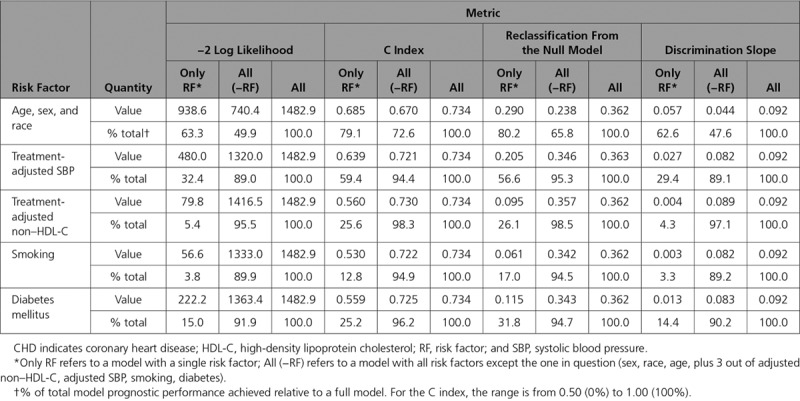
From the variable-added-last perspective, which summarizes the improvement in prognostic value achieved when the risk factor of interest is added to a model with all other risk factors present, SBP moves the C index from 0.721 to 0.734 (Δc=0.013) and the reclassification from the null from 0.346 to 0.363 (net reclassification index=0.017). This small magnitude is consistent when using other metrics (assessed by the −2 log likelihood or discrimination slope, the model is at ≈89% of its full performance without SBP) or other risk factors.
Performance Metrics Based on HRs, PAFs, and Treatment Benefit
Table 3 provides a different perspective on the relative importance of cardiovascular risk factors. Here, the HRs for the 4 risk factors are summarized first for univariable models, then adjusting for all other risk factors. Also summarized are the PAFs for CHD attributable to each risk factor. HRs for SBP and non–HDL-C are expressed per 1 SD increase, whereas those for smoking and diabetes mellitus treat them as binary characteristics. Both unadjusted and adjusted HRs are higher for SBP than non–HDL-C. However, adjustment substantially decreases the HR for SBP (1.57 to 1.33), but not for non–HDL-C (1.19 versus 1.18). Similarly, the unadjusted HR is higher for diabetes mellitus than for smoking (2.31 versus 1.52), yet the adjusted HRs are similar (1.80 versus 2.01).
Table 3.
Hazard Ratio, Population Attributable Fraction, and Absolute Risk Reduction With Treatment for 10-Year Risk of CHD
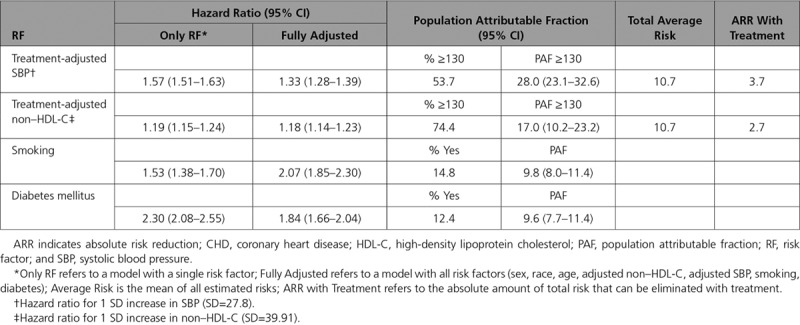
The PAFs for both SBP ≥130 mm Hg and non–HDL-C ≥130 are 28% and 17%, respectively, whereas the PAFs for diabetes mellitus and smoking are 9.6% and 9.8%, respectively. To determine what benefit could be derived through treatment of elevated SBP and lipids (primary prevention), we estimated the expected risk reduction via lowering SBP for all adults with SBP ≥130 mm Hg to <130 mm Hg and a 30% reduction in LDL-C. For SBP, treating all adults to <130 mm Hg is expected to reduce the expected baseline 10-year CHD incidence of 10.7% by an ARR of 3.7% (NNT=27). Treatment with a moderate intensity statin is expected to result in an ARR of 2.7% (NNT=37) and with a high intensity statin (50% reduction in LDL-C) an ARR of 4.1% (NNT=24).
Association of Participant Age and Performance Metrics
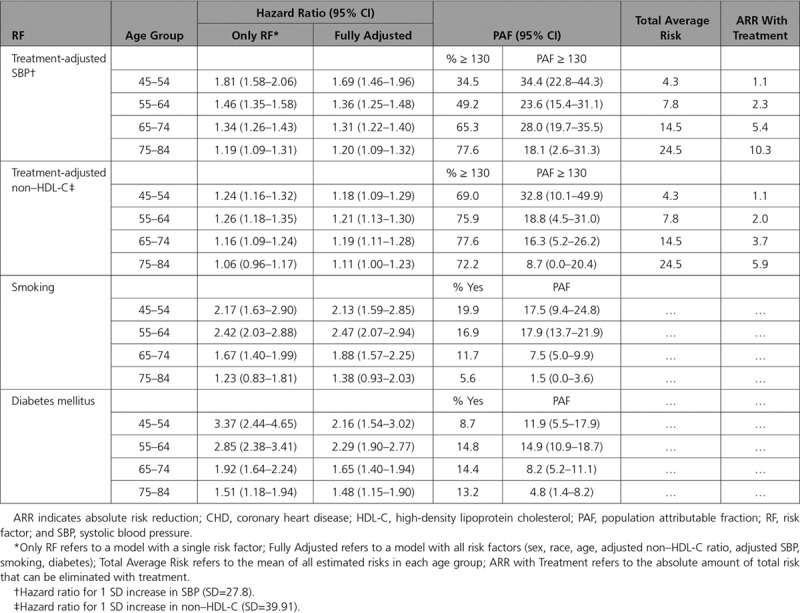
Figure 1 shows that the prognostic performance of the risk model decreases with age when assessed by the C index (other metrics of prognostic performance yield consistent results; data not shown). In contrast, the ARRs that can be achieved with SBP or non–HDL-C treatment increase with age. The higher ARRs are consistent with the amount of total average risk in each age group; as shown in Table 4, this risk increases with age and reaches 24.5% among 75- to 84-year-olds. The trend is the opposite for the PAFs, which generally decline with age. HRs also decline as a function of age for all risk factors, except non–HDL-C, which remains flat for the younger 3 age groups.
Figure 1.
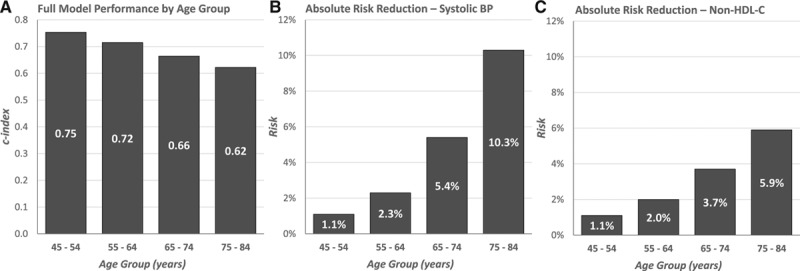
Prognostic performance of the full risk model and absolute risk reductions associated with lowering of systolic blood pressure (SBP) and non–high-density lipoprotein cholesterol (non–HDL-C) by age group. A, C index of models with all risk factors (age, sex, race, SBP, non–HDL-C, diabetes mellitus, and smoking). B, Expected absolute risk reduction associated with lowering SBP below 130 mm Hg. C, Expected absolute risk reduction associated with lowering the low-density lipoprotein cholesterol portion of non–HDL-C by 30%.
Table 4.
Hazard Ratio, Population Attributable Fraction, and Absolute Risk Reduction With Treatment for 10-Year risk of CHD by Baseline Age Category
Sensitivity Analyses
Importantly, the PAFs for continuous risk factors are highly dependent on the cut-off selected to define high risk, with lower cut-offs associated with higher PAFs (Figure 2). Adding study to the model either as a stratum or a fixed or random effect had little effect on the observed results as demonstrated in Table II in the online-only Data Supplement. Similarly, the results remained consistent after adjustment for competing risk of noncardiovascular mortality (Table III in the online-only Data Supplement). Table IV in the online-only Data Supplement presents results separately for women and men.
Figure 2.
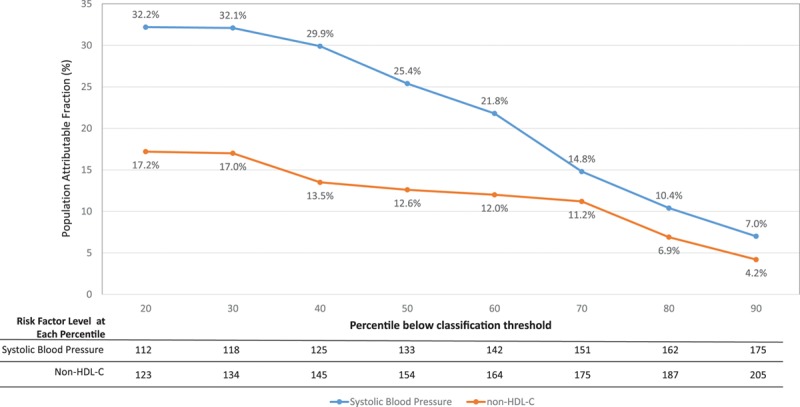
Population attributable fraction (PAF) for blood pressure and lipids as a function of percentage of individuals below the classification threshold. The 2 curves present PAFs as a function of risk factor level threshold (ie, the percentage of coronary heart disease risk that could be eliminated if systolic blood pressure [SBP] or non–high-density lipoprotein cholesterol levels never exceeded the numbers given in the table at the bottom [which correspond to the percentiles of risk factor distribution in our sample]). For example, the PAF associated with keeping SBP <125 mm Hg (40th percentile) is 29.9%, but it drops to 21.8% for SBP <142 mm Hg (60th percentile).
Discussion
In this report, we demonstrate how the assessment of importance of cardiovascular risk factors depends on the research question. Different answers might be derived depending on whether the main objective is to study association, to assess contribution to the prognostic value of a model, or to evaluate the impact of altering the risk factor through an intervention. Appropriately adjusted HRs are best suited to quantify associations between the risk factor and outcome. Focusing on metrics of prognostic performance is the preferred approach when the clinical goal of measuring a risk marker is better risk stratification. This is the case for biomarkers or genetic factors where in most instances we cannot eliminate mutations or treat levels that are associated with increased risk. The order in which variables are entered into the model also matters: the conservative variable-added-last approach seems well-suited for applications involving new biomarkers or genetic factors. On the other hand, we have shown how applying this approach to established risk factors, of which modification with treatment is known to reduce risk, can mask important benefit to individuals and populations. Indeed, we have shown that the majority of prognostic information included in the 10-year CHD risk models is dominated by nonmodifiable factors such as age, sex, and race, with only 20% to 37% (depending on the metric used) of the overall prognostic performance attributed to modifiable CHD risk factors. However, our models indicate that primary prevention of CHD through control of either hypertension or lipids could reduce the 10.7% 10-year incidence of CHD by more than a third or a quarter. In other words, to prevent 1 additional CHD event, we need to treat 27 of 37 adults with blood pressure/lipid lowering agents. Thus, our models suggest that when making individual treatment decisions, clinicians and patients should consider not only the 10-year risk of CHD, but also the expected benefit from the intervention best expressed as the ARR, which when inverted provides the number needed to treat to avert 1 bad outcome.5
We also observed that prognostic performance of risk models and the strength of association of risk factors with CHD decrease with age, suggesting that risk stratification becomes harder at older ages. This, coupled with the stronger association between risk factors and CHD at younger ages and higher PAFs, highlights the need for more effective primordial prevention efforts and targeted risk factor management in early adulthood. Indeed, it has been shown that prolonged elevation of risk factors over time results in a substantial increase in CHD risk.18 On the other hand, the absolute benefit from treatment is highest in the older age groups as the baseline risk increases with age. Our models suggest that the strategy of recommending treatment to older adults without overt elevations of the modifiable risk factors outlined by the American Heart Association/American College of Cardiology cholesterol guidelines19 is likely to result in meaningful benefit. At the same time, our results support incorporating risk and benefit considerations when making recommendations with regard to blood pressure treatment.20
We also investigated how control or elimination of a given risk factor can have significant impact on population CHD risk (as assessed by PAFs). However, interpretation of these findings has 3 important caveats. First, the PAF is an estimate of the percentage risk reduction expected if the risk factor had not been present at the start. But this statistic may not accurately estimate the effects of treatment used to control a risk factor that is present. As an example, the long-term CHD risk of an adult with previous hypertension who is pharmacologically treated to 130 mm Hg is different from someone whose SBP never crossed 130 mm Hg in the first place. Similarly, while smoking cessation reduces subsequent risk, it may not wipe out the effect of previous smoking. Thus, PAFs are more appropriately interpreted as the potential benefit achievable through primordial prevention of risk factors. The second caveat for estimating treatment benefits of continuous variables such as blood pressure or cholesterol levels using PAF is that the measured benefit is highly dependent on the threshold used. As demonstrated in Figure 2, the PAF attributed to SBP and non–HDL-C control can change 4-fold depending on the thresholds used. Finally, both PAFs and ARRs are functions of statistical modeling and should be interpreted as such.
A key strength of this investigation lies in the high-quality data obtained by pooling multiple studies available through the NHLBI Biological Specimen and Data Repository Information Coordinating Center repository, which contains publicly accessible datasets from NHLBI-sponsored cohort studies and randomized trials. The main limitation of our study is that some of our data come from the 1990s and thus may not fully reflect changes that have occurred in the past 15 years. However, while this may affect individual estimates, it is unlikely to impact the main conclusions of the analysis—that different ways of assessing risk factors can lead to different conclusions about their relative importance, and that variables with poor model performance, such as lipids, may have dramatic relevance when assessed using PAF or ARR. Moreover, we could not account for potential treatment initiation during follow-up because risk prediction is based on the information available at baseline. Additionally, as noted, calculations of PAFs had to rely on arbitrary classification thresholds. In calculation of the PAF for smoking, we used “not smoking currently” as the reference category. This categorization mixes never smokers and former smokers, possibly diluting the modeled associations in primordial prevention (and exaggerating those in primary prevention). Furthermore, estimates of the expected ARR assume that the benefits of treatment with statins extend over a 10-year period, and that all individuals can achieve an SBP of or below 130 mm Hg or a 30% reduction in lipids, and they do not account for potential side effects, discontinuations, and variability between individuals. Still, the assumed treatment goals are moderate, so on the average they should be achievable; we conservatively ignored potentially higher relative risk reductions associated with lipid treatment at lower risk levels and younger ages.5 We focused on risk over a 10-year time period; with a longer horizon, the benefits of prevention and treatment at younger ages might be higher. Finally, although the list of metrics considered is comprehensive, it is by no means exhaustive. For example, estimating the numbers of years gained through risk factor control offers an appealing metric for risk communication and may enable better estimation of benefits over the longer horizon.21
Conclusions
Our study demonstrates that assessing the importance of cardiovascular risk factors using improvement in prognostic performance does not adequately reflect the risk reduction that can be expected as a result of primordial or primary prevention. Moreover, the prognostic ability of cardiovascular risk models and PAFs decrease with age, whereas the risk itself and potential ARRs associated with treatment increase with age.
Acknowledgments
We thank Tony Schibler from Duke Clinical Research Institute for data programming assistance, and Peter Hoffmann from Duke Clinical Research Institute for his editorial assistance with this manuscript. We also thank the participants in each cohort study.
Sources of Funding
This work was supported by Regeneron and Sanofi Pharmaceuticals. The funders had no role in the design and conduct of the study; collection, management, analysis, and interpretation of the data; preparation, review, or approval of the manuscript; and decision to submit the manuscript for publication beyond the description of the roles of Drs Sanchez, Elassal and Khan. Dr Navar is supported by the National Institutes of Health (1K01HLL133416).
Disclosures
Dr Pencina reports funding from Regeneron/Sanofi to Duke and fees from Merck and Boehringer Ingelheim. Dr Navar reports research funding (to her institution) from Regeneron, Sanofi, Amarin, Janssen, and Amgen, and consulting fees from Amarin, Sanofi, and NovoNordisk. Dr Sanchez reports stockholding with Regeneron. Dr Khan reports stockholding with Sanofi. Dr Elassal reports stockholding with Regeneron. Dr Peterson reports grant support from the American College of Cardiology, American Heart Association, and Janssen, and consulting fees from Bayer, Boehringer Ingelheim, Merck, Valeant, Sanofi, Astra Zeneca, Janssen, Regeneron, Genentech. The other authors report no conflicts of interest.
The 3 industry-affiliated authors (Drs Sanchez, Khan, and Elassal) contributed to the design of the study, data interpretation, and critical revisions, and satisfy criteria for authorship. However, the conception of the paper itself, design and execution of the analyses, final interpretation of results, and decision to submit the paper as well as any final decisions were made by the first 3 and last 3 academic authors. Furthermore, in accordance with the policies of the industry sponsors involved, these entities had no impact on this paper, beyond that of their 3 employees who acted on their own, and not their employer’s, behalf.
Supplementary Material
Footnotes
Sources of Funding, see page 1610
The online-only Data Supplement is available with this article at https://www.ahajournals.org/doi/suppl/10.1161/circulationaha.117.031855.
References
- 1.Cook NR. Assessing the incremental role of novel and emerging risk factors. Curr Cardiovasc Risk Rep. 2010;4:112–119. doi: 10.1007/s12170-010-0084-x. doi: 10.1007/s12170-010-0084-x. [DOI] [PMC free article] [PubMed] [Google Scholar]
- 2.Wang TJ, Gona P, Larson MG, Tofler GH, Levy D, Newton-Cheh C, Jacques PF, Rifai N, Selhub J, Robins SJ, Benjamin EJ, D’Agostino RB, Vasan RS. Multiple biomarkers for the prediction of first major cardiovascular events and death. N Engl J Med. 2006;355:2631–2639. doi: 10.1056/NEJMoa055373. doi: 10.1056/NEJMoa055373. [DOI] [PubMed] [Google Scholar]
- 3.Navar AM, Peterson ED, Wojdyla D, Sanchez RJ, Sniderman AD, D’Agostino RB, Sr, Pencina MJ. Temporal changes in the association between modifiable risk factors and coronary heart disease incidence. JAMA. 2016;316:2041–2043. doi: 10.1001/jama.2016.13614. doi: 10.1001/jama.2016.13614. [DOI] [PMC free article] [PubMed] [Google Scholar]
- 4.Laaksonen MA, Knekt P, Rissanen H, Härkänen T, Virtala E, Marniemi J, Aromaa A, Heliövaara M, Reunanen A. The relative importance of modifiable potential risk factors of type 2 diabetes: a meta-analysis of two cohorts. Eur J Epidemiol. 2010;25:115–124. doi: 10.1007/s10654-009-9405-0. doi: 10.1007/s10654-009-9405-0. [DOI] [PubMed] [Google Scholar]
- 5.Thanassoulis G, Williams K, Altobelli KK, Pencina MJ, Cannon CP, Sniderman AD. Individualized statin benefit for determining statin eligibility in the primary prevention of cardiovascular disease. Circulation. 2016;133:1574–1581. doi: 10.1161/CIRCULATIONAHA.115.018383. doi: 10.1161/CIRCULATIONAHA.115.018383. [DOI] [PubMed] [Google Scholar]
- 6.Robinson JG, Huijgen R, Ray K, Persons J, Kastelein JJ, Pencina MJ. Determining when to add nonstatin therapy: a quantitative approach. J Am Coll Cardiol. 2016;68:2412–2421. doi: 10.1016/j.jacc.2016.09.928. doi: 10.1016/j.jacc.2016.09.928. [DOI] [PubMed] [Google Scholar]
- 7.Giffen CA, Carroll LE, Adams JT, Brennan SP, Coady SA, Wagner EL. Providing contemporary access to historical biospecimen collections: development of the NHLBI Biologic Specimen and Data Repository Information Coordinating Center (BioLINCC). Biopreserv Biobank. 2015;13:271–279. doi: 10.1089/bio.2014.0050. doi: 10.1089/bio.2014.0050. [DOI] [PMC free article] [PubMed] [Google Scholar]
- 8.Levy D, DeStefano AL, Larson MG, O’Donnell CJ, Lifton RP, Gavras H, Cupples LA, Myers RH. Evidence for a gene influencing blood pressure on chromosome 17: genome scan linkage results for longitudinal blood pressure phenotypes in subjects from the Framingham Heart Study. Hypertension. 2000;36:477–483. doi: 10.1161/01.hyp.36.4.477. doi: 10.1161/01.HYP.36.4.477. [DOI] [PubMed] [Google Scholar]
- 9.Tobin MD, Sheehan NA, Scurrah KJ, Burton PR. Adjusting for treatment effects in studies of quantitative traits: antihypertensive therapy and systolic blood pressure. Stat Med. 2005;24:2911–2935. doi: 10.1002/sim.2165. doi: 10.1002/sim.2165. [DOI] [PubMed] [Google Scholar]
- 10.Goff DC, Jr, Lloyd-Jones DM, Bennett G, Coady S, D’Agostino RB, Gibbons R, Greenland P, Lackland DT, Levy D, O’Donnell CJ, Robinson JG, Schwartz JS, Shero ST, Smith SC, Jr, Sorlie P, Stone NJ, Wilson PW, Jordan HS, Nevo L, Wnek J, Anderson JL, Halperin JL, Albert NM, Bozkurt B, Brindis RG, Curtis LH, DeMets D, Hochman JS, Kovacs RJ, Ohman EM, Pressler SJ, Sellke FW, Shen WK, Smith SC, Jr, Tomaselli GF American College of Cardiology/American Heart Association Task Force on Practice Guidelines. 2013 ACC/AHA guideline on the assessment of cardiovascular risk: a report of the American College of Cardiology/American Heart Association Task Force on Practice Guidelines. Circulation. 2014;129(25 Suppl 2):S49–S73. doi: 10.1161/01.cir.0000437741.48606.98. doi: 10.1161/01.cir.0000437741.48606.98. [DOI] [PubMed] [Google Scholar]
- 11.Harrell FE., Jr . Regression modeling strategies. Springer; 2001. [Google Scholar]
- 12.Pencina MJ, D’Agostino RB. Overall C as a measure of discrimination in survival analysis: model specific population value and confidence interval estimation. Stat Med. 2004;23:2109–2123. doi: 10.1002/sim.1802. doi: 10.1002/sim.1802. [DOI] [PubMed] [Google Scholar]
- 13.Pencina MJ, Steyerberg EW, D’Agostino RB., Sr Net reclassification index at event rate: properties and relationships. Stat Med. 2017;36:4455–4467. doi: 10.1002/sim.7041. doi: 10.1002/sim.7041. [DOI] [PubMed] [Google Scholar]
- 14.Pencina MJ, D’Agostino RB, Sr, D’Agostino RB, Jr, Vasan RS. Evaluating the added predictive ability of a new marker: from area under the ROC curve to reclassification and beyond. Stat Med. 2008;27:157–72; discussion 207. doi: 10.1002/sim.2929. doi: 10.1002/sim.2929. [DOI] [PubMed] [Google Scholar]
- 15.Laaksonen MA, Knekt P, Härkänen T, Virtala E, Oja H. Estimation of the population attributable fraction for mortality in a cohort study using a piecewise constant hazards model. Am J Epidemiol. 2010;171:837–847. doi: 10.1093/aje/kwp457. doi: 10.1093/aje/kwp457. [DOI] [PubMed] [Google Scholar]
- 16.Karmali KN, Lloyd-Jones DM, Berendsen MA, Goff DC, Jr, Sanghavi DM, Brown NC, Korenovska L, Huffman MD. Drugs for primary prevention of atherosclerotic cardiovascular disease: an overview of systematic reviews. JAMA Cardiol. 2016;1:341–349. doi: 10.1001/jamacardio.2016.0218. doi: 10.1001/jamacardio.2016.0218. [DOI] [PMC free article] [PubMed] [Google Scholar]
- 17.Whelton PK, Carey RM, Aronow WS, Casey DE, Jr, Collins KJ, Dennison Himmelfarb C, DePalma SM, Gidding S, Jamerson KA, Jones DW, MacLaughlin EJ, Muntner P, Ovbiagele B, Smith SC, Jr, Spencer CC, Stafford RS, Taler SJ, Thomas RJ, Williams KA, Sr, Williamson JD, Wright JT., Jr 2017 ACC/AHA/AAPA/ABC/ACPM/AGS/APhA/ASH/ASPC/NMA/PCNA guideline for the prevention, detection, evaluation, and management of high blood pressure in adults: a report of the American College of Cardiology/American Heart Association Task Force on Clinical Practice Guidelines. Circulation. 2018;138:e484–e594. doi: 10.1161/CIR.0000000000000596. doi: 10.1161/CIR.0000000000000596. [DOI] [PubMed] [Google Scholar]
- 18.Navar-Boggan AM, Peterson ED, D’Agostino RB, Sr, Neely B, Sniderman AD, Pencina MJ. Hyperlipidemia in early adulthood increases long-term risk of coronary heart disease. Circulation. 2015;131:451–458. doi: 10.1161/CIRCULATIONAHA.114.012477. doi: 10.1161/CIRCULATIONAHA.114.012477. [DOI] [PMC free article] [PubMed] [Google Scholar]
- 19.Stone NJ, Robinson JG, Lichtenstein AH, Bairey Merz CN, Blum CB, Eckel RH, Goldberg AC, Gordon D, Levy D, Lloyd-Jones DM, McBride P, Schwartz JS, Shero ST, Smith SC, Jr, Watson K, Wilson PW, Eddleman KM, Jarrett NM, LaBresh K, Nevo L, Wnek J, Anderson JL, Halperin JL, Albert NM, Bozkurt B, Brindis RG, Curtis LH, DeMets D, Hochman JS, Kovacs RJ, Ohman EM, Pressler SJ, Sellke FW, Shen WK, Smith SC, Jr, Tomaselli GF American College of Cardiology/American Heart Association Task Force on Practice Guidelines. 2013 ACC/AHA guideline on the treatment of blood cholesterol to reduce atherosclerotic cardiovascular risk in adults: a report of the American College of Cardiology/American Heart Association Task Force on Practice Guidelines. Circulation. 2014;129(25 Suppl 2):S1–45. doi: 10.1161/01.cir.0000437738.63853.7a. doi: 10.1161/01.cir.0000437738.63853.7a. [DOI] [PubMed] [Google Scholar]
- 20.Navar AM, Pencina MJ, Peterson ED. Assessing cardiovascular risk to guide hypertension diagnosis and treatment. JAMA Cardiol. 2016;1:864–871. doi: 10.1001/jamacardio.2016.2861. doi: 10.1001/jamacardio.2016.2861. [DOI] [PMC free article] [PubMed] [Google Scholar]
- 21.Allen NB, Zhao L, Liu L, Daviglus M, Liu K, Fries J, Shih YT, Garside D, Vu TH, Stamler J, Lloyd-Jones DM. Favorable cardiovascular health, compression of morbidity, and healthcare costs: forty-year follow-up of the CHA Study (Chicago Heart Association Detection Project in Industry). Circulation. 2017;135:1693–1701. doi: 10.1161/CIRCULATIONAHA.116.026252. doi: 10.1161/CIRCULATIONAHA.116.026252. [DOI] [PMC free article] [PubMed] [Google Scholar]