

Abstract
Deceased donor kidney transplantation (DDKT) rates for highly sensitized (HS) candidates increased early after implementation of the Kidney Allocation System (KAS) in 2014. However, this may represent a bolus effect, and a granular investigation of the current state of DDKT for HS candidates remains lacking. We studied 270,722 DDKT candidates from the SRTR from 12/4/2011-12/3/2014 (‘pre-KAS’) and 12/4/2014-12/3/2017 (‘post-KAS’), analyzing DDKT rates for HS candidates using adjusted negative binomial regression. Post-KAS, candidates with the highest levels of sensitization had an increased DDKT rate compared to pre-KAS (cPRA 98% adjusted incidence rate ratio [aIRR]:1.271.772.46 p=0.001, cPRA 99% aIRR:3.184.365.98 p<0.001, cPRA 99.5-99.9% aIRR:16.9124.2934.89 p<0.001, and cPRA 99.9%+ aIRR:8.7911.5815.26 p<0.001). To determine whether these changes produced more equitable access to DDKT, we compared DDKT rates of HS to non-HS candidates (cPRA 0-79%). Post-KAS, cPRA 98% candidates had an equivalent DDKT rate (aIRR:0.650.941.36, p=0.8) to non-HS candidates, whereas 99% candidates had a higher DDKT rate (aIRR:1.191.682.38, p=0.02). Although cPRA 99.5-99.9% candidates had an increased DDKT rate (aIRR:2.463.504.98, p<0.001) compared to non-HS candidates, cPRA 99.9%+ candidates had a significantly lower DDKT rate (aIRR:0.290.400.56, p<0.001). KAS has improved access to DDKT for HS candidates, although substantial imbalance exists between cPRA 99.5-99.9% and 99.9%+ candidates.
INTRODUCTION
The deceased donor kidney allocation algorithm underwent a major revision in December 2014 with the implementation of the new Kidney Allocation System (KAS). One of the goals of KAS was to improve access to deceased donor kidney transplantation (DDKT) for highly sensitized (HS) candidates (1). Compared to non-HS candidates, HS candidates had as much as a five-fold lower rate of DDKT and 21% higher waitlist mortality prior to KAS (2–4). KAS was designed to ameliorate these differences by awarding extra allocation points based on calculated panel-reactive antibody (cPRA) and by implementing local, regional, and national sharing for those with a cPRA ≥ 98% (1). Simulations prior to KAS implementation suggested that these measures would increase DDKT rates for HS candidates by varying amounts based on cPRA, such that DDKT recipients with a cPRA 100% would increase by as much as three-fold (5).
Since the implementation of KAS, several studies have shown an early increase in DDKT rates for HS candidates (6–10). In one study, the percentage of DDKT recipients with a cPRA ≥ 99% increased 5.4-fold in the first year of KAS (8). However, none of these studies examined changes in DDKT rates beyond one year after KAS implementation. Our group has shown that this early increase in DDKT rates for patients with cPRA 100% may represent a “bolus effect”, such that 12% of DDKT recipients had a cPRA 100% in the first month of KAS, but this had decreased to 7% by the ninth month after KAS (10). Moreover, prior studies have generally focused on patients with a cPRA ≥ 98%, even though KAS directly modified the allocation points received by other HS kidney transplant candidates as well (1). Since the relative benefit of DDKT compared to other potentially available transplant options for HS candidates, such as kidney-paired donation or incompatible living donor kidney transplantation, depends highly on the likelihood of DDKT, an understanding of current DDKT rates under KAS is critical to determining the optimal transplant approach for a given patient (11, 12).
To understand the current state of DDKT for HS candidates, we analyzed national waitlist data. The goals of our study were to: (i) to compare long-term DDKT rates for HS candidates before and after KAS, (ii) to compare DDKT rates of HS candidates to non-HS candidates after KAS, (iii) to determine the cumulative incidence of DDKT and waitlist mortality for HS candidates beyond the first year after KAS implementation, and (iv) to determine whether post-transplant outcomes for HS recipients have changed after KAS.
METHODS
Data Source
This study used data from the Scientific Registry of Transplant Recipients (SRTR). The SRTR data system includes data on all donor, wait-listed candidates, and transplant recipients in the United States, submitted by the members of the Organ Procurement and Transplantation Network (OPTN), and has been described elsewhere (13). The Health Resources and Services Administration (HRSA), U.S. Department of Health and Human Services provides oversight to the activities of the OPTN and SRTR contractors.
Study Population
We studied all prevalent adult (age ≥ 18 years) kidney-only waitlist candidates and DDKT recipients from December 4, 2011 to December 3, 2017. For waitlisted candidates, only active patient time was included for analysis. This study was approved by the Johns Hopkins Medicine Institutions Institutional Review Board.
Time Periods for Analysis
Our study period was divided into two major time periods : pre-KAS (12/4/2011 to 12/3/2014) and post-KAS (12/4/2014 to 12/3/2017). To isolate a possible bolus effect, we further divided the post-KAS time period into successive six-month intervals.
cPRA Categories for Analysis
A candidate’s cPRA was obtained from SRTR’s cPRA history dataset, which has every cPRA value reported. As such, for patients whose cPRA changed while on the waitlist, the time they spent at each cPRA contributed patient-time to that cPRA category when calculating DDKT rates.
We divided HS waitlist candidates into the following cPRA categories: 80-89%, 90-97%, 98%, 99%, 99.5-99.9%, and 99.9%+. These categories were chosen to allow for similar allocation priority between candidates within a cPRA group while also including enough candidates in each group to allow for well-powered comparisons. For example, cPRA 80% candidates receive 2.46 points under KAS, and cPRA 89% candidates receive 4.05 points. This range of allocation points is small enough such that differences in allocation priority should be minimal. Conversely, a much larger range in allocation points is provided to cPRA 98% (24.4 points), 99% (50.1 points), and 100% (202.1 points), and these candidates receive different organ sharing priority (local sharing for cPRA 98%, regional sharing for cPRA 99%, and national sharing for cPRA 100%), so we chose to analyze them separately. Since cPRA 100% candidates may have different DDKT rates depending on their unrounded cPRA, we further divided these candidates into 99.5-99.9% and 99.9%+ categories.
DDKT Rates for HS Candidates After KAS Compared to Before KAS
We used an adjusted negative binomial regression model to estimate the relative DDKT rate within each cPRA category for each of the post-KAS time periods relative to pre-KAS. We used a sandwich estimator to account for within-organ procurement organization (OPO) clustering of DDKT rates (14). We adjusted this model for covariates also known to affect DDKT rate (e.g. candidate age, ABO blood type, race, gender, and time on dialysis). We included an interaction term between KAS and cPRA group to allow the effect of KAS to vary across different cPRA groups. To study a potential bolus effect, we then tested for overall trends in DDKT rates post-KAS for each cPRA category.
DDKT rates for HS candidates compared to non-HS candidates
In order to determine whether DDKT rates for HS candidates had become more equitable compared to non-HS candidates following KAS, we used the adjusted negative binomial regression model to compare DDKT rates between each HS candidate group and the non-HS group (cPRA 0-79%). In doing so, we were able to determine whether the post-KAS changes to DDKT rates within a given cPRA group led to overall more balanced DDKT rates between all cPRA groups.
Cumulative incidence of DDKT and waitlist mortality after KAS for specifc cPRA groups
To estimate time to DDKT post-KAS, we modeled the cumulative incidence of DDKT for each cPRA group. To do this, we constructed a proportional hazards model under a competing risk framework using the Fine and Gray method (15). Receipt of DDKT was the outcome of interest, with a competing risk of death or removal from the waiting list due to deteriorating clinical status. Patients who were removed from the waiting list for any other reason (such as receipt of a living donor transplant) were censored. We modeled the cumulative incidence of waitlist mortality similarly, where death while on the waitlist was the outcome of interest, with a competing risk of DDKT. As the goal of this analysis was to determine intention-to-treat time to DDKT (or waitlist mortality) based on cPRA, accounting for competing risks, we included both active and inactive waitlist time in these models. Under the competing risks framework, we were also able to model adjusted subhazard ratios within the subdistribution of the outcome of interest (either DDKT or waitlist mortality), with the other outcome as a competing event.
Post-transplant patient and graft survival after KAS
Post-transplant patient survival and death-censored graft survival (DCGF) for DDKT recipients pre-KAS and post-KAS were compared using Kaplan-Meier methodology and Cox proportional hazards regression, adjusting for candidate age, ABO blood type, race, gender, and time on dialysis. We included an interaction term between KAS and cPRA group to allow the effect of KAS to vary across different cPRA groups.
Statistical analysis
To compare baseline characteristics between DDKT recipients before and after KAS, we used the chi-squared test for categorical variables, student’s t-test for normally-distributed continuous variables, and the Kruskal-Wallis test for non-normally distributed continuous variables. A two-tailed p-value of <0.05 was considered statistically significant. Confidence intervals are reported as per the method of Louis and Zeger (16). Statistical analysis was performed using Stata 15.0 (StataCorp, College Station, TX).
RESULTS
Study Population
We identified 270,722 waitlisted candidates from December 4, 2011 to December 3, 2017. Of these, 30,031 were transplanted pre-KAS and 35,172 were transplanted post-KAS. Compared to pre-KAS recipients, post-KAS recipients were younger (52.4 years vs. 53.9, p<0.001), more likely to be female (39.3% vs. 40.4%, p=0.003), and more likely to be black (35.5% vs. 32.2%, p<0.001) (Table 1). ABO blood type was not significantly different between post-KAS and pre-KAS recipients. Post-KAS recipients were significantly more likely to have a cPRA of 100% compared to pre-KAS recipients (8.1% vs. 1.1%, p<0.001), more likely to have had a prior kidney transplant (14.7% vs. 13.0%, p<0.001), have spent more time on dialysis prior to DDKT (4.6 years vs. 2.3, p<0.001), have a slightly lower estimated post-transplant survival score (45.8 vs. 46.4, p=0.002), and have received a donor kidney that had been shared nationally (17.9% vs. 13.4%, p<0.001). Post-KAS, cPRA 99.9%+ candidates were the most common group of HS candidates on the waitlist (Figure 1). No group of HS candidates represented more than 5% of candidates on the waitlist.
Table 1.
Baseline Characteristics of Deceased Donor Kidney Transplant Recipients Pre-KAS† and Post-KAS
| Characteristics | Pre-KAS (N = 30,031) | Post-KAS (N = 35,172) | P |
|---|---|---|---|
| Age in years, mean (SD^) | 53.9 (12.8) | 52.4 (13.1) | < 0.001 |
| Female, N (%) | 11,793 (39.3) | 14,212 (40.4) | 0.003 |
| Race, N (%) | < 0.001 | ||
| White | 12,801 (42.6) | 12,740 (36.2) | |
| Black | 9,672 (32.2) | 12,503 (35.5) | |
| Hispanic | 4,853 (16.2) | 6,580 (18.7) | |
| Other | 2,705 (9.0) | 3,349 (9.5) | |
| ABO Blood Type, N (%) | 0.07 | ||
| O | 13,581 (45.2) | 16,082 (45.7) | |
| A | 7,177 (36.6) | 11,316 (35.5) | |
| B | 2,512 (12.8) | 4,284 (13.4) | |
| AB | 994 (5.1) | 1,733 (5.4) | |
| Calculated panel-reactive antibody, N (%) | < 0.001 | ||
| 0-79% | 25,161 (83.8) | 27,824 (79.1) | |
| 80-89% | 2,041 (6.8) | 1,162 (3.3) | |
| 90-97% | 1,837 (6.1) | 1,805 (5.1) | |
| 98% | 291 (1.0) | 420 (1.2) | |
| 99% | 405 (1.4) | 1,054 (3.0) | |
| 100% | 296 (1.0) | 2,907 (8.3) | |
| Sharing of donor organ, N (%) | < 0.001 | ||
| Local | 23,310 (77.6) | 24,205 (68.8) | |
| Regional | 2,711 (9.0) | 4,679 (13.3) | |
| National | 4,010 (13.4) | 6,288 (17.9) | |
| Time spent on dialysis in years, median (IQR#) | 2.3 (0.8-4.0) | 4.6 (2.7-6.9) | < 0.001 |
| History of prior kidney transplant, N (%) | 3,893 (13.0) | 5,184 (14.7) | <0.001 |
| Estimated Post-Transplant Survival score, mean (SD^) | 46.4 (28.5) | 45.8 (29.6) | 0.002 |
kidney allocation system
standard deviation
interquartile range
Figure 1.
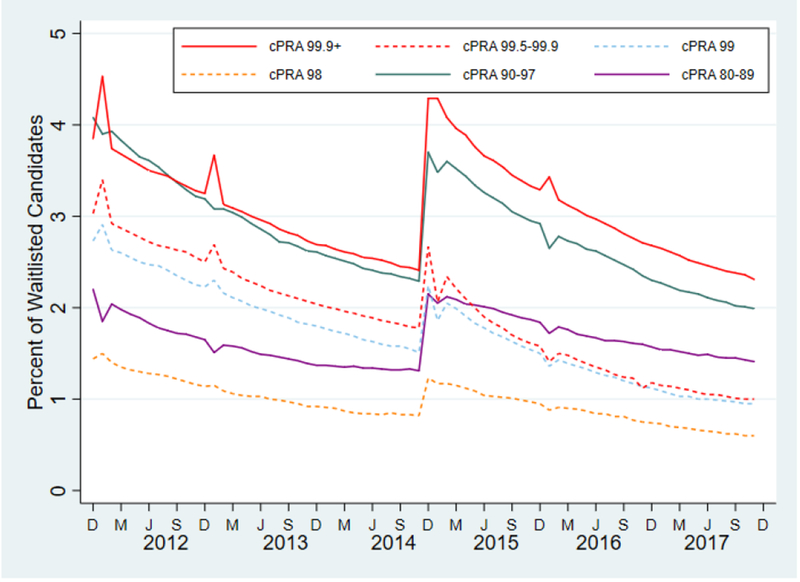
Monthly prevalence of highly sensitized candidates on the waitlist during the study period.
Post-KAS, cPRA 99.9%+ candidates represent the most common group of highly sensitized candidates on the waitlist. After an initial increase in the prevalence of highly sensitized candidates immediately after KAS, these candidates now represent a smaller proportion of the waitlist.
cPRA, calculated panel reactive antibody; D, December; M, March; J, June; S, September
DDKT Rates for HS Candidates Before and After KAS
DDKT rates were dramatically increased post-KAS compared to pre-KAS for both cPRA 99.5-99.9% candidates (adjusted incidence rate ratio [aIRR] of DDKT at 3 years post-KAS: 16.9124.2934.89, p < 0.001) and cPRA 99.9%+ candidates (aIRR: 8.7911.5815.26 , p<0.001) (Table 2, Figure 2). There was no evidence of a bolus effect for either group (p=0.4, p=0.1, respectively). Similar, albeit lower, increases were seen for patients with a cPRA of 99% (aIRR: 3.184.365.98, p<0.001) and a cPRA of 98% (aIRR: 1.271.772.46, p=0.001), also with no evidence of a bolus effect.
Table 2.
Relative Rates of Deceased Donor Kidney Transplantation For Various cPRA* Categories by Months Post-KAS†
| cPRA | 0-6 mos | 6-12 mos | 12-18 mos | 18-24 mos | 24-30 mos | 30-36 mos | P |
|---|---|---|---|---|---|---|---|
| 80-89% | 0.190.240.30 | 0.210.270.35 | 0.230.310.41 | 0.300.390.49 | 0.300.400.53 | 0.350.450.58 | <0.001 |
| 90-97% | 0.530.650.81 | 0.650.780.93 | 0.750.911.10 | 0.891.091.35 | 0.911.161.49 | 0.971.261.64 | <0.001 |
| 98% | 1.091.401.81 | 0.861.322.01 | 1.411.942.67 | 1.372.002.92 | 1.422.022.86 | 1.271.772.46 | 0.2 |
| 99% | 2.683.424.37 | 2.913.664.59 | 2.603.705.26 | 2.984.286.14 | 3.334.526.14 | 3.184.365.98 | 0.6 |
| 99.5-99.9% | 15.0619.5825.47 | 16.4021.0927.13 | 14.0219.4927.09 | 17.6323.3730.99 | 17.9324.1532.53 | 16.9124.2934.89 | 0.4 |
| 99.9%+ | 6.718.3910.48 | 7.9410.3513.49 | 6.878.6010.77 | 8.1510.4013.28 | 6.458.7111.75 | 8.7911.5815.26 | 0.1 |
Relative rates are presented as the relative rate of transplantation for a given cPRA category in the months following implementation of KAS compared to the pre-KAS era. P-values are testing for trends within each cPRA category; significant values suggest transplant rates are changing over time. Bolded values represent relative DDKT rates in that time period that are significantly different than 1.0 (p<0.05)
calculated panel reactive antibody
kidney allocation system
Figure 2.
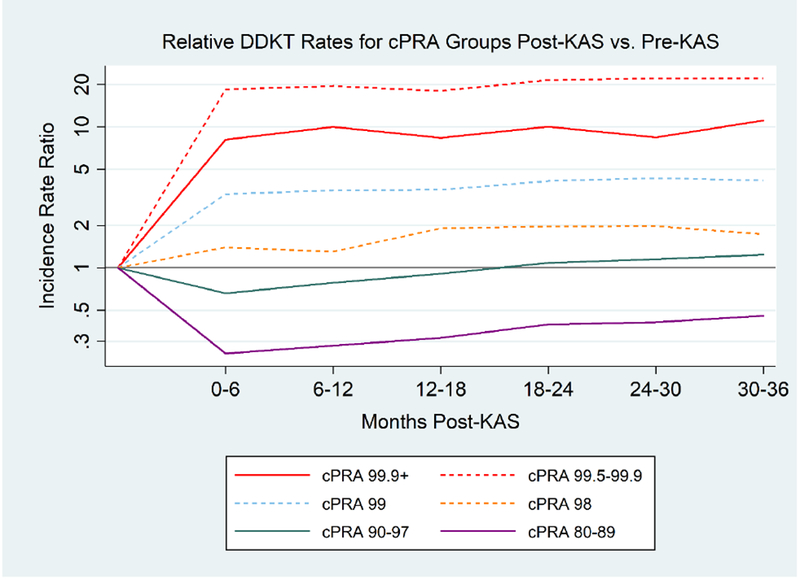
Relative DDKT# Rates for Different cPRA* Groups Post-KAS Compared to Pre-KAS
KAS has produced sustained changes to DDKT rates for most cPRA categories. Three years post-KAS, cPRA 99.9%+, 99.5-99.9%, 99%, and 98% candidates have increased DDKT rates compared to pre-KAS. Conversely, cPRA 80-89% candidates have lower DDKT rates post-KAS compared to pre-KAS.
#DDKT, deceased donor kidney transplantation; *cPRA, calculated panel reactive antibody
Grey horizontal line represents an incidence rate ratio of 1, which would represent equivalent DDKT rates post-KAS compared to pre-KAS
However, not all groups of HS candidates benefited from KAS. Notably, cPRA 80-89% candidates experienced a significant decline in DDKT rates in the first 6 months following KAS (aIRR: 0.190.240.30, p<0.001). While this decrease in DDKT rates improved over time (p<0.001), DDKT rates at three years post-KAS remained significantly lower compared to pre-KAS (aIRR: 0.350.450.58, p<0.001). Similarly, cPRA 90-97% candidates experienced a significant decline in DDKT rates in the first 6 months post-KAS (aIRR: 0.530.650.81, p<0.001), but by three years post-KAS their DDKT rate was again equivalent to their pre-KAS rate (aIRR: 0.971.261.64, p=0.1).
DDKT Rates for HS Candidates Compared to non-HS Candidates
For most cPRA ranges, the wide differences in DDKT rates between cPRA categories pre-KAS became less pronounced post-KAS (Table 3, Figure 3). However, there was significant heterogeneity in DDKT rates for cPRA 100% candidates. For example, cPRA 99.9%+ candidates were transplanted at a 97% lower rate than non-HS candidates pre-KAS (aIRR: 0.020.030.04, p<0.001), but continued to be transplanted at a lower, albeit improved, rate at three years post-KAS (aIRR: 0.290.400.56, p<0.001). Conversely, cPRA 99.5-99.9% candidates were transplanted at a 88% lower rate than non-HS candidates pre-KAS (aIRR: 0.100.120.15, p<0.001 ), but were transplanted at a substantially higher rate three years post-KAS (aIRR: 2.463.504.98, p<0.001)
Table 3.
Rates of Deceased Donor Kidney Transplantation For Various cPRA* Categories Comparing HS+ Candidates to non-HS+ Candidates
| Pre-KAS | Months Post-KAS | |||||||
|---|---|---|---|---|---|---|---|---|
| cPRA | 0-6 mos | 6-12 mos | 12-18 mos | 18-24 mos | 24-30 mos | 30-36 mos | P | |
| 80-89% | 2.693.273.97 | 0.971.261.64 | 1.031.261.55 | 1.111.381.71 | 1.321.642.04 | 1.351.662.04 | 1.501.792.14 | <0.001 |
| 90-97% | 1.011.191.40 | 0.911.261.75 | 1.041.331.70 | 1.111.481.96 | 1.241.682.29 | 1.271.752.29 | 1.431.822.32 | 0.006 |
| 98% | 0.350.440.55 | 0.671.001.45 | 0.520.831.31 | 0.761.161.77 | 0.731.141.76 | 0.751.121.68 | 0.650.941.36 | 0.33 |
| 99% | 0.240.290.35 | 1.161.622.27 | 1.121.532.10 | 0.981.482.23 | 1.191.782.65 | 1.281.782.48 | 1.191.682.38 | 0.97 |
| 99.5-99.9% | 0.100.120.15 | 2.753.795.22 | 2.673.604.87 | 2.193.184.61 | 2.543.615.12 | 2.573.645.15 | 2.463.504.98 | 0.85 |
| 99.9%+ | 0.020.030.04 | 0.290.390.53 | 0.320.430.57 | 0.270.340.43 | 0.290.390.53 | 0.220.320.46 | 0.290.400.56 | 0.15 |
Relative rates are presented as the relative rate of transplantation for a given cPRA category compared to cPRA 0-79%. P-values are testing for trends post-KAS within each cPRA category; significant values suggest transplant rates after KAS are changing over time. Bolded values represent a relative DDKT rate within that time period that is significantly different than 1 (p<0.05)
calculated panel reactive antibody
kidney allocation system
highly sensitized
Figure 3.
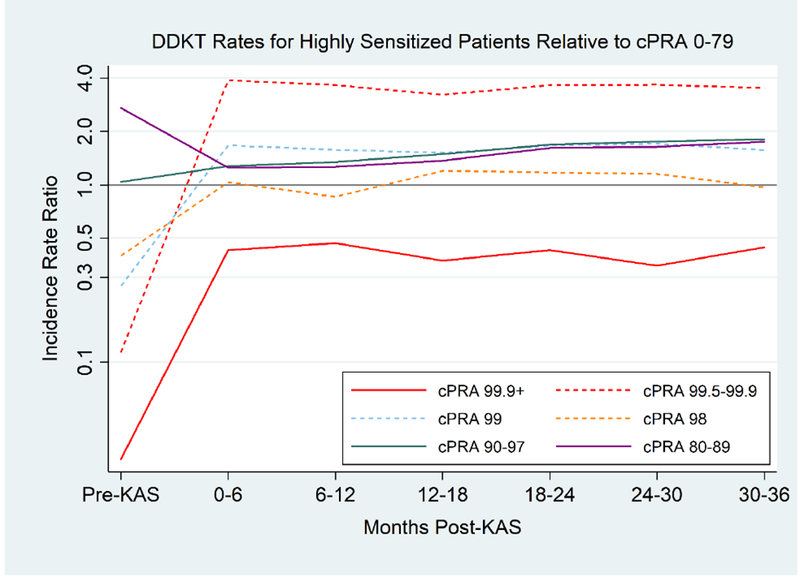
Relative DDKT# Rates for Different cPRA* Groups Compared to cPRA 0-79
DDKT rates become more balanced across cPRA groups post-KAS. However, cPRA 99.5-99.9% are transplanted at a substantially higher rate than 0-79% candidates post-KAS, whereas cPRA 99.9%+ candidates are transplanted at a lower rate.
#DDKT, deceased donor kidney transplantation; *cPRA, calculated panel reactive antibody
Grey horizontal line represents an incidence rate ratio of 1, which would represent equivalent DDKT rates between a given cPRA category and cPRA 0-79%.
cPRA 99% candidates had a notably lower DDKT rate than non-HS candidates pre-KAS (aIRR 0.240.290.35, p<0.001), but were transplanted at a higher rate three years post-KAS (aIRR: 1.191.682.38, p=0.02). cPRA 98% candidates were transplanted at a 56% lower rate than non-HS candidates pre-KAS (aIRR: 0.350.440.55, p<0.001), but improved to equivalent DDKT rates three years post-KAS (aIRR: 0.650.941.36, p=0.8). Although cPRA 80-89% patients experienced a significant decrease in DDKT rates post-KAS compared to pre-KAS, these patients continued to have a higher DDKT rate than non-HS candidates both pre-KAS (aIRR 2.693.273.97, p<0.001) and post-KAS (aIRR: 1.501.792.14, p<0.001). Thus, their decline in DDKT rates post-KAS does not appear to have disadvantaged them compared to other transplant candidates.
Cumulative incidence of DDKT based on cPRA
The range of likelihood of DDKT at 1-year for a given cPRA category was smaller post-KAS (range 9.4-32.9%) then pre-KAS (range 1.4 – 28.1%) (Figure 4). For example, a cPRA 99.5-99.9% candidate had a 1-year cumulative incidence of DDKT of 3.9% pre-KAS, but post-KAS this improved to 32.9%. In comparison, a cPRA 99.9%+ candidate had a 1-year cumulative incidence of DDKT of 1.4% pre-KAS, but post-KAS this improved to 9.4%. Notably, the highest and lowest cumulative incidence of DDKT post-KAS were in cPRA 99.5-99.9% (32.9%) and cPRA 99.9%+ candidates (9.4%), respectively. The 1-year cumulative incidence of DDKT post-KAS for cPRA 99% (26.2%), 98% (19.4%), 90-97% (21.7%), 80-89% (19.3%), and 0-79% (14.0%) candidates were broadly similar (Table 4). Similar patterns extended to three years post-KAS, where the highest and lowest cumulative incidence of DDKT post-KAS were in cPRA 99.5-99.9% (48.4%) and cPRA 99.9%+ candidates (20.2%), respectively. The range of the cumulative incidence of DDKT continued to be smaller three years post-KAS (20.2 – 48.4%) compared to pre-KAS (4.2 – 44.4%). No group of candidates had a median time to DDKT of less than 3 years.
Figure 4.
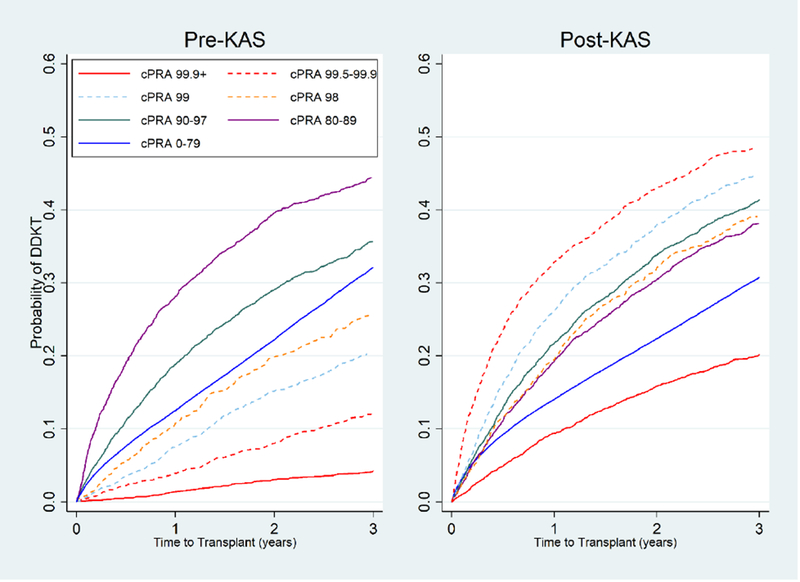
Cumulative incidence of DDKT# for different cPRA* groups pre-KAS and post-KAS.
The cumulative incidence of DDKT becomes more similar between cPRA groups following KAS compared to before KAS. Pre-KAS and Post-KAS, cPRA 99.9%+ candidates have the lowest cumulative incidence of DDKT.
#DDKT, deceased donor kidney transplantation; *cPRA, calculated panel reactive antibody
Cumulative incidence of DDKT estimated under a competing risks framework, accounting for a candidate’s competing risk of death or removal from the waitlist due to deteriorating medical condition
Table 4.
| Pre-KAS† (%) | Post-KAS† (%) | |||||
|---|---|---|---|---|---|---|
| cPRA* | 1-year | 2-year | 3-year | 1-year | 2-year | 3-year |
| 0-79% | 12.312.512.7 | 22.022.222.5 | 31.832.132.5 | 13.814.014.2 | 22.122.322.6 | 30.430.731.1 |
| 80-89% | 26.328.130.0 | 37.439.641.7 | 42.144.446.7 | 17.719.320.9 | 28.530.432.4 | 35.938.140.4 |
| 90-97% | 17.618.820.1 | 27.529.030.6 | 33.935.737.4 | 20.421.723.0 | 32.233.835.4 | 39.641.443.2 |
| 98% | 9.110.812.7 | 17.519.922.4 | 22.925.728.6 | 17.219.421.8 | 29.432.235.0 | 36.039.142.2 |
| 99% | 6.47.58.7 | 13.615.216.9 | 18.420.322.3 | 24.326.228.1 | 35.838.040.2 | 42.444.847.2 |
| 99.5-99.9% | 3.23.94.8 | 6.98.09.2 | 10.612.113.6 | 31.032.934.8 | 40.943.045.1 | 46.248.450.5 |
| 99.9%+ | 1.01.41.9 | 2.43.03.8 | 3.54.25.1 | 8.59.410.4 | 14.615.917.1 | 18.720.221.6 |
Cumulative incidence and 95% confidence interval of DDKT calculated using a competing risk framework, accounting for waitlist mortality or removal from waitlist due to deteriorating medical status.
calculated panel reactive antibody
kidney allocation system
Post-KAS, most HS candidates had an increased likelihood of DDKT relative to non-HS candidates, after accounting for the competing risk of waitlist mortality or removal from waitlist due to deteriorating medical condidtion (Table 6). cPRA 80-89% (adjusted subhazard ratio [aSHR]: 1.191.341.51, p<0.001), 90-97% (aSHR: 1.241.481.77, p<0.001), 98% (aSHR: 1.141.371.64, p=0.001), 99% (aSHR: 1.421.732.10, p<0.001), and 99.5-99.9% (aSHR: 1.742.082.47, p<0.001) candidates were all more likely to undergo DDKT than non-HS candidates. Conversely, cPRA 99.9%+ candidates were less likely to undergo DDKT than non-HS candidates (aSHR: 0.490.600.75, p<0.001)
Table 6.
Relative Likelihood of Deceased Donor Kidney Transplantation and Waitlist Mortality for Highly Sensitized Candidates Compared to Non-Highly Sensitized Candidates post-KAS.
| aSHR | ||
|---|---|---|
| cPRA* | DDKT# | Waitlist Mortality |
| 0-79% | Ref | Ref |
| 80-89% | 1.191.341.51 | 0.861.021.22 |
| 90-97% | 1.241.481.77 | 0.971.141.35 |
| 98% | 1.141.371.64 | 1.161.441.80 |
| 99% | 1.421.732.10 | 1.061.271.52 |
| 99.5-99.9% | 1.742.082.47 | 1.191.441.74 |
| 99.9%+ | 0.490.600.75 | 1.591.892.25 |
Adjusted subhazard ratios (aSHR) represent the relative likelihood for a given cPRA category to experience the outcome of interest compared to cPRA 0-79% candidates, accounting for competing risks. For example cPRA 99.9%+ candidates are 60% as likely as otherwise similar cPRA 0-79% candidates to undergo DDKT post-KAS, account for their competing risk of waitlist mortality. Bolded values represent a ratio that significantly different than 1.0 (p<0.05).
Deceased donor kidney transplantation
calculated panel reactive antibody
Cumulative incidence of waitlist mortality based on cPRA
The range of likelihood of waitlist mortality at-year for a given cPRA category was similar post-KAS (range 4.7-7.4%) and pre-KAS (3.7-6.1%) (Figure 5). The 1-year cumulative incidence of waitlist mortality post-KAS for cPRA 99.9%+ (7.4%), 99.5-99.9% (6.1%), 99% (5.8%), 98% (6.0%), 90-97% (5.0%), 80-89% (4.7%), and 0-79% (5.0%) candidates were broadly similar. (Table 5). Similar patterns extended to three years post-KAS, where the range of three year cumulative incidence of waitlist mortality was similar post-KAS (15.9-21.8%) and pre-KAS (12.8-21.3%).
Figure 5.
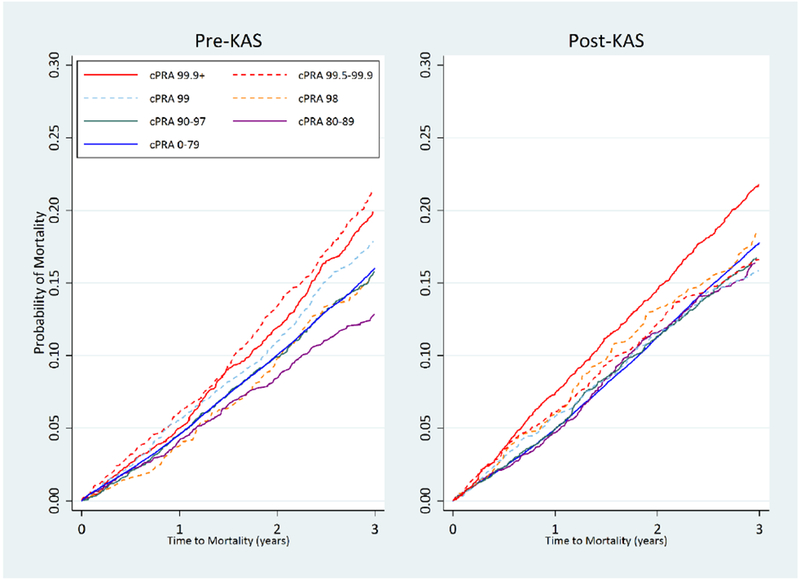
Cumulative incidence of waitlist mortality for different cPRA* groups pre-KAS and post-KAS.
The cumulative incidence of waitlist remains similar between cPRA groups post-KAS and pre-KAS.
*cPRA, calculated panel reactive antibody
Cumulative incidence of waitlist mortality estimated under a competing risks framework, accounting for a candidate’s competing risk of deceased donor kidney transplantation
Table 5.
| Pre-KAS† (%) | Post-KAS† (%) | |||||
|---|---|---|---|---|---|---|
| cPRA* | 1-year | 2-year | 3-year | 1-year | 2-year | 3-year |
| 0-79% | 4.44.64.7 | 9.810.010.2 | 15.716.016.3 | 4.85.05.1 | 11.111.311.5 | 17.517.818.0 |
| 80-89% | 3.44.25.0 | 7.38.59.8 | 11.312.814.5 | 3.94.75.6 | 10.211.613.0 | 14.716.418.2 |
| 90-97% | 3.94.65.3 | 8.99.911.0 | 14.415.817.2 | 4.35.05.7 | 10.311.312.5 | 15.416.718.2 |
| 98% | 2.73.75.0 | 8.19.811.8 | 12.915.217.7 | 4.86.07.5 | 11.313.215.4 | 16.018.521.1 |
| 99% | 4.75.66.6 | 9.611.012.5 | 16.017.919.8 | 4.95.86.9 | 10.111.613.1 | 14.115.917.7 |
| 99.5-99.9% | 5.26.17.2 | 12.013.415.0 | 19.421.323.2 | 5.26.17.2 | 10.812.213.6 | 15.016.618.4 |
| 99.9%+ | 4.25.05.9 | 10.711.913.2 | 18.319.921.6 | 6.67.48.3 | 13.314.515.8 | 20.221.823.3 |
Cumulative incidence and 95% confidence interval of waitlist mortality calculated using a competing risk framework, accounting for deceased donor kidney transplantation.
calculated panel reactive antibody
kidney allocation system
After adjusting for candidate characteristics, many HS candidates continued to have a slightly higher likelihood of waitlist mortality relative to non-HS candidates post-KAS, accounting for their competing risk of DDKT (Table 6). cPRA 98% (aSHR: 1.161.441.80, p=0.001), 99% (aSHR: 1.061.271.52, p=0.01), 99.5-99.9% (aSHR: 1.191.441.74, p<0.001), and 99.9%+ candidates (aSHR: 1.591.892.25, p<0.001) all had a higher likelihood of waitlist mortality relative to non-HS candidates.
Post-transplant patient and death-censored graft survival based on cPRA
One-year post-transplant patient survival was similar for HS candidates post-KAS and pre-KAS (96.6% and 97.2% for cPRA 80-89% candidates, 96.6% and 97.3% for cPRA 90-97% candidates, 97.6% and 97.2% for cPRA 98% candidates, 96.4% and 96.9% for cPRA 99% candidates, 96.9% and 97.0% for cPRA 99.5-99.9% candidates, and 96.0% and 97.0% for cPRA 99.9%+ candidates, respectively). After adjusting for recipient characteristics, there were no differences in one-year post-transplant mortality for HS candidates post-KAS comared to pre-KAS (Table 7).
Table 7.
One Year Post-Transplant Mortality and Death-Censored Graft Failure for Highly Sensitized Candidates Post-KAS Compared to Pre-KAS.
| aHR | ||
|---|---|---|
| cPRA* | Mortality | Graft Failure |
| 80-89% | 0.480.771.25 | 0.380.641.06 |
| 90-97% | 0.540.791.13 | 0.290.430.62 |
| 98% | 0.431.132.95 | 0.110.260.63 |
| 99% | 0.470.871.64 | 0.170.360.77 |
| 99.5-99.9% | 0.471.002.10 | 0.330.721.60 |
| 99.9%+ | 0.290.721.76 | 0.310.661.43 |
Adjusted hazard ratios (aHR) represent the relative risk of 1-year post-transplant mortality or death-censored graft failure for HS candidates post-KAS. For example cPRA 99.9%+ candidates are at a similar risk of 1-year post-transplant mortality post-KAS compared to pre-KAS. Bolded values represent a ratio that significantly different than 1.0 (p<0.05).
Deceased donor kidney transplantation
calculated panel reactive antibody
One-year post-transplant death-censored graft survival was higher for HS candidates post-KAS compared to pre-KAS (97.4% and 96.3% for cPRA 80-89% candidates, 97.6% and 94.5% for cPRA 90-97% candidates, 98.8% and 92.7% for cPRA 98% candidates, 97.9% and 94.4% for cPRA 99% candidates, 96.8% and 95.6% for cPRA 99.5-99.9% candidates, and 96.6% and 95.0% for cPRA 99.9%+ candidates, respectively, p<0.001). After adjusting for recipient characteristics, only cPRA 90-97% (adjusted HR [aHR]: 0.290.430.62, p<0.001), cPRA 98% (aHR: 0.110.260.63, p=0.003), and cPRA 99% candidates (aHR: 0.170.360.77, p=0.008) had a decreased risk of one-year death-censored graft failure post-KAS compared to pre-KAS (Table 7).
DISCUSSION
In this nationwide study examining DDKT rates for HS candidates after KAS, we found no bolus effect and that DDKT rates for HS candidates continued to be dramatically different even 3 years after implementation of KAS. The large disparities in DDKT rates that existed prior to KAS across cPRA levels were substantially reduced at 3-years post-KAS. However, there continue to be large differences in DDKT rates for groups of cPRA 100% candidates, with cPRA 99.5-99.9% candidates having a significantly higher DDKT rate (aIRR: 2.463.504.98) compared to non-HS candidates. Conversely, cPRA 99.9%+ candidates had a substantially lower DDKT rate (aIRR: 0.290.400.56). We have also shown that the population-level changes in DDKT rates have had a direct impact on the individual-level cumulative incidence of DDKT, such that the cumulative incidences of DDKT for cPRA groups have become more similar 3-years post-KAS. Despite these changes, we have also shown that waitlist mortality has not substantially changed for the HS post-KAS, with cPRA 98%+ candidates continuing to have an increased likelihood of waitlist mortality compared to non-HS candidates. Finally, while 1-year post-transplant mortality is unchanged for HS candidates post-KAS, cPRA 90-97%, 98%, and 99% candidates have a significantly lower risk of 1-year death-censored graft failure.
Our results are consistent with several studies pubished shortly after KAS implementation that described a significant short-term increase in DDKT rate for cPRA ≥ 98% candidates (6, 7, 9, 17). However, we have extended this work by showing that KAS also affected DDKT rates of other HS candidates. Notably, we showed that cPRA 80-89% candidates have a lower DDKT rate 3 years post-KAS compared to pre-KAS. We also showed that despite this decline, they were not disadvantaged by this change, but rather their DDKT rate became more similar to other cPRA groups. Additionally, we have demonstrated that KAS led to more balanced access to DDKT for the HS. For example, cPRA 99.9%+ candidates had a 3-year cumulative incidence of DDKT of 20.2% post-KAS compared to 30.7% for non-HS candidates, whereas pre-KAS they had a cumulative incidence of 4.2% and 32.1%, respectively. Importantly, the proportion of DDKT recipients with a prior kidney transplant increased only slightly (14.7% post-KAS vs. 13.0% pre-KAS), suggesting that the large changes in access to DDKT for the HS were not driven primarily by prioritization of candidates with a prior kidney transplant. Although HS candidates are now transplanted out of proportion to their prevalence on the waitlist, the dramatic improvement in DDKT rates has led to an allocation system where they now have a realistic likelihood undergoing DDKT, without significantly affecting likelihood of DDKT for non-HS candidates.
This relative homogenization of DDKT rates based on cPRA is a remarkable accomplishment given the profound disparities that existed prior to KAS, and is consistent with the European experience with the Eurotransplant Acceptable Mismatch program (2,3, 18–20). Although implemented over 25 years ago, this program was developed in response to a growing concentration of HS candidates (defined in this program as cPRA ≥ 85%) on the waitlist in a number of European countries (18). This program defines acceptable antigens for transplantation in the HS candidate, and then mandates sharing of organs across participating countries to any patient with a cPRA ≥ 85% who has no mismatches with the donor organ (18). After implementation, access to DDKT improved for HS candidates, as the number of organ offers they received increased and their waiting times to DDKT decreased (20). Thus, the success of KAS has mirrored the success of other transplant programs designed to facilitate DDKT among HS candidates.
Although KAS has led to more balanced access to DDKT across cPRA groups, there continue to be important differences in DDKT rates. Notably, cPRA 99.5-99.9% candidates have a substantially higher likelihood of DDKT compared to non-HS candidates (aSHR: 1.742.082.47, p<0.001), whereas cPRA 99.9% + candidates have a lower likelihood (aSHR: 0.490.600.75, p<0.001). This is consistent with a study showing that cPRA 100% candidates represent a group of candidates who can have varying access to DDKT based on their unrounded cPRA (21). Since KAS awards the same amount of allocation points to all cPRA 100% candidates, regardless of their unrounded cPRA, it is not unexpected that cPRA 99.5-99.9% candidates would be significantly more likely to find a match than cPRA 99.9%+ candidates. If future policy changes to KAS were to be considered, the exact amount of bonus points awarded to cPRA 100% candidates should consider the differing likelihood of DDKT based on their unrounded cPRA value.
Finally, the overall increase in DDKT rates for HS candidates that we report here may shed some light on an important issue – how to best manage the highly sensitized patient. Highly sensitized patients represent a challenging group of patients to manage as they face significant risks both before and after transplantation including increased waitlist mortality, higher rates of delayed graft function, acute rejection, and graft loss (2, 3, 21–28). As a result of these, a number of alternative transplantation techniques have been developed – including kidney-paired donation (KPD) and incompatible living donor kidney transplantation (ILDKT) (11, 12, 29–33). We have previously shown that ILDKT confers a survival benefit compared to entering the deceased donor waiting list and then potentially undergoing DDKT (12). However, this study was conducted before KAS. As DDKT rates have significantly changed for HS candidates after KAS, it is possible that the survival benefit of ILDKT after KAS may be different. Moreover, the use of KPD has expanded, and dramatic variation exists in time to KPD depending on a particular patient’s cPRA and blood type (34). In light of the vast improvement in access to DDKT that we report here, the relative benefit of each transplantation method compared to the others should be revisited.
Our study has some limitations that merit further discussion. First, in using national registry data the presence of missing data and data entry error is unavoidable. However, the data that we used is typically of high quality since it is critical to organ allocation priority (13). In our study, missing data were minimal and thus unlikely to change inferences – for example, cPRA was missing for <0.01% of candidates. Secondly, in comparing relative DDKT rates we adjusted for variables known to be associated with access to DDKT. However, we are unable to control for unmeasured confounders that also affect this rate (such as cardiovascular comorbidities that may be more prevalent in HS candidates and are associated with waitlist mortality, precluding DDKT). Although unlikely, It is possible that these confounders could alter the relationship between cPRA, KAS, and DDKT rates that we have described. Additionally, our study was not designed to quantify whether the effect of KAS was different for HS candidates in different geographic regions. However, the HS candidates that benefited from KAS (cPRA ≥ 98%) receive local, regional, and national sharing priority, such that geographic differences in how KAS affected these candidates should be relatively small. Nevertheless, we acknowledge that geography continues to remain an important determinant of access to DDKT under KAS (35).
In conclusion, we have shown that KAS has been successful at increasing DDKT rates for the most HS candidates (cPRA ≥ 98%). Although substantial imbalance in DDKT rates continue to exist for cPRA 99.5-99.9% and 99.9%+ candidates, relative DDKT rates between cPRA categories have become more homogenous. Although KAS has not resulted in a perfectly equitable system, it has led to more balanced DDKT rates for candidates of all cPRA groups.
ACKNOWLEDGMENTS
This work was supported by grant numbers F32DK113719 (Jackson), F32DK109662 (Holscher), K01DK101677 (Massie), RO1DK098431 (Segev), K24DK101828 (Segev), and K23DK115908 (Garonzik-Wang) from the National Institute of Diabetes and Digestive and Kidney Diseases (NIDDK). Ms. Covarrubias is supported by a Doris Duke Clinical Research Mentorship Grant. Dr. Holscher is supported by the American College of Surgeons Resident Research Scholarship. Dr. Garonzik-Wang is supported by a Clinician Scientist Development Award from the Doris Duke Charitable Research Foundation. The analyses described here are the responsibility of the authors alone and do not necessarily reflect the views or policies of the Department of Health and Human Services, nor does mention of trade names, commercial products or organizations imply endorsement by the U.S. Government.
The data reported here have been supplied by the Minneapolis Medical Research Foundation (MMRF) as the contractor for the Scientific Registry of Transplant Recipients (SRTR). The interpretation and reporting of these data are the responsibility of the author(s) and in no way should be seen as an official policy of or interpretation by the SRTR or the U.S. Government.
Abbreviations:
- aHR
adjusted hazard ratio
- aIRR
adjusted incidence rate ratio
- aSHR
adjusted subhazard ratio
- cPRA
calculated paneal reactive antigen
- DDKT
deceased donor kidney transplantation
- HS
highly sensitized
- ILDKT
incompatible living donor kidney transplantation
- KAS
Kidney Allocation System
- KPD
kidney-paired donation
- OPO
organ procurement organization
- SRTR
Scientific Registry for Transplant Recipients
Footnotes
DISCLOSURE
The authors of this manuscript have no conflicts of interest to disclose as described by the American Journal of Transplantation.
REFERENCES
- (1).Friedwald J, Samana C, Kasiske B, et al. The kidney allocation system. Surg Clin N Am. 2013; 93(6):1395–1406 [DOI] [PubMed] [Google Scholar]
- (2).Chang P, Gill J, Dong J, et al. Living donor age and kidney allograft half-life: Implications for living donor paired exchange programs. Clin J Am Soc Nephrol. 2012; 7(5):835–841 [DOI] [PMC free article] [PubMed] [Google Scholar]
- (3).Sapir-Pichhadze R, Tinckam K, Laupacis A, et al. Immune sensitization and mortality in wait-listed kidney transplant candidates. J Am Soc Nephrol. 2016; 27:570–578 [DOI] [PMC free article] [PubMed] [Google Scholar]
- (4).Bostock IC, Alberu J, Arvizu A, et al. Probability of deceased donor kidney transplantation based on % PRA. Transpl Immunol. 2013;28(4):154–158 [DOI] [PubMed] [Google Scholar]
- (5).Israni A, Salkowski N, Gustafson S, et al. New national allocation policy for deceased donor kidneys in the United States and possible effect on patient outcomes. J Am Soc Nephrol. 2014; 25(8):1842–1848 [DOI] [PMC free article] [PubMed] [Google Scholar]
- (6).Hickey M, Zheng Y, Valenzuela N, et al. New priorities: Analysis of the new kidney allocation system on UCLA patients transplanted from the deceased donor waitlist. Human Immunology. 2017; 78(1):41–48 [DOI] [PubMed] [Google Scholar]
- (7).Colovai A, Ajaimy M, Kamal L, et al. Increased access to transplantation of highly sensitized patients under the new kidney allocation system. A single center experience. Human Immunology. 2017; 78(3):257–262 [DOI] [PubMed] [Google Scholar]
- (8).Stewart D, Kucheryavaya A, Klassen D, et al. Changes in deceased donor kidney transplantation one year after KAS implementation. Am J Transplant. 2016; 16(6):1834–1847 [DOI] [PubMed] [Google Scholar]
- (9).Parsons R, Locke J, Redfield III R, et al. Kidney transplantation of highly sensitized recipients under the new kidney allocation system: A reflection from five different transplant centers across the United States. Human Immunology; 78(1):30–36 [DOI] [PMC free article] [PubMed] [Google Scholar]
- (10).Massie A, Luo X, Lonze B, et al. Early changes in kidney distribution under the new allocation system. J Am Soc Nephrol. 2016; 27(8):2495–2501 [DOI] [PMC free article] [PubMed] [Google Scholar]
- (11).Segev DL, Gentry SE, Warren DS, et al. Kidney paired donation and optimizing the use of live donor organs. JAMA. 2005;293(15):1883–1890 [DOI] [PubMed] [Google Scholar]
- (12).Orandi BJ, Luo X, Massie AB, et al. Survival benefit with kidney transplant from HLA-incompatible live donors. New Engl J Med. 2016. 374(10):940–950 [DOI] [PMC free article] [PubMed] [Google Scholar]
- (13).Massie AB, Kucirka LM, and Segev DL. Big data in organ transplantation: registries and administrative claims. Am J Transplant. 2014; 14(8):1723–1730 [DOI] [PMC free article] [PubMed] [Google Scholar]
- (14).Williams R A note on robust variance estimation for cluster-correlated data. Biometrics, 2000; 56:656–646 [DOI] [PubMed] [Google Scholar]
- (15).Fine J ,Gray R. A proportional hazards model for the subdistribution of a competing risk. J Am Stat Assoc. 199;94(446):496–509 [Google Scholar]
- (16).Louis TA, Zeger SL. Effective communication of standard errors and confidence intervals. Biostatistics. 2009(1):1–2. [DOI] [PMC free article] [PubMed] [Google Scholar]
- (17).Hahn AB, Mackey M, Constantino D, et al. The new kidney allocation system does not equally advantage all high cPRA candidates – a single center analysis. Human Immunol, 2017, 78:37–40 [DOI] [PubMed] [Google Scholar]
- (18).Heidt S, Witvliet M, Geert W, et al. 25th anniversary of the Eurotransplant Acceptable Mismatch Program for highly sensitized patients. Transplant Immunol; 2015, 33:51–57 [DOI] [PubMed] [Google Scholar]
- (19).Heidt S, Haasnoot G, Rood J, et al. Kidney allocation based on proven acceptable antigens results in superior graft survival in highly sensitized patients. Kidney International, 2018; 93:491–500. [DOI] [PubMed] [Google Scholar]
- (20).Class FH, Witvliet MD, Duquesnoy RJ, et al. The acceptable mismatch program as a fast tool for highly sensitized patients awaiting a cadaveric kidney transplantation: short waiting time and excellent graft outcomes. Transplantation, 2004; 78(2): 190–193 [DOI] [PubMed] [Google Scholar]
- (21).Keith D, Vranic G. Approach to the highly sensitized kidney transplant candidate. Clin J Am Soc Nephrol, 2016; 11: 684–693 [DOI] [PMC free article] [PubMed] [Google Scholar]
- (22).Histocompatibility Lonze B. and management of the highly sensitized kidney transplant candidate. Curr Opin Organ Transplant, 2017; 22:415–420 [DOI] [PubMed] [Google Scholar]
- (23).Susal C, Dohler B, Opelz G. Presensitized kidney graft recipients with HLA class I and II antibodies are at increased risk for graft failure: a Collaborative Transplant Study report. Hum Immunol. 2009; 70(8):569–573 [DOI] [PubMed] [Google Scholar]
- (24).Ponticelli C The mechanisms of acute transplant rejection revisited. J Nephrol. 2012; 25(2):150–158 [DOI] [PubMed] [Google Scholar]
- (25).Redfield RR, Scalea JR, Zens TJ, et al. The mode of sensitization and its influence on allograft outcomes in highly sensitized kidney transplant recipients. Nephrol Dial Transplant 2016; 31:1746–1753 [DOI] [PubMed] [Google Scholar]
- (26).Perasaari J, Kyllonen L, Salmela K, et al. Pre-transplant donor-specific anti-human leukocyte antigen antibodies are associated with high risk of delayed graft function after renal transplantation. Nephrol Dial Transplant. 2016; 31:672–678 [DOI] [PubMed] [Google Scholar]
- (27).Schwaiger E, Eskandary F, Kozakowski N, et al. Deceased donor kidney transplantation across donor-specific antibody barriers: predictors of antibody-mediated rejection. Nephrol Dial Transpl. 2016; 31(8):1342–1351 [DOI] [PubMed] [Google Scholar]
- (28).Chang P, Gill J, Dong J, et al. Living donor age and kidney allograft half-life: Implications for living donor paired exchange programs. Clin J Am Soc Nephrol. 2012; 7(5):835–841 [DOI] [PMC free article] [PubMed] [Google Scholar]
- (29).Montgomery RA, Lonze BE, King KE, et al. Desensitization in HLA-incompatible kidney recipients and survival. N Engl J Med 2011; 365: 318–326. [DOI] [PubMed] [Google Scholar]
- (30).Pankhurst L, Hudson A, Mumford L, et al. The UK National Registry of ABO and HLA Antibody Incompatible Renal Transplantation: Pretransplant Factors Associated With Outcome in 879 Transplants. Transplant Direct; 2017. 3(7):e18. [DOI] [PMC free article] [PubMed] [Google Scholar]
- (31).Manook M, Koeser L, Ahmed Z, et al. Post-listing survival for highly sensitised patients on the UK kidney transplant waiting list: a matched cohort analysis. Lancet; 2017, 389:727–734 [DOI] [PubMed] [Google Scholar]
- (32).Montgomery RA, Simpkins CE, Segev DL. New options for patients with donor incompatibility. Transplantation. 2006;82(2):164–165. [DOI] [PubMed] [Google Scholar]
- (33).Montgomery RA, Zachary AA, Ratner LE, et al. Clinical results from transplanting incompatible live kidney donor/recipient pairs using kidney paired donation. JAMA. 2005;294(13):1655–1663 [DOI] [PubMed] [Google Scholar]
- (34).Holscher CM, Jackson K, Chow EK, et al. Kidney exchange match rates in a large multicenter clearinghouse. Am J Transplant. 2018, 00:1–8 [DOI] [PMC free article] [PubMed] [Google Scholar]
- (35).Zhou S, Massie AB, Luo X, et al. Geographic disparity in kidney transplantation under KAS. Am J Transplant. 2018; 18(6):1415–1423 [DOI] [PMC free article] [PubMed] [Google Scholar]