

Abstract
Background & aims
Non-invasive biomarkers are needed for monitoring changes in liver histology in patients with non-alcoholic steatohepatitis (NASH). Obeticholic acid (OCA) was shown to improve fibrosis in patients with NASH in the FLINT trial; a post hoc analysis of these data was performed to determine the relationship between 3 non-invasive fibrosis markers and liver fibrosis improvement.
Methods
In the Phase 2b FLINT trial, patients were randomised (1:1) to receive 25 mg OCA or placebo once daily for 72 weeks. Aspartate aminotransferase:platelet ratio index (APRI), fibrosis-4 (FIB-4) index, and non-alcoholic fatty liver disease fibrosis score (NFS) were evaluated in serum at baseline and weeks 24, 48, 72, and 96. Liver biopsies were obtained at baseline and 72 weeks.
Results
In patients with fibrosis improvement at week 24, scores were reduced by a median of 34% for APRI, 10% for FIB-4, and 4% for NFS. Reductions in APRI (p=0.015) and FIB-4 (p=0.036), but not NFS (p=0.201) at week 24, significantly correlated with ≥1-stage improvement in histologic fibrosis at week 72. Reductions in APRI at week 72 were significantly correlated with fibrosis improvement at week 72 (p=0.012). Patients receiving OCA had significant reductions in all markers compared with patients receiving placebo at week 72 [APRI and FIB-4 (p<0.0001); NFS (p<0.05)].
Conclusions
Readily available non-invasive markers may predict improvement in liver fibrosis in patients with NASH. Upon external confirmation and further refinement in larger populations, these markers may serve as surrogate end points in NASH clinical trials.
Keywords: Non-alcoholic steatohepatitis, biomarkers, non-invasive, fibrosis
Introduction
Non-alcoholic steatohepatitis (NASH) is an aggressive form of non-alcoholic fatty liver disease (NAFLD) that can progress to cirrhosis and end-stage liver disease.1,2 The disease increasingly contributes to the need for liver transplantation and to the development of hepatocellular carcinoma.1,2 Liver-related morbidity and mortality in patients with NASH are largely related to fibrotic remodelling of the liver into cirrhosis,3–5 A key objective of drug development for NASH is to reduce both the histologic severity of NASH and the fibrosis stage.6
Obeticholic acid (OCA) is a selective and potent farnesoid X receptor agonist previously shown to improve insulin resistance in a Phase 2 study of patients with NAFLD and type 2 diabetes mellitus.7 In the Phase 2B Farnesoid X Receptor Ligand Obeticholic Acid in Non-alcoholic Steatohepatitis Treatment (FLINT) trial, histologic features, including fibrosis stage, improved in significantly more patients treated with OCA than with placebo.8
A liver biopsy with histologic examination is the gold standard for the assessment of hepatic fibrosis.9 Liver biopsy is a potentially painful and costly procedure that is invasive, but rarely life-threatening.9,10 In some clinical trials or follow-up schedules, potential concerns are exacerbated by the need for serial biopsy evaluations.11 Histologic evaluation is subjective and therefore vulnerable to intraobserver and interobserver variability.9,12 Furthermore, length and core diameter can affect the biopsy reading.11 Biopsies may not be broadly appropriate across patients with a risk of NASH given the ~30% prevalence rate of NAFLD in the general population and paucity of healthcare professionals trained in performing liver biopsies.13
To address the shortcomings of liver biopsies, several non-invasive laboratory-based tools have been developed for the assessment of hepatic fibrosis in patients with NASH. Such biomarkers can potentially be used to identify the current stage of fibrosis or fibrogenic activity or to predict the future trajectory of fibrosis change during the course of the disease or in response to specific antifibrotic interventions. Most of the literature has not focused on the specific context of use for the biomarkers under consideration. A key unanswered question is whether these laboratory-based tools can identify improvement in fibrosis once treatment is initiated. This study was therefore performed to obtain early proof-of-concept data on the ability of these laboratory tools to identify improvements in fibrosis following intervention in the context of the FLINT trial.
Three commonly used panels were tested; the aspartate aminotransferase:platelet ratio index (APRI), fibrosis-4 (FIB-4) index, and non-alcoholic fatty liver disease fibrosis score (NFS) involve routine laboratory measures and have had better predictive value than other non-invasive serum markers for identifying advanced fibrosis and in excluding the presence of fibrosis.14–18 However, these assessments may be less sensitive in detecting changes in the intermediate stages of fibrosis.9 A meta-analysis showed better diagnostic performance of FIB-4 and NFS than APRI in NAFLD.19
The enhanced liver fibrosis test has been shown to identify advanced fibrosis, but more studies are required to further assess its clinical role.20,21 The objectives of the current post hoc analysis of the FLINT trial were to evaluate changes from baseline in APRI, FIB-4 index, and NFS over time, examine their relationship with fibrosis improvement or worsening at week 72, and assess whether changes in these markers predict alteration in fibrosis stage at the end of treatment. This analysis will indicate whether early results with these three non-invasive markers predict later improvement in hepatic lobular fibrosis and treatment responsiveness to OCA.
Materials and methods
Study design and patients
This post hoc analysis used data from the FLINT trial (ClinicalTrials.gov identifier: NCT01265498), a multicentre, prospective, randomised, placebo-controlled, double-blind Phase 2b study of the efficacy and safety of OCA for the treatment of NASH. The primary results have been published previously, along with a complete description of the trial design and patient disposition.8 The full protocol is available at http://jhuccs1.us/nash/open/protocols/FLINT/FLINTdocs.htm.
Briefly, enrolled patients had biopsy-proven NASH with high disease activity, defined as a non-alcoholic fatty liver disease activity score (NAS) ≥4. Biopsy specimens were at least 0.5 cm in length. Clinical and laboratory assessments were performed at baseline and at 3-month intervals until the end of treatment (EOT) at 72 weeks. Patients underwent an EOT liver biopsy to assess the efficacy of OCA. Study treatments (i.e. OCA and placebo) were then discontinued, and a 6-month follow-up period was used to determine the durability of clinical and laboratory changes associated with OCA treatment. APRI, FIB-4 index, and NFS were determined using platelet count and levels of albumin, alanine aminotransferase (ALT), and aspartate aminotransferase (AST) obtained at baseline and weeks 24, 48, 72, and 96. The pathology committee of the NASH Clinical Research Network (CRN) performed masked liver histology assessments as described previously.8
Baseline and EOT histologic data for the 200 patients who had completed the EOT biopsy at the time of a prespecified interim assessment indicated significant effects of OCA on all components of NASH. The independent data safety and monitoring board determined that imposing the risks of a research-related biopsy and continuing treatment exposure were unnecessary for the remaining patients because their liver biopsy results were not anticipated to substantially alter overall trial results. Of patients who reached the 72-week EOT time point, 91% underwent an EOT liver biopsy.
Non-invasive fibrosis markers
The following non-invasive markers of fibrosis were examined in sera at baseline and weeks 24, 48, 72, and 96 as follows14,15,17,18:
APRI = {[AST (U/L)/AST (ULN)/platelets (109/L)]} × 100
FIB-4 = age (y) × AST (U/L)/[platelets (109/L) × ALT (U/L)]½
NFS = −1.675 + 0.037 × age (y) + 0.094 × BMI (kg/m2) + 1.13 × IFG/diabetes (yes=1, no=0) + 0.99 × AST/ALT ratio – 0.013 platelets (109/L) – 0.66 × albumin (g/dL)
where ALT indicates alanine aminotransferase; AST, aspartate aminotransferase; BMI, body mass index; IFG, impaired fasting glucose; ULN, upper limit of normal.
Statistical analysis
Analyses were conducted using primarily the completer population, defined as all patients who were randomised, received treatment, and had available biopsy results for both baseline and 72 weeks.
Continuous variables for patient baseline characteristics, including APRI, FIB-4 index, and NFS, were compared between the OCA and placebo groups in the completer population via analysis of covariance (ANCOVA) with stratification for study site and diabetes status. Diabetes status was compared between treatment groups using the Cochran-Mantel-Haenszel chi-square test with stratification for study site. Mean and 95% confidence intervals (CIs) for each marker at each visit and least squares (LS) means and 95% CIs for change from baseline at each visit were plotted by treatment group. Treatment effects were compared using ANCOVA models, controlling for baseline outcome value. To demonstrate reproducibility of results, a similar analysis was conducted for the intent-to-treat (ITT) population, defined as all patients who were randomised and received treatment. Mean and 95% CI for each marker at each visit were also plotted by fibrosis stage at baseline for the completer population. Wilcoxon rank sum analysis was used to evaluate the association between the median percentage change from baseline to week 24 in scores for each marker among patients with fibrosis improvement noted on the EOT biopsy and an improvement in histologic fibrosis of ≥1 stage at week 72. A logistic regression model including the entire completer population was used to evaluate early (i.e. 24-week) changes in the markers as predictors of improvement in histologic fibrosis at 72 weeks. A similar analysis was repeated for the median percentage change from baseline to week 72 in scores for each marker with fibrosis improvement, and a logistic regression model including the entire completer population was used to evaluate changes in markers at 72 weeks as predictors of histologic improvement. Patients with missing data at a time point were not included in the analysis for that time point. For each marker, a receiver operating characteristic (ROC) curve of sensitivity versus specificity of predicting a histologic response was plotted, and the area under the ROC curve (AUROC), 95% CI, negative predictive values (NPVs), and positive predictive values (PPVs) were calculated.
All post hoc analyses were conducted using SAS® 9.4 (SAS Institute Inc., Cary, NC, USA).
Results
Patients
In the FLINT trial, 283 patients were randomly assigned to receive OCA (n=141) or placebo (n=142) and comprised the ITT population (supplemental figure 1).8 Two hundred comprised the completer population with baseline and EOT biopsies (OCA, n=102; placebo, n=98).8 Baseline characteristics, including APRI, FIB-4 index, and NFS, were similar between the OCA and placebo groups (table 1).8 The mean (min, max) length of biopsy specimens for patients was 2.1 cm (0.5, 6.1 cm) at baseline and 1.8 cm (0.5, 4.8 cm) at 72 weeks.
Table 1:
Baseline characteristics: Completer population
| Parameter | OCA 25 mg (n=102) |
Placebo (n=98) |
|---|---|---|
| Age (y) | 52 (11) | 50 (12) |
| BMI (kg/m2) | 35 (6)a | 34 (6) |
| Diabetes (%) | 53 | 54 |
| AST (U/L) | 64 (39) | 56 (31) |
| ALT (U/L) | 82 (48) | 82 (49) |
| ALP (U/L) | 82 (28) | 81 (25) |
| Triglycerides (mmol/L) | 2.4 (3.5) | 2.1 (2.0) |
| Platelets (109/L) | 241 (60) | 242 (65) |
| Albumin (g/L) | 43 (4) | 43 (4) |
| APRI | 0.7 (0.5) | 0.6 (0.4) |
| FIB-4 | 1.6 (0.8) | 1.4 (0.7) |
| NFS | –1.0 (1.4)a | –1.3 (1.3) |
Data are mean (SD) unless otherwise indicated.
n=101.
The completer population was defined as all patients who were randomly assigned and received treatment and who had available biopsy results for both baseline and 72 weeks.
ALP, alkaline phosphatase; ALT, alanine aminotransferase; APRI, aspartate aminotransferase:platelet ratio index; AST, aspartate aminotransferase; BMI, body mass index; FIB-4, fibrosis-4; OCA, obeticholic acid; NFS, non-alcoholic fatty liver disease fibrosis score; SD, standard deviation.
Changes in markers over time (completer and ITT populations)
In the completer population, statistically significant differences in the change from baseline were seen between the OCA and placebo groups at 24, 48, and 72 weeks for APRI and FIB-4 scores (figure 1). APRI, FIB-4 index, and NFS decreased over time with OCA treatment and increased after treatment discontinuation (figure 1). At 24, 48, and 72 weeks, mean APRI scores in the OCA group were below 0.5, indicating a low probability of advanced fibrosis (figure 1A). Similarly, mean FIB-4 scores in the OCA group were below 1.3 at 48 and 72 weeks (figure 1B). See supplemental table 1 for results with additional cutoffs.
Figure 1.
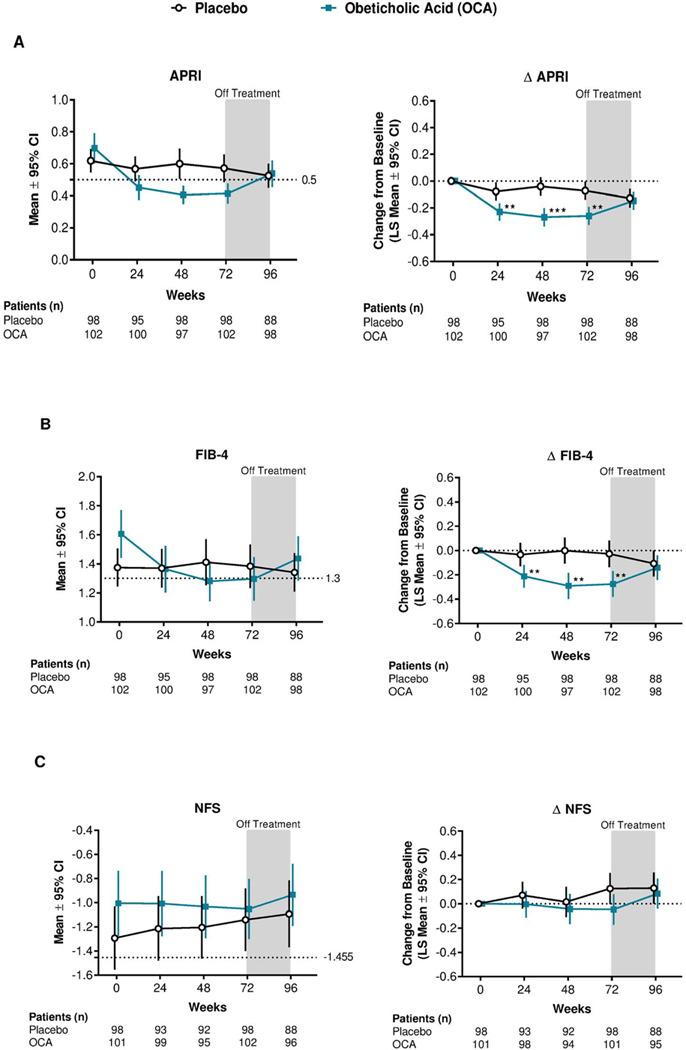
Mean and mean change for APRI, FIB-4, and NFS scores over time: Completer population.
**p<0.01; ***p<0.0001. p values were calculated using ANCOVA models, controlling for baseline value of the outcome. Patients with missing data at a specific time point were not included in the analysis for that time point.
The completer population was defined as all patients who were randomly assigned, received treatment and had available biopsy results for both baseline and 72 weeks. ANCOVA, analysis of covariance; APRI, aspartate aminotransferase:platelet ratio index; CI, confidence interval; FIB-4, fibrosis-4; LS, least squares; OCA, obeticholic acid; NFS, non-alcoholic fatty liver disease fibrosis score.
Consistent with the completer population, the ITT population had significant differences in the change from baseline between the OCA and placebo groups at 24, 48, and 72 weeks for APRI and FIB-4 scores (supplemental figure 2). The ITT population also had significant differences after treatment discontinuation for FIB-4 score and at 72 weeks for NFS score (supplemental figure 2).
Patients grouped by baseline fibrosis stage showed changes in APRI and FIB-4 scores over time in the OCA group across baseline fibrosis stages 1 through 3, with higher baseline fibrosis stages demonstrating more pronounced improvements (figure 2). No clear trends were observed for changes in NFS over time relating to baseline fibrosis stage in either OCA or placebo group (figure 2C).
Figure 2.
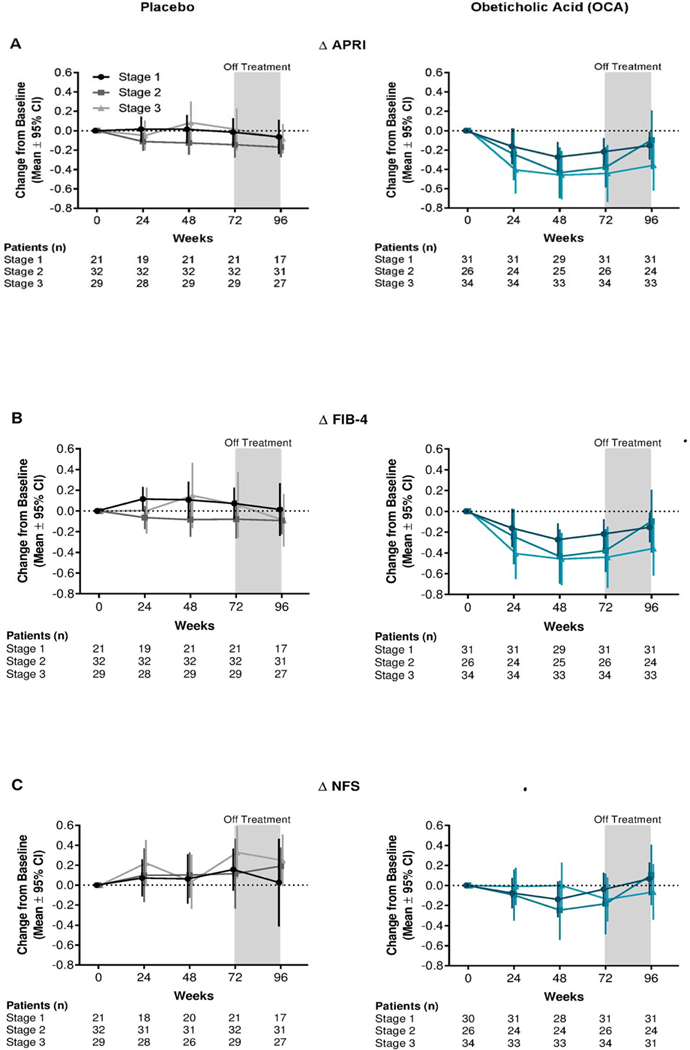
Mean change from baseline to Week 72 for APRI, FIB-4, and NFS by baseline fibrosis stage for OCA (teal) and placebo (grey): Completer population.
Patients with missing data at a specific time point were not included in the analysis for that time point.
The completer population was defined as all patients who were randomly assigned, received treatment and had available biopsy results for both baseline and 72 weeks.
APRI, aspartate aminotransferase:platelet ratio index; CI, confidence interval; FIB-4, fibrosis-4; OCA, obeticholic acid; NFS, non-alcoholic fatty liver disease fibrosis score.
With the fastest rate of change in APRI and FIB-4 index scores occurring between baseline and week 24, week 24 was the focus of analyses to evaluate early changes in the markers as predictors of later histologic improvement in fibrosis at week 72.
Changes in markers as predictors of histologic improvement in fibrosis (completer population)
Generally, APRI, FIB-4 index, and NFS reductions were more pronounced over time in patients with an improvement in fibrosis ≥1 histologic stages at 72 weeks than in those without improvement (figure 3).
Figure 3:
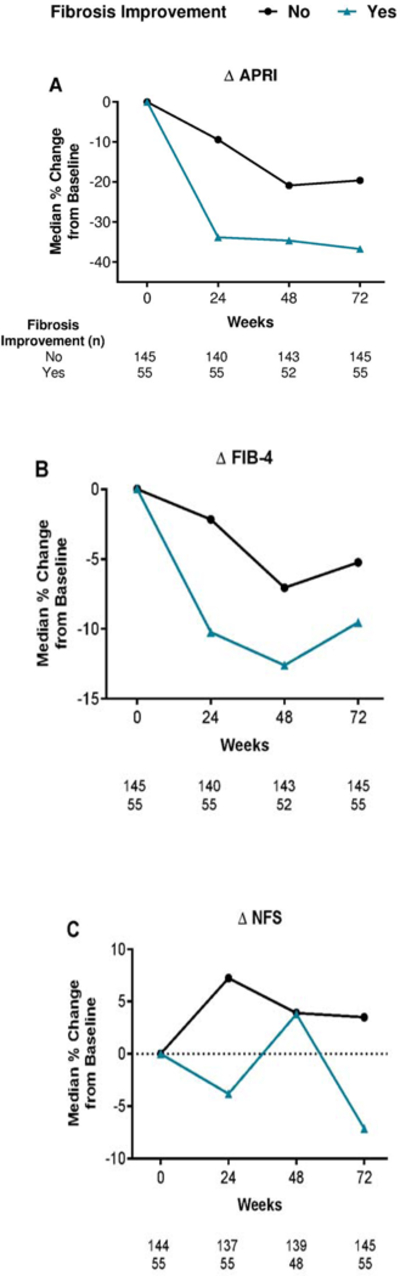
Median percentage change from baseline in APRI, FIB-4, and NFS by improvement in histologic stage at 72 weeks: Completer population.
Patients with missing data at a specific time point were not included in the analysis for that time point.
The completer population was defined as all patients who were randomly assigned, received treatment and had available biopsy results for both baseline and 72 weeks.
APRI, aspartate aminotransferase:platelet ratio index; FIB-4, fibrosis-4; NFS, non-alcoholic fatty liver disease fibrosis score.
In patients with fibrosis improvement, median scores were reduced at 24 weeks by 34% for APRI and 10% for the FIB-4 index. These median reductions in scores at 24 weeks were significantly associated with an improvement of ≥1 stage in histologic fibrosis at 72 weeks (Wilcoxon rank sum analysis; APRI, p=0.015; FIB-4, p=0.036; figure 3A-B). There was no association between the median percentage change from baseline to 24 weeks in NFS (4%) and the improvement in fibrosis at 72 weeks (p=0.201; figure 3C). AUROC analyses (figure 4) for predicting histologic improvement in fibrosis at 72 weeks showed a numerically lower AUROC for NFS (0.65, 95% CI: 0.56–0.73) than for APRI (0.72, 95% CI: 0.65–0.80) or FIB-4 score (0.68, 95% CI: 0.60–0.76) at 24 weeks (figure 4, table 2), and PPVs and NPVs were also lower (table 2). The probability equation for predicting histologic improvement in fibrosis for each measure is shown in table 2.
Figure 4:
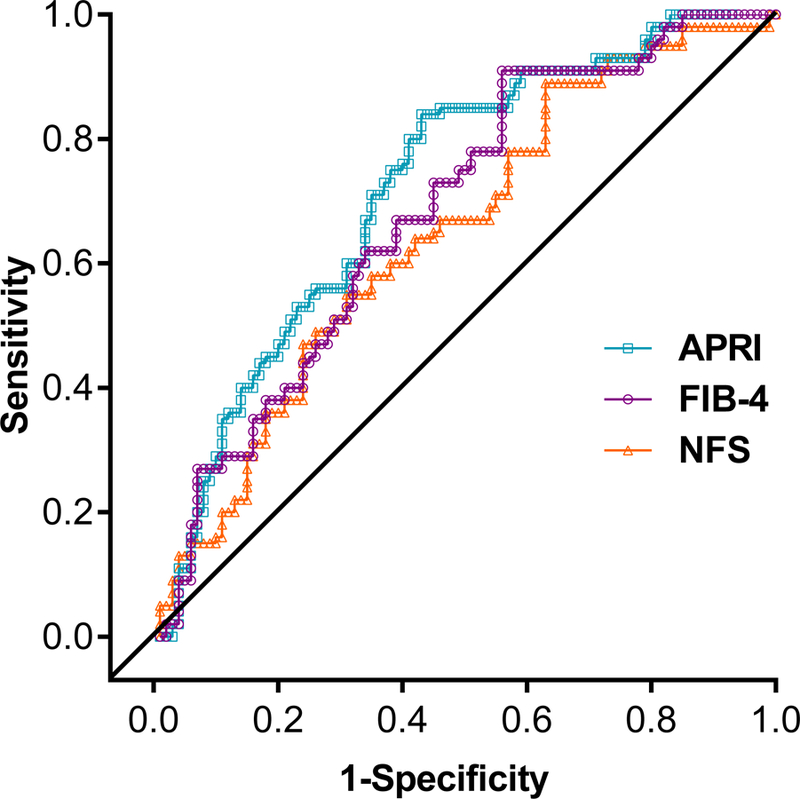
ROC curve for APRI, FIB-4, and NFS at 24 weeks as predictors of histologic improvement in fibrosis at week 72 showing sensitivity and specificity: Completer population.
The completer population was defined as all patients who were randomly assigned, received treatment and had available biopsy results for both baseline and 72 weeks.
APRI, aspartate aminotransferase:platelet ratio index; FIB-4, fibrosis-4; NFS, non-alcoholic fatty liver disease fibrosis score; ROC, receiver operator characteristic.
Table 2:
Performance characteristics of non-invasive measures for the prediction of fibrosis improvement at 24 weeks: Completer population
| Score | Cut- off |
AUROC (95% CI) |
NPV | PPV | Probability Equation |
|---|---|---|---|---|---|
| APRI | 0.23 | 0.72 (0.65, 0.80) |
89.9% | 43.4% | −1.25 + 0.71 x baseline fibrosis stage − 3.00 x baseline APRI − 2.74 * change in APRI at week 24 + 0.59 x (1 if OCA, 0 if PBO) |
| FIB-4 | 0.20 | 0.68 (0.60, 0.76) |
91.0% | 38.3% | −1.68 + 0.68 x baseline fibrosis stage − 0.77 x baseline FIB-4 − 0.78 * change in FIB-4 at week 24 + 0.81 x (1 if OCA, 0 if PBO) |
| NFS | 0.20 | 0.65 (0.56, 0.73) |
89.1% | 36.0% | −2.75 + 0.60 x baseline fibrosis stage − 0.19 x baseline NFS − 0.49 * change in NFS at week 24 + 0.84 x (1 if OCA, 0 if PBO) |
The completer population was defined as all patients who were randomly assigned and received treatment and who had available biopsy results for both baseline and 72 weeks. The NPV and PPV were calculated based on 195 patients for APRI and FIB-4 and 191 patients for NFS.
APRI, aspartate aminotransferase:platelet ratio index; AUROC, area under the receiver operator characteristic curve; CI, confidence interval; FIB-4, fibrosis-4; NFS, non-alcoholic fatty liver disease fibrosis score; NPV, negative predictive value; PBO, placebo; OCA, obeticholic acid; PPV, positive predictive value.
The median percentage score reduction at 72 weeks was significantly associated with an improvement of ≥1 stage in fibrosis at 72 weeks only for APRI (p=0.012; figure 3A). For both FIB-4 index and NFS, median percentage score changes from baseline to 72 weeks were not significantly associated with an improvement in fibrosis at 72 weeks (FIB-4, p=0.497; NFS, p=0.164; figures 3B and 3C). The AUROC values were higher for APRI (0.73) than for FIB-4 (0.67) and NFS (0.66) at 72 weeks; the PPV was highest for APRI, and the NPV was highest for NFS (supplemental figure 3, supplemental table 2).
Changes in biomarker components over time (completer population)
ALT and AST levels decreased from baseline to 24, 48, and 72 weeks with OCA treatment and increased during the off-treatment period, whereas the AST/ALT ratio and platelet count increased within the normal range with OCA and decreased after treatment discontinuation (supplemental figure 4). Increases in the AST/ALT ratio in the OCA group were driven by non-proportional reductions in AST and ALT levels with OCA treatment, rather than rising AST or ALT level. These changes were significantly different between the OCA group (during treatment) and the placebo group (supplemental figure 4). Serum albumin was significantly lower in the OCA than the placebo group at 24 and 72 weeks (supplemental figure 4).
Changes in markers over time in patients with fibrosis worsening (completer population)
Changes in APRI, FIB-4 index, and NFS scores were minimal for the 51 patients who demonstrated a worsening of fibrosis over time (supplemental figure 5).
Discussion
Results of this post hoc analysis provide proof of concept that longitudinal changes in non-invasive measures of fibrosis correlate with improvements in histologic fibrosis. Improvements from baseline in APRI and FIB-4 scores occurred with OCA treatment regardless of baseline disease stage, with greater benefits at higher baseline fibrosis stages. Decreases from baseline in APRI, FIB-4 index, and NFS were significantly more pronounced with OCA than with placebo, which was observed as early as 24 weeks and was sustained over the course of treatment for APRI and FIB-4 scores. APRI and FIB-4 scores were more sensitive than NFS in predicting later fibrosis stage improvements.
Results from a meta-analysis showed better diagnostic performance of FIB-4 and NFS than APRI in NAFLD.19 Given that OCA consistently improved APRI in this study, further validation in future studies will help to validate marker sensitivity for predicting fibrosis improvements.
The lower overall sensitivity of the NFS may be associated with its AST/ALT ratio component. Small increases in the AST/ALT ratio were significant and sustained over time on the basis of non-proportional reductions in AST and ALT levels. The individual AST and ALT improvements were inaccurately reflected by the AST/ALT ratio increases, suggesting that the NFS may have underestimated the effects of OCA treatment on fibrosis. An additional finding was the lack of sensitivity to worsening fibrosis for all of the non-invasive markers evaluated. Patients who experienced histologic worsening in fibrosis had almost no change from baseline in APRI, FIB-4 index, or NFS. This observation could be explained by a potential sampling artefact that led to an overestimate of the degree of liver fibrosis on the EOT biopsy compared with baseline.22 Alternatively, the risk of a type II error for identifying worsening fibrosis with these tests is possible.
Limitations of this evaluation include the need to interpret post hoc and subgroup analyses of clinical studies with caution until further validation.23 In addition, the limited sampling frequency in the FLINT trial for both laboratory biomarkers (i.e. once every 24 weeks) and histologic evaluations (i.e. at baseline and 72 weeks) precluded the ability to assess the time to effect of OCA on these outcomes and the predictive value of APRI, FIB-4 index, and NFS at time points earlier than 24 weeks. Moreover, the relatively wide CIs for the AUROC findings in this analysis may suggest the need to investigate the predictive value of additional biomarkers.
Several previous studies evaluated longitudinal changes in non-invasive measures of fibrosis and associations with histologic or clinical outcomes24–30; however, limited reports have paired these assessments with liver biopsy evaluations.25,27,28,30 Among the serum markers currently available for non-invasive evaluation of fibrosis, APRI, FIB-4 index, and NFS have been used and validated most extensively.9,31 Advantages of APRI and FIB-4 scores over patented non-invasive tests include a lack of additional costs, ease of calculation, and wide availability.9 However, all of the serum markers are less well validated across the spectrum of NAFLD than in hepatitis C virus, hepatitis B virus, or human immunodeficiency virus/hepatitis C virus co-infection.9 Results of the primary analysis from the Phase 2b FLINT trial (N=283) in patients with NASH showed that OCA-related improvements in the more commonly used APRI and FIB-4 scores may be correlated with histologic treatment benefits such as improvements in fibrosis (OCA 35% and placebo 19%).8 With further validation, these findings may improve clinicians’ ability to decide whether to continue OCA therapy, thereby mitigating the potential risks, complications, and logistical issues associated with liver biopsy.
Although these data are insufficient to draw definitive conclusions, they provide proof of concept that fibrosis improvement is associated with improvement in these indices and provide a rationale for larger prospective studies to further validate their use for identification of treatment response and to develop “stopping rules.” Evaluation of the effects of OCA on these markers in patients with NASH from the REGENERATE trial (ClinicalTrials.gov identifier: NCT02548351) is currently under way. These results also support the need for more accurate biomarkers that can identify both improvement and worsening of fibrosis.
Supplementary Material
Key points:
Liver biopsy remains the gold standard for assessing fibrosis status, but non-invasive technologies may improve the standard of care for patients with liver disease
In FLINT, OCA treatment resulted in histologic improvement in fibrosis
In the present post hoc analysis of FLINT, the histologic benefits of OCA treatment appeared to correlate with improvements in APRI and FIB-4 scores
These results suggest the potential utility of non-invasive measures in predicting treatment response with OCA
Acknowledgements
The FLINT trial was conducted by the NASH CRN investigators and sponsored by the NIDDK, with funding support from Intercept Pharmaceuticals, Inc. The current analysis was conducted by Intercept Pharmaceuticals, Inc., on the basis of data provided by the NASH CRN. All authors had full access to the data for interpretation and analysis and were involved in development and final approval of this article for publication. All authors vouch for the accuracy and completeness of the data. Professional writing and editorial services and assistance with figure preparation were provided by MedLogix Communications, LLC (funded by Intercept Pharmaceuticals, Inc.). Additional writing support was provided by Alexander Liberman and Kjersti Swearingen (Intercept Pharmaceuticals, Inc.).
Trial registration number: ClinicalTrials.gov identifier, NCT01265498
Statement of financial support:
The FLINT trial was conducted by the NASH CRN investigators and sponsored by the NIDDK, with funding support from Intercept Pharmaceuticals, Inc. Analyses were conducted by Intercept Pharmaceuticals, Inc., on the basis of data provided by the NASH CRN. Professional writing and editorial assistance were funded by Intercept Pharmaceuticals, Inc.
Abbreviations (in order of appearance):
- NASH
non-alcoholic steatohepatitis
- NAFLD
non-alcoholic fatty liver disease
- OBA
obeticholic acid
- FLINT
Farnesoid X Receptor Ligand Obeticholic Acid in Non-alcoholic Steatohepatitis Treatment
- APRI
aminotransferase:platelet ratio index
- FIB-4
fibrosis-4
- NFS
non-alcoholic fatty liver disease fibrosis score
- NAS
non-alcoholic fatty liver disease activity score
- EOT
end of treatment
- ALT
alanine aminotransferase
- AST
aspartate aminotransferase
- CRN
Clinical Research Network
- BMI
body mass index
- IFG
impaired fasting glucose
- ULN
upper limit of normal
- ANCOVA
analysis of covariance
- CI
confidence interval
- LS
least squares
- ITT
intent-to-treat
- ROC
receiver operating characteristic
- AUROC
area under the ROC curve
- NPV
negative predictive value
- PPV
positive predictive value
- ALP
alkaline phosphatase
- SD
standard deviation
- PBO
placebo
Footnotes
Conflicts of interests:
NC received consulting fees from AbbVie Inc., Domain Therapeutics, Afimmune, Eli Lilly and Company, Cempra, Shire, Axovant, Ardelyx, NuSirt Biopharma, and Tobira (Allergan) Therapeutics, Inc., and grant/research support from Galectin Therapeutics Inc., Cumberland, Gilead Sciences, Inc., and Intercept Pharmaceuticals, Inc. MFA received consulting fees from BHV Pharma, Inc., and TaiwanJ Pharmaceuticals Co. Ltd. and grant/research support from Allergan, Arisaph Pharmaceuticals, Inc., Boehringer-Ingelheim GmbH, Bristol-Myers Squibb Company, Conatus Pharmaceuticals Inc., Exalenz Bioscience Ltd., Galectin Therapeutics Inc., Galmed Pharmaceuticals Ltd., Genfit Corp., Gilead Sciences, Inc., Immuron, Intercept Pharmaceuticals, Inc., Madrigal Pharmaceuticals, Inc., NGM Biopharmaceuticals, Inc., NIH/NIDDK, Shire, TaiwanJ Pharmaceuticals Co. Ltd., and Tobira Therapeutics, Inc. MFA has also received speaker fees from Alexion Pharma GmbH and advisory/review panel fees from Bristol-Myers Squibb Company, Celgene Corporation, NGM Biopharmaceuticals, Inc., and Pfizer Inc. RL received advisory/review panel fees from Arrowhead Pharmaceuticals, Inc., Galmed Pharmaceuticals Ltd., and Tobira Therapeutics, Inc., and consulting fees from Alnylam Pharmaceuticals, Inc., Celgene Corporation, Corgenix, DeuteRx, Enanta Pharmaceuticals, Inc., Gilead Sciences, Inc., Janssen Pharmaceuticals, Inc., and Zafgen Inc. RL also received grant/research support from Adheron Therapeutics, Inc., AGA Pharma & Supplements SL, Daiichi Sankyo Company, Ltd., Immuron, KineMed, Inc., Merck & Co., Inc., and Promedior, Inc. KVK received advisory/review panel fees from AbbVie Inc., Enanta Pharmaceuticals, Inc., Gilead Sciences, Inc., Intercept Pharmaceuticals, Inc., Merck & Co., Inc., Novartis Pharmaceuticals Corporation, Trio Health, and Verlyx Pharma Inc. and grant/research support from AbbVie Inc., Evidera, Galectin Therapeutics Inc., Gilead Sciences, Inc., Immuron, Intercept Pharmaceuticals, Inc., Merck & Co., Inc., NGM Biopharmaceuticals, Inc., Novartis Pharmaceuticals Corporation, Tobira Therapeutics, Inc., and Trio Health. KVK has also received speaker fees from Gilead Sciences, Inc., and Intercept Pharmaceuticals, Inc. AJM has nothing to disclose. SD received consulting fees from Fresenius Kabi. BAN-T received advisory/review panel fees from Allergan, Bristol-Myers Squibb Company, Conatus Pharmaceuticals Inc., Galmed Pharmaceuticals, Ltd., Janssen Pharmaceuticals, Inc., Nimbus Therapeutics, Novartis Pharmaceuticals Corporation, Pfizer Inc., Receptos Services, LLC, and Zafgen Inc. and consulting fees from Medimmune. NT received advisory/review panel fees from Biotest Pharmaceuticals Corporation and Eisai Co., Ltd. and consulting fees from Achillion Pharmaceuticals, Inc., Bristol-Myers Squibb Company, Cocrystal Pharma, Inc., and Merck & Co., Inc. NT also received grant/research support from AbbVie Inc., Biotest Pharmaceuticals Corporation, Eisai Co., Ltd., Gilead Sciences, Inc., Merck & Co., Inc., Novartis Pharmaceuticals Corporation, and Vertex Pharmaceuticals Inc. BF is an employee of Intercept Pharmaceuticals, Inc. RS is an employee of Intercept Pharmaceuticals, Inc., and receives stock ownership. DS is an employee of Intercept Pharmaceuticals, Inc., and receives stock ownership. AJS received advisory/review panel fees from Abbott, Bristol-Myers Squibb Company, Exalenz Bioscience Ltd., Gilead Sciences, Inc., Genfit Corp., Ikaria, Inc., Novartis Pharmaceuticals Corporation, and Pfizer Inc. and consulting fees from Echosens, Genentech, Inc., HemoShear Therapeutics, LLC, JD Pharma Consultants Pvt. Ltd., Nimbus Therapeutics, Merck & Co., Inc., Salix Pharmaceuticals, Takeda Pharmaceutical Company Ltd., and Zafgen Inc. AJS also received grant/research support from Galmed Pharmaceuticals Ltd., Genentech, Inc., Gilead Sciences, Inc., Ikaria, Inc., Intercept Pharmaceuticals, Inc., Novartis Pharmaceuticals Corporation, Salix Pharmaceuticals, Takeda Pharmaceutical Company Ltd., and Tobira Therapeutics, Inc., and contracting fees from Elsevier B.V. and UpToDate, Inc. AJS also holds a management position at Sanyal Biotechnology and has stock options in Genfit, HemoShear, Exalenz, and Galmed.
References
- 1.Chalasani N, Younossi Z, Lavine JE, et al. The diagnosis and management of nonalcoholic fatty liver disease: practice guidance from the American Association for the Study of Liver Diseases. Hepatology 2017; published online July 17 DOI: 10.1002/hep.29367. [DOI] [PubMed]
- 2.Charlton MR, Burns JM, Pedersen RA, Watt KD, Heimbach JK, Dierkhising RA. Frequency and outcomes of liver transplantation for nonalcoholic steatohepatitis in the United States. Gastroenterology 2011;141(4):1249–1253. [DOI] [PubMed] [Google Scholar]
- 3.Brunt EM. Nonalcoholic fatty liver disease: pros and cons of histologic systems of evaluation. Int J Mol Sci 2016;17(1):pii: E97. [DOI] [PMC free article] [PubMed] [Google Scholar]
- 4.Dulai PS, Singh S, Patel J, et al. Increased risk of mortality by fibrosis stage in non-alcoholic fatty liver disease: systematic review and meta-analysis. Hepatology 2017;65(5):1557–1565. [DOI] [PMC free article] [PubMed] [Google Scholar]
- 5.Singh S, Allen AM, Wang Z, Prokop LJ, Murad MH, Loomba R. Fibrosis progression in nonalcoholic fatty liver vs nonalcoholic steatohepatitis: a systematic review and meta-analysis of paired-biopsy studies. Clin Gastroenterol Hepatol 2015;13(4):643–654. e641–649; quiz e639–640. [DOI] [PMC free article] [PubMed] [Google Scholar]
- 6.Sanyal AJ, Chalasani N, Kowdley KV, et al. Pioglitazone, vitamin E, or placebo for nonalcoholic steatohepatitis. N Engl J Med 2010;362(18):1675–1685. [DOI] [PMC free article] [PubMed] [Google Scholar]
- 7.Mudaliar S, Henry RR, Sanyal AJ, et al. Efficacy and safety of the farnesoid X receptor agonist obeticholic acid in patients with type 2 diabetes and nonalcoholic fatty liver disease. Gastroenterology 2013;145(3):574–582 e571. [DOI] [PubMed] [Google Scholar]
- 8.Neuschwander-Tetri BA, Loomba R, Sanyal AJ, et al. Farnesoid X nuclear receptor ligand obeticholic acid for non-cirrhotic, non-alcoholic steatohepatitis (FLINT): a multicentre, randomised, placebo-controlled trial. Lancet 2015;385(9972):956–965. [DOI] [PMC free article] [PubMed] [Google Scholar]
- 9.European Association for Study of the Liver, Asociación Latinoamericana para el Estudio del Hígado. EASL-ALEH clinical practice guidelines: non-invasive tests for evaluation of liver disease severity and prognosis. J Hepatol 2015;63(1):237–264. [DOI] [PubMed] [Google Scholar]
- 10.Bravo AA, Sheth SG, Chopra S. Liver biopsy. N Engl J Med 2001;344(7):495–500. [DOI] [PubMed] [Google Scholar]
- 11.Vuppalanchi R, Ünalp A, Van Natta M, et al. Effects of liver biopsy sample length and number of readings on sampling variability in nonalcoholic Fatty liver disease. Clin Gastroenterol Hepatol 2009;7(4):481–486. [DOI] [PMC free article] [PubMed] [Google Scholar]
- 12.The French METAVIR Cooperative Study Group. Intraobserver and interobserver variations in liver biopsy interpretation in patients with chronic hepatitis C. Hepatology 1994;20(1 Pt 1):15–20. [PubMed] [Google Scholar]
- 13.Younossi ZM, Blissett D, Blissett R, et al. The economic and clinical burden of nonalcoholic fatty liver disease in the United States and Europe. Hepatology 2016;64(5):1577–1586. [DOI] [PubMed] [Google Scholar]
- 14.Angulo P, Bugianesi E, Bjornsson ES, et al. Simple noninvasive systems predict long-term outcomes of patients with nonalcoholic fatty liver disease. Gastroenterology 2013;145(4):782–789 e784. [DOI] [PMC free article] [PubMed] [Google Scholar]
- 15.Angulo P, Hui JM, Marchesini G, et al. The NAFLD fibrosis score: a noninvasive system that identifies liver fibrosis in patients with NAFLD. Hepatology 2007;45(4):846–854. [DOI] [PubMed] [Google Scholar]
- 16.Kaswala DH, Lai M, Afdhal NH. Fibrosis assessment in nonalcoholic fatty liver disease (NAFLD) in 2016. Dig Dis Sci 2016;61(5):1356–1364. [DOI] [PubMed] [Google Scholar]
- 17.Shah AG, Lydecker A, Murray K, et al. Comparison of noninvasive markers of fibrosis in patients with nonalcoholic fatty liver disease. Clin Gastroenterol Hepatol 2009;7(10):1104–1112. [DOI] [PMC free article] [PubMed] [Google Scholar]
- 18.Wai CT, Greenson JK, Fontana RJ, et al. A simple noninvasive index can predict both significant fibrosis and cirrhosis in patients with chronic hepatitis C. Hepatology 2003;38(2):518–526. [DOI] [PubMed] [Google Scholar]
- 19.Xiao G, Zhu S, Xiao X, Yan L, Yang J, Wu G. Comparison of laboratory tests, ultrasound, or magnetic resonance elastography to detect fibrosis in patients with nonalcoholic fatty liver disease: A meta-analysis. Hepatology 2017;66(5):1486–1501. [DOI] [PubMed] [Google Scholar]
- 20.Fagan KJ, Pretorius CJ, Horsfall LU, et al. ELF score >/=9.8 indicates advanced hepatic fibrosis and is influenced by age, steatosis and histological activity. Liver Int 2015;35(6):1673–1681. [DOI] [PubMed] [Google Scholar]
- 21.Irvine KM, Wockner LF. The enhanced liver fibrosis score is associated with clinical outcomes and disease progression in patients with chronic liver disease 2016;36(3):370–377. [DOI] [PubMed] [Google Scholar]
- 22.Ratziu V, Charlotte F, Heurtier A, et al. Sampling variability of liver biopsy in nonalcoholic fatty liver disease. Gastroenterology 2005;128(7):1898–1906. [DOI] [PubMed] [Google Scholar]
- 23.Curran-Everett D, Milgrom H. Post-hoc data analysis: benefits and limitations. Curr Opin Allergy Clin Immunol 2013;13(3):223–224. [DOI] [PubMed] [Google Scholar]
- 24.Friedman S, Sanyal A, Goodman Z, et al. Efficacy and safety study of cenicriviroc for the treatment of non-alcoholic steatohepatitis in adult subjects with liver fibrosis: CENTAUR phase 2b study design. Contemp Clin Trials 2016;47:356–365. [DOI] [PubMed] [Google Scholar]
- 25.Kawamura Y, Arase Y, Ikeda K, et al. Large-scale long-term follow-up study of Japanese patients with non-alcoholic fatty liver disease for the onset of hepatocellular carcinoma. Am J Gastroenterol 2012;107(2):253–261. [DOI] [PubMed] [Google Scholar]
- 26.Parikh P, Ingle M, Patel J, Bhate P, Pandey V, Sawant P. An open-label randomized control study to compare the efficacy of vitamin e versus ursodeoxycholic acid in nondiabetic and noncirrhotic Indian NAFLD patients. Saudi J Gastroenterol 2016;22(3):192–197. [DOI] [PMC free article] [PubMed] [Google Scholar]
- 27.Pelusi S, Petta S, Rosso C, et al. Renin-angiotensin system inhibitors, type 2 diabetes and fibrosis progression: an observational study in patients with nonalcoholic fatty liver disease. PLoS One 2016;11(9):e0163069. [DOI] [PMC free article] [PubMed] [Google Scholar]
- 28.Suzuki K, Yoneda M, Imajo K, et al. Transient elastography for monitoring the fibrosis of non-alcoholic fatty liver disease for 4 years. Hepatol Res 2013;43(9):979–983. [DOI] [PubMed] [Google Scholar]
- 29.Tapper EB, Lai M. Weight loss results in significant improvements in quality of life for patients with nonalcoholic fatty liver disease: a prospective cohort study. Hepatology 2016;63(4):1184–1189. [DOI] [PMC free article] [PubMed] [Google Scholar]
- 30.Unger LW, Herac M, Staufer K, et al. The post-transplant course of patients undergoing liver transplantation for nonalcoholic steatohepatitis versus cryptogenic cirrhosis: a retrospective case-control study. Eur J Gastroenterol Hepatol 2017;29(3):309–316. [DOI] [PubMed] [Google Scholar]
- 31.Castera L, Vilgrain V, Angulo P. Noninvasive evaluation of NAFLD. Nat Rev Gastroenterol Hepatol 2013;10(11):666–675. [DOI] [PubMed] [Google Scholar]
Associated Data
This section collects any data citations, data availability statements, or supplementary materials included in this article.