Abstract
Goal-directed behavior requires integrating action selection processes with learning systems that adapt control using environmental feedback. These functions are known to intersect at a common neural substrate with multiple known targets of plasticity (the cortico-basal ganglia-thalamic network), suggesting that feedback signals have a multifaceted impact on future decisions. Using a hybrid of accumulation-to-bound decision models and reinforcement learning, we modeled the performance of humans in a stop signal task where participants (N 75: 37 males, 38 females) learned the prior distribution of the timing of a stop signal through trial-and-error feedback. Changes in the drift rate of the action execution process were driven by errors in action timing, whereas adaptation in the boundary height served to increase caution following failed stops. These findings highlight two interactive learning mechanisms for adapting the control of goal-directed actions based on dissociable dimensions of feedback error.
SIGNIFICANCE STATEMENT Many complex behavioral goals rely on the ability to regulate the timing of action execution while also maintaining enough control to cancel actions in response to “Stop” cues in the environment. Here we examined how these fundamental components of behavior become tuned to the control demands of the environment by combining principles of reinforcement learning with accumulation-to-bound models. Model fits to behavioral data in an adaptive stop signal task revealed two adaptive mechanisms: (1) timing error-related changes in the rate of the execution signal; and (2) an increase in the execution boundary after failed stops. These findings demonstrate unique effects of timing and control errors on the underlying mechanisms of control, the rate and threshold of accumulating action signals.
Keywords: accumulator model, basal ganglia, inhibitory control, reinforcement learning
Introduction
Environmental uncertainty demands that goal-directed actions be executed with a certain degree of caution, requiring agents to strike the appropriate balance between speed and control based on internal goals and contextual constraints. Because of the pervasive and dynamic nature of uncertainty in the real world, the degree to which behavioral control is exercised must be learned through trial and error. Indeed, decision processes (Verbruggen and Logan, 2009; Schall et al., 2017) and postdecision feedback learning (Sutton and Barto, 1998; Frank and Badre, 2012) are thought to rely on overlapping subcomponents of cortico-basal ganglia (BG)-thalamus networks, providing a possible neural locus for adaptive control (Bogacz and Larsen, 2011; Pedersen et al., 2017).
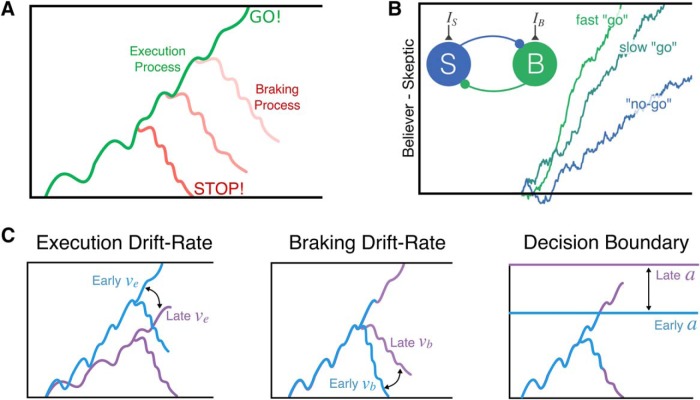
We previously proposed a novel dependent process model (DPM) of cortico-BG-thalamic-dependent inhibitory control that was inspired by the architecture of these pathways (Dunovan et al., 2015). In the DPM, reactive cancellation signals from the hyperdirect pathway depend on the current state of a proactive execution process, reflecting the instantaneous competition between the direct (i.e., Believer) and indirect (i.e., Skeptic) pathways (Fig. 1A,B) (Dunovan and Verstynen, 2016). Increasing the strength of the Skeptic results in a slower accumulation of evidence toward the execution threshold, promoting fast, reactive cancellation in the context of greater uncertainty (see also (Bariselli et al., 2018).
Figure 1.
Adaptation mechanisms in the DPM. A, The DPM assumes that the state of an accumulating execution process at the time a stop cue is registered determines initial state of the braking process, making it more difficult to cancel actions closer to the execution boundary. B, Competition between direct and indirect pathways represented by mutually inhibiting “believer” (green; direct pathway) and “skeptic” (blue; indirect pathway) populations. Circuit-level dynamics of this competition modulate the rate of evidence accumulation leading up to action execution, leading to faster actions when competition is dominated by the “believer.” C, Alternative control mechanisms that could be altered by feedback to adapt future performance. A, Adapted with permission from Dunovan et al. (2015). B, Adapted with permission from Dunovan and Verstynen (2016).
The question of adaptation of decision processes in BG pathways is complicated by the fact that these circuits have multiple targets of plasticity. Converging lines of physiological (Schmidt et al., 2013; Yttri and Dudman, 2016) and computational (Ratcliff and Frank, 2012; Wei and Wang, 2016) evidence suggest that both of the primary input structures to the BG, the striatum and subthalamic nucleus (STN), are critical for guiding adaptive behavior, but in response to different sources of environmental feedback. In the striatum, Yttri and Dudman (2016) found that optogenetic reinforcement of cortical input to direct and indirect pathways led to opposing changes in movement velocity, paralleling theoretical models that striatal learning would sculpt the drift rate of a decision process over time (Dunovan and Verstynen, 2016). In contrast, the STN is also seen as a major source of behavioral adaptation in the BG (Brittain et al., 2012; Cavanagh et al., 2014; Frank et al., 2015; Herz et al., 2016). For instance, Cavanagh et al. (2014) found that activity in the STN tracked the degree to which subjects slowed responding after committing an error and that this behavioral phenomenon was described by a diffusion model in which errors led to an increase in threshold on subsequent trials.
Having multiple neural targets of plasticity suggests that inhibitory control processes may adapt differently in response to different learning signals. For example, learning may adapt the balance of direct and indirect pathway competition, changing the drift rate of the execution process on each trial. Based on previous optogenetics work (Yttri and Dudman, 2016), we predict that this process will adapt based on errors in the timing or speed of an action (Fig. 1C, left). In contrast, errors in selection (e.g., failing to stop an inappropriate action) may impact future decisions by either increasing the speed of future cancelation processes (Fig. 1C, middle) or elevating the threshold for evidence for the execution process, thereby delaying action execution in the context of uncertainty (Fig. 1C, right) (Herz et al., 2016).
Here we examine how trial-to-trial feedback is incorporated into future decisions as subjects learn to proactively control responses in an adaptive version of the stop signal task, where subjects are scored according to the precision of their response time (RT) on Go trials and their accuracy on stop signal trials. This adaptive DPM reliably captures feedback-dependent changes in RT and stop accuracy through targeted changes in specific decision parameters, showing how simple plasticity mechanisms can allow for cognitive systems to effectively implement internal priors about environmental states (Wu et al., 2002; Verstynen and Sabes, 2011).
Materials and Methods
Participants.
Neurologically healthy adult participants (N = 75, 37 males, 38 females, mean age 22 years) were recruited from the Psychology Research Experiment System at Carnegie Mellon University and compensated for their participation through course credit toward fulfillment of their semester course requirements. All experimental and analytical protocols described in this study were approved by the local Institutional Review Board at Carnegie Mellon University. Experimenters obtained informed, written consent from all subjects in compliance with Institutional Review Board guidelines.
Experimental design and statistical analysis.
The primary experimental condition of interest, the mean and variance of contextual stop signal delay (SSD) distributions, were manipulated between participant groups (N = 25 per group). The effect of context on behavioral measures (e.g., correct go RTs, stop accuracy, and posterror slowing) was assessed using separate one-way ANOVAs. Computational models were fit to individual subject- and subject-averaged data, and compared based on two complexity-penalized goodness-of fit statistics: Akaike Information Criterion (AIC) and Bayesian Information Criterion (BIC). A difference of 7–10 in the information criteria (IC) values for two models provides strong support for the model with the lower value. All modeling code has been made available on GitHub (https://github.com/CoAxLab/radd), along with a demo for replicating several of the manuscript figures (https://github.com/CoAxLab/radd/blob/master/demos/AdaptiveDPM_Demo_2018.ipynb).
Adaptive stop signal task.
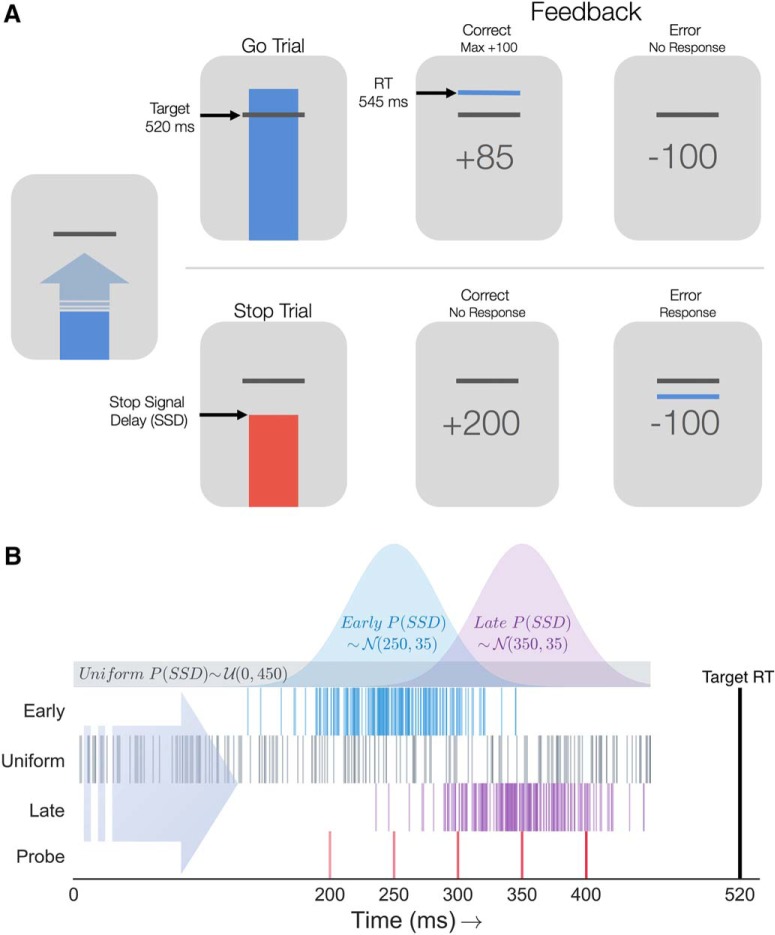
All subjects completed a stop signal task (Ntrials = 880) in which a vertically moving bar approached a white horizontal target line at the top of the screen (Fig. 2A). On Go trials (NGO = 600), the subject was instructed to make a key press as soon as the bar crossed the target. The bar always intersected the target line at 520 ms after trial onset. On each trial, the bar continued filling upward until a key press was registered or until reaching the top of the screen, allowing a 680 ms window for the subject to make a response. If no response was registered, the subject received a penalty of −100 points. On Go trials where a response was recorded before the 680 ms trial deadline, the subject received a score reflecting the precision of their RT relative to the target intersection time, resulting in maximal points when RT = 520 ms. On Stop trials, the bar would stop and turn red before intersecting the target line, prompting the subject to withhold their response. Successful and unsuccessful Stop trials yielded a reward of 200 points and penalty of −100 points, respectively. The subsequent trial would begin after a 1.5 s intertrial interval. After batches of 110 trials, participants were given a break with feedback of their current point total. Participants could initiate the next trial block by pressing the spacebar. All participants completed the experiment in <1 h.
Figure 2.
Adaptive stop signal task and contextual SSD statistics. A, Anticipatory stop signal task. Top, On Go trials, subjects were instructed to press a key when the ascending bar crossed a target line, always occurring on 520 ms after trial onset. Feedback was given informing the subject if their response was earlier or later than the Go target (maximum 100 points). Bottom, On Stop trials, the bar stopped and turned red before reaching the target line. If no response was made (correct), the subject received a bonus of 200 points. Failure to inhibit the key press resulted in a −100 point penalty. B, Stop signal statistics across contexts. Distributions show the sampling distributions for SSDs on context trials in the Early (blue), Uniform (gray), and Late (purple) groups. Early and Late SSDs were normally distributed (parameters stated as in-figure text, N(μ, σ)). Below the distributions, each row of tick marks indicates the context SSDs for a single example subject in each group. Bottom row of red tick marks indicates the five probe SSDs included for all subjects regardless of context.
On the majority of Stop trials, the SSD, the delay between trial onset and when the bar stopped, was sampled from a specific probability distribution (Fig. 2B). We refer to these trials as context Stop trials (NContext = 200). Context SSDs in the Early and Late groups were sampled from Gaussian distributions with equal variance (σ = 35 ms), centered at μE = 250 ms and μL = 350 ms, respectively. Context SSDs in the Uniform group were sampled from a uniform distribution spanning a 10–520 ms window. In Figure 2B, the sampled SSD times are plotted for a single subject in each context, shown as dashes on a timeline ranging from 0 to 520 ms. Finally, additional probe Stop trials (NProbe = 80) were included in which the bar stopped at 200, 250, 300, 350, or 400 ms after trial onset (16 trials per probe SSD), shown in the Figure 2B timeline (bottom, red dashes).
Computational models: DPM.
The DPM (Fig. 1A) (Dunovan et al., 2015) assumes that the execution process (θe) begins to accumulate evidence after a delay (tr) until reaching an upper decision threshold (a), yielding a go decision and corresponding RT. The dynamics of θe are described by the stochastic differential equation in Equation 1, accumulating with a mean rate of ve (i.e., execution drift rate) and an SD described by the dynamics of a white noise process (dW) with diffusion constant σ as follows:
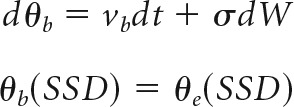
A response is recorded if θe reaches the execution boundary (a) before the end of the trial window (680 ms) and before the braking process reaches the lower (0) boundary (see below). In the event of a stop cue, the braking process (θb) is initiated at the current state of θe with a negative drift rate (vb). If θb reaches the 0 boundary before θe reaches the execution boundary, then no response or RT is recorded from the model. The change in θb over time is given by Equation 2, expressing the same temporal dynamics of θe but with a negative drift. The dependency between θb and θe in the model is described by the conditional statement in Equation 3, declaring that the initial state of θb (occurring at t = SSD) is equal to the state of θe (SSD) as follows:
 |
To determine which of the model parameter(s) best accounted for the observed behavioral effects across contexts, we first fit the model to the average data in the Uniform group, leaving all parameters free (Table 1). Using the optimized Uniform parameter estimates to initialize the model, we then fit different versions of the model to data in the Early and Late groups, allowing only one or two select parameters to vary between conditions. This form of model comparison provides a straightforward means of testing alternative hypotheses about the mechanism underlying context-specific adaptation. The fitting procedure used a combination of global and local optimization techniques (Bogacz and Cohen, 2004; Dunovan et al., 2015). All fits were initialized from multiple starting values in steps to avoid biasing model selection to unfair advantages in the initial settings. Given a set of initial parameter values, all model parameters, execution drift rate (ve), braking drift rate (vb), execution onset delay (tr), and boundary height (a), were optimized by minimizing a weighted cost function χ2static (see Eq. 4) equal to the summed and squared error between an observed and simulated (denoted by ∧ symbols) vector of the following statistics: probability (P) of responding on Go trials (g), probability of stopping at each Probe SSD (d = {200, 250, 300, 350, 400 ms}), and RT quantiles (q = {0.1, 0.2, 0.3, …, 0.9}) on correct (RT C) and error (RT E) trials as follows:
 |
The cost-function weights (w) were derived by first taking the variance of each summary measure included in the observed vector (across subjects), then dividing the mean variance by the full vector of variance scores. This approach represents the variability of each value in the vector as a ratio (Ratcliff and Tuerlinckx, 2002), where values closer to the mean are assigned a weight close to 1 and values associated with higher variability a weight <1, lower variability a weight >1 (Bogacz et al., 2006; Dunovan et al., 2015). Weights applied to the RT quantiles were calculated by estimating the variance for each of the RT quantiles (Maritz and Jarrett, 1978) and then dividing the mean variance by that of each quantile. Stop accuracy weights were calculated by taking the variance in stop accuracy at each Probe SSD (across subjects) and then dividing the mean variance by that of each condition.
Table 1.
Average uniform parameters and static DPM fit statistics
| a | ve | vb | tr | χ2 | AIC | BIC | |
|---|---|---|---|---|---|---|---|
| Mean | 0.347 | 0.91 | −0.49 | 0.152 | 0.011 | −176.97 | −172.26 |
| 95% CI | 0.022 | 0.065 | 0.046 | 0.009 | 8e-4 | 1.06 | 1.06 |
To obtain an estimate of fit reliability for each model, we restarted the fitting procedure from 20 randomly sampled sets of initial parameter values. Each initial set was then optimized to average data in the Uniform condition using the basinhopping algorithm (Wales and Doye, 1997) to find the region of global minimum followed by a Nelder–Mead simplex optimization (Nelder and Mead, 1965) for fine-tuning globally optimized parameter values. The simplex-optimized parameter estimates were then held constant, except for one or two designated context-dependent parameter(s) that were submitted to a second Simplex run to find the best fitting values in the Early and Late conditions.
Parameter recovery of static DPM.
Parameters were initially sampled from the following distributions:
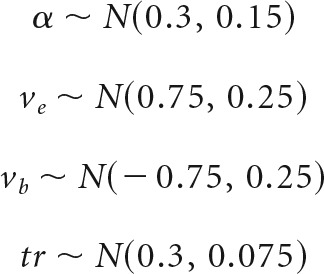 |
where N(μ, σ2) represents a normal distribution with mean (μ) and SD (σ). A total of 2000 parameter sets were initially sampled and used to simulate vectors of stopping accuracy and RT quantiles that were compared with those of the average subject in each context by means of Equation 4. For each of the three context conditions, the corresponding sampled set of parameters associated with the lowest error value was then selected as a “group-level” parameter set. For each of the three “group-level” parameter sets, 20 synthetic datasets were generated, each comprised of 25 subjects with 1000 simulated trials per subject. Each subject-level dataset was simulated using a single parameter set sampled from the distributions described in Table 2 to generate 1000 trials from the DPM. Finally, the static DPM was fit to each of these three datasets using the same optimization procedure described for fitting the DPM to the trial-averaged stop accuracy and RT quantiles for correct and error trials with the goal of recovering similar parameter values as those used to generate each simulated dataset.
Table 2.
Generative parameters used in parameter recovery analysis
| Static model |
Adaptive model |
||||||
|---|---|---|---|---|---|---|---|
| True sets | μa (σ = 0.01) | μve (σ = 0.01) | μvb (σ = 0.01) | μtr (σ = 0.005) | μσ (σ = 0.01) | μσ (σ = 0.005) | μp (σ = 0.000075) |
| Set 1 | 0.455 | 1.03 | −0.783 | 0.090 | 0.27 | 0.005 | 0.0011 |
| Set 2 | 0.323 | 1.00 | −0.235 | 0.213 | 0.20 | 0.04 | 0.0016 |
| Set 2 | 0.263 | 0.756 | −0.247 | 0.206 | 0.02 | 0.10 | 0.00025 |
Adaptive DPM.
Because standard parameter optimization for accumulator models requires information about the variance of RTs across trials, these approaches are poorly suited for investigating how decision parameters respond to error on a trialwise basis. To overcome this issue, cost function was modified (χ2adapt) to identify the values for α, β, and p that minimized the sum of the weighted difference between the average observed and model-predicted stop accuracy (μacc) and go RT (μrt) over a moving window of ∼30 trials (30 bins total; Eq. 5). The weights applied to the model-predicted error in stop accuracy (μacc) and RT (μrt) were calculated using the same method as for the static model cost function, assigning less weight to estimates in bins (i) with higher observed variance across subjects. By averaging the behavioral measures in 30 trial bins, this ensured that multiple Stop trials were included in each bin while still allowing relatively high-frequency behavioral changes to be expressed in the cost function as follows:
 |
These fits were performed by iteratively simulating the same trial sequence as observed for each individual subject, and fitting the average simulated subject to the average observed subject. This ensures that direct comparisons can be made between the trajectory of learning in the model and actual behavior.
Parameter recovery of adaptive DPM.
To assess the identifiability of parameters in the adaptive DPM, we conducted a similar parameter recovery analysis to that performed for the static model. Three different “group-level” parameter sets (Table 2) were randomly sampled from the following adaptive parameter distributions:
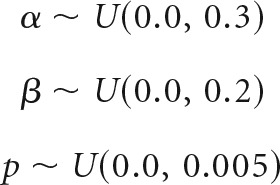 |
where U(a,b) represents a uniform distribution between values a and b. Datasets were generated by sampling α, β, and p for 25 simulated and using the adaptive DPM to simulate 880 trials in the Uniform context for each simulated subject. Subject-level samples for α, β, and p were drawn from one of three sets of generative parameter distributions shown in Table 2. Using these subject-level parameters, the adaptive DPM was then used to simulate 880 trials using the trial structure as one of the real subjects in the Uniform context. This procedure produced three artificial datasets with the same number of observations as in the experimental dataset (e.g., N = 25, 880 trials/subject). Finally, the adaptive DPM was fit to each of these three datasets using the same optimization procedure described for fitting the adaptive DPM to the empirical data. With the goal of recovering similar values of α, β, and p as those used to generate each simulated dataset.
Results
Inhibitory control adapts to contextual statistics
Subjects performed an anticipatory version of the stop signal task (Fig. 2A; see Adaptive stop signal task) similar to that reported previously (Dunovan et al., 2015), with the exception of how contextual information was conveyed to the subject. Rather than explicitly cuing the subject as to the probability of seeing a stop signal on each trial, as was used in our previous study, subjects in the current experiment had to rely on performance feedback to learn the temporal distribution of stop signals in one of three contexts.
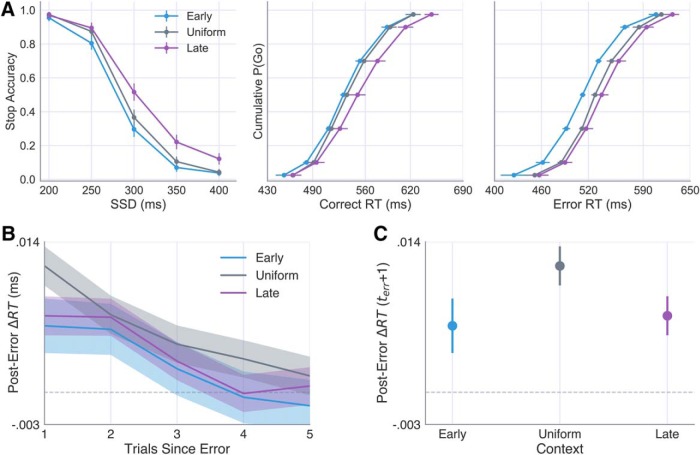
To assess behavioral differences across contexts, we compared accuracy on stop signal trials at each Probe SSD across groups as well as the mean RTs on correct (response on Go trial) and error (i.e., response on Stop trial) responses. Separate one-way ANOVAs revealed a significant main effect of context across groups on both correct RTs, F(2,72) = 10.07, p < 0.001, and error RT (responses on stop signal trials), F(2,72) = 21.72, p < 0.00001. Consistent with our hypothesis, we found a significant interaction between context condition and Probe SSD, F(2.23,80.15) = 3.60, p = 0.027 (Fig. 3A). Shifting the mean of the context SSD distribution later into the trial led to delayed responding on Go trials (Fig. 3A, middle, right) as well as greater stopping accuracy on probe trials (Fig. 3A, left) in the Uniform and Late groups relative to the Early group. Thus, as predicted, participants could reliably learn to modulate their inhibitory control efficiency based on the probabilistic structure of prior stop signal timing (Shenoy and Yu, 2011).
Figure 3.
Effects of context on stop accuracy and RTs. A, Subject-averaged stop accuracy (left) and cumulative RT distributions for correct (Go trials; middle) and error (Stop trials; right) responses in the Early (blue), Uniform (gray), and Late (purple) contexts. B, Posterror slowing following failed Stop trials in each context and subsequent decay over five trials. C, The posterror slowing observed immediately after a failed stop (terr + 1) in each context (e.g., first data point in B). Error bars and shaded area represent the 95% CI calculated across subjects.
We next examined whether failed Stop trials elicited any systematic changes in RT on subsequent trials. Figure 3B shows the immediate slowing and subsequent decay in RTs following a stop error (probe trials only), calculated with respect to the average RT on the five trials that preceded the error. A one-way ANOVA revealed a significant effect of context on the degree to which subjects slowed responses immediately following stop errors, F(2,72) = 4.27, p = 0.018. Unlike the observed effects on RT and accuracy, which scaled with differences in the mean SSD in each context, group differences in posterror slowing appeared to be driven by the variance of SSDs, with stop errors eliciting greater slowing in the Uniform context than in the Early and Late contexts (Fig. 3C). Collectively, these findings suggest that adaptive control is sensitive to multiple task dimensions and that these dimensions manifest in dissociable behavioral profiles.
Static DPM parameter identifiability
The DPM (Dunovan et al., 2015) assumes that an execution decision is made when an accumulating execution process, with onset time tr and drift rate ve, crosses an upper decision boundary a (see Computational models). On Stop trials, a nested braking process, with negative drift rate vb, is initiated at the current state of the execution process at the time of the SSD and accumulates back toward the lower boundary (always set equal to 0; Fig. 1A). The model successfully cancels an action when the braking process reaches the lower bound before execution process terminates at the upper execution threshold.
For a cognitive model to be informative, it is important to verify that its parameters are identifiable, or able to be reliably estimated from observable measures of the target behavior. The issue of model identifiability is particularly relevant to novel variants of sequential sampling models, as several recently proposed models within this class have been found to exhibit poor identifiability despite providing convincing fits to experimental data (Miletić et al., 2017; White et al., 2018). More common variants, however, such as the drift-diffusion model and linear ballistic accumulator, are reasonably identifiable with sufficient trial counts and the application of appropriate optimization procedures (Ratcliff and Tuerlinckx, 2002; van Ravenzwaaij and Oberauer, 2009; Visser and Poessé, 2017).
In practice, the identifiability of a model can be assessed by performing fits to simulated data, for which the true parameters are known, and comparing the recovered estimates. To evaluate the identifiability of parameters in the DPM, we adopted the following procedure. First, we identified three generative parameter sets that approximated the average stopping accuracy curve and RT distributions observed in each context condition, ensuring that the generative parameter sets yielded plausible behavioral patterns. Each of these three generative parameter sets served as hyperparameters describing the mean of a normally distributed population from which 25 “subject-level” parameter sets were sampled and used to simulate 1000 trials (for sampling details, see Computational models). This produced a simulated dataset similar in size and dimension to that of the empirical data while capturing the assumption that subject parameter values in each context vary around a shared mean. Each of the three group-level parameter sets was used to generate 20 simulated datasets (each comprised of 25 randomly sampled subjects with 1000 trials per subject). The DPM was then fit to the subject-averaged stop accuracy and RT quantiles for each of the simulated datasets following the optimization routine outlined in Materials and Methods (i.e., here, “subject-averaged” data were calculated by first estimating the stop accuracy curve over probe SSDs, correct RT quantiles, and error RT quantiles for each subject then calculating the mean for each of these values across subjects).
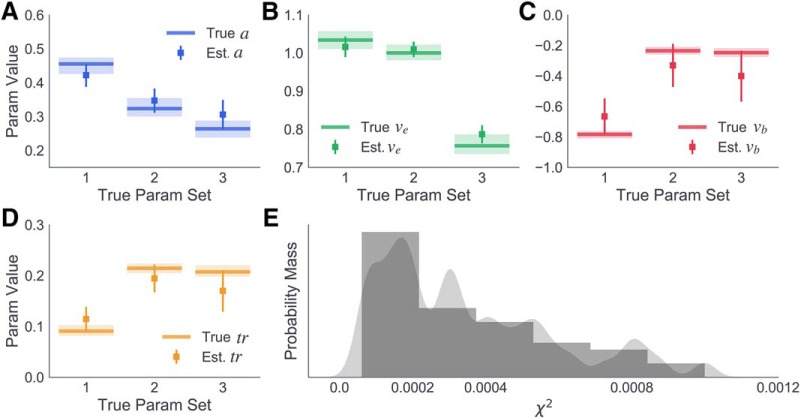
Parameter estimates recovered from the fits are summarized in Figure 4A–D, with the recovered values for each parameter plotted against the respective generative value for each of the three sets. All parameters were recovered with a high degree of accuracy. In addition to accurately recovering generative parameter values, the DPM provided high-quality fits to the datasets generated from all three parameter sets, as shown by the positively skewed distribution of χ2 values in Figure 4E. The results of this simulation and recovery analysis suggest that parameters of the DPM are identifiable when fitting group-level data and are robust to variability in the parameter values of individual subjects.
Figure 4.
Simulation and parameter recovery analysis of DPM. A, True and estimated boundary height (a; blue), (B) braking drift rate (vb; red), (C) onset time (tr; purple), and (D) execution drift rate (ve; green) for three generative parameter sets. Lines indicate true generative parameter means. Lighter colors represent the range of sampled subject-level estimates. Squares represent estimated parameter means. Error bars represent ±1 SD. E, Distribution of χ2 values for fits to all 60 simulated datasets (gray).
Individual subject DPM fits
To better understand the cognitive mechanisms underlying the observed effects of feedback on timing and control behavior across contexts, we fit RT and stop accuracy data to the DPM. To isolate the parameters that were influenced by the experimental manipulations, the model fits were performed in multiple consecutive stages. To reduce the combinatorial space of possible model configurations, we adopted a forward stepwise model selection approach where we began by comparing models in which a single parameter was free to vary across conditions (Table 3), execution drift (ve), braking drift (vb), onset delay (tr), or boundary height (a).
Table 3.
Static fit statistics for early and late contexts
| Context parameter | χ2, best (mean, 95% CI) | AIC, best (mean, 95% CI) | BIC, best (mean, 95% CI) |
|---|---|---|---|
| Execution drift (ve) | 0.023 (0.035, 0.0042) | −363.02 (−343.49, 6.27) | −343.49 (−339.75, 6.27) |
| Bound height (a) | 0.041 (0.061, 0.0066) | −334.90 (−316.72, 5.35) | −316.72 (−312.98, 5.35) |
| Braking drift (vb) | 0.045 (0.055, 0.0044) | −330.11 (−321.57, 3.90) | −337.10 (−317.83, 3.90) |
| Onset delay (tr) | 0.031 (0.044, 0.0055) | −348.01 (−332.44, 5.97) | −33.69 (−328.69, 5.97) |
| a and ve* | 0.017 (0.023, 0.0025) | −372.25 (−359.87, 5.24) | −374.04 (−352.35, 5.24) |
| vb and ve | 0.023 (0.032, 0.0035) | −358.42 (−344.51, 5.41) | −356.63 (−337.18, 5.41) |
| tr and ve | 0.024 (0.032, 0.0031) | −356.41 (−342.96, 4.48) | −363.54 (−335.29, 4.48) |
*The best-fitting model.
Because the behavioral effects of interest were driven by trial-by-trial feedback (i.e., at the subject level) as well as differences in the sampling distributions of SSDs across contexts (i.e., at the group level), single parameter models were fit to behavioral data for individual subjects, allowing select parameters to vary between the first and second half of trials in the experiment, and to data at the group level, allowing parameters to vary across contexts.
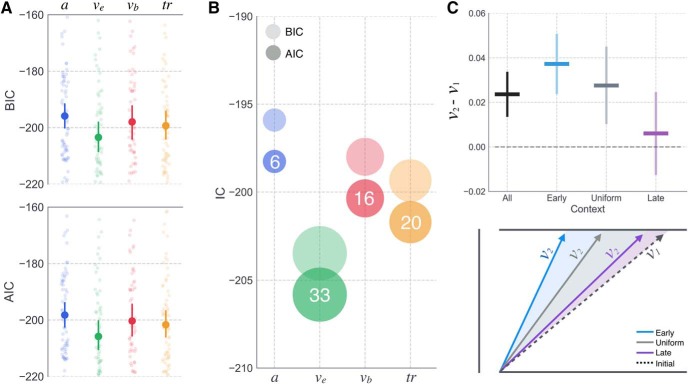
Consistent with our previous study in which subjects proactively modulated the drift rate of the execution process (ve) in a probabilistic cueing paradigm (Dunovan et al., 2015), we found that allowing ve to vary between the first and second half of trials provided the best average fit across subjects in the current experiment (AICv = −206.5, BICv = −202.2, SD = 23.47; Fig. 5A). Comparable IC scores were provided by alternative models (e.g., AICtr = −201.70, BICtr = −199.34, SD = 21.86). Thus, we also inspected the number of subjects for which each model outperformed the rest and found that the ve model was the best fitting model for more subjects (N = 33) than any alternative models (see Fig. 5B). Parameter estimates (Fig. 5C) showed that the ve values tended to increase over the course of the experiment, higher in the second compared with the first half of trials. Notably, this effect was most pronounced in the Early context, followed by the Uniform and Late contexts, respectively, suggesting that subjects in the Early context were more sensitive to timing errors than those in the Uniform and Late contexts.
Figure 5.
Single-subject DPM fits and model comparison. Variants of the DPM were fit to all individual subject datasets with different parameters left free to vary between the first and second half of trials. A, Mean subject BIC and AIC scores for boundary height (a; blue), execution drift rate (ve; green), braking drift rate (vb; red), and onset delay (tr; yellow) (dark circles). Lighter circles represent an individual subject. Error bars represent 95% CI. B, Same mean values as in A, but with size of the dots scaled to reflect the number of subjects for which each model had the lowest AIC/BIC score. White text indicates the number of subjects best described by each model (e.g., factor used to scale the size of the dots). C, Observed increase in ve values estimated for the first (v1) and second half (v2) of trials in each context. Error bars represent 95% CI. Schematic represents the relative increase in ve in Early (cyan), Uniform (gray), and Late (purple) contexts, compared with a shared initial drift rate (i.e., before learning; black dotted line).
Contextual modulation of DPM parameters
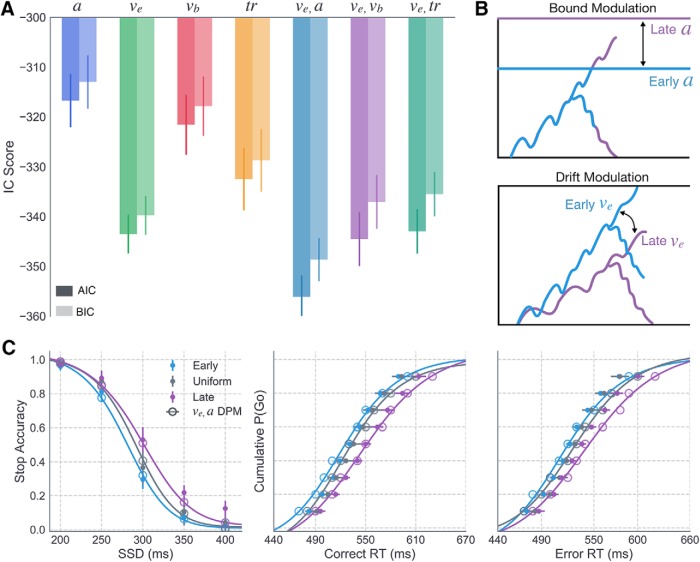
Next, we investigated whether the same mechanism was able to account for the observed differences in RT and stop accuracy at the group level, by first optimizing parameters to the average data in the Uniform context, where the timing of the stop signal is unpredictable, and then to the average data in the Early and Late contexts, holding all parameters constant at the best fitting Uniform values, except for one or two parameters of interest. The model that best accounted for differences in the stop accuracy and RT quantiles across the three context conditions was selected for further investigation of feedback-dependent learning mechanisms. The fitting routine (for details, see Materials and Methods) was repeated a total of 20 times using different initialization values for all parameters at the start of each run to avoid biases in the optimization process. The summary of fits to the Uniform context data is provided in Table 1. In line with our previous findings (Dunovan et al., 2015), as well as the outcome of single-subject fits in the current study, leaving the execution drift rate free provided a better account of context-dependent changes in behavior compared with alternative single-parameter models (Best-Fit AICve = −363.02; Fig. 6A).
Figure 6.
Group-level model comparison and best fit predictions across context. A, AIC (dark) and BIC (light) scores for all single-parameter models, allowing execution boundary height (a; blue), execution drift rate (ve; green), braking drift rate (vb; red), or onset delay (tr; yellow) to vary across contexts. Three dual-parameter models were also included to test for possible benefits of allowing ve (best fitting single parameter model) to vary along with a (teal), vb (purple), or tr (dark green). Error bars indicate the 95% CI. B, Qualitative effects of context on a (top) and ve parameter estimates (bottom) in the Early and Late contexts. C, Model predicted data (lines and larger transparent circles) simulated with best fit parameters from the ve, a model, corresponding to dotted circle in A overlaid on the average empirical data for Early (cyan), Uniform (gray), and Late (purple) contexts. Error bars represent 95% CI.
To further test the relationship between execution drift rate and context, we performed another round of fits to test for possible interactions between the execution drift rate and a second free parameter, boundary height (a), braking drift rate (vb), or onset delay (tr). The AIC and BIC scores from these fits showed that a combination of boundary height and execution drift rate (ve and a) provided the best overall fit to the data (Best Fit AICa,ve = −372.26), reasonably exceeding that of the drift-only model (|AICve −AICa,ve| = 9.24) to justify the added complexity of the dual-parameter model. Figure 6C shows a qualitative assessment of the a and vE model's goodness of fit, revealing a high degree of overlap between the simulated and observed stop accuracy and RT data in both Early and Late conditions. These results suggest that there may be two targets of learning in the decision process: a strong modulation of the execution drift rate and a subtler modulation of the boundary height.
Adaptive DPM with dual-learning mechanisms
It is not clear from the preceding analysis whether error-driven changes in the drift rate and boundary height are able to capture trial-to-trial adjustments of response speed and stop accuracy as statistics of the environment are learned experientially. Here we explore how drift rate and boundary height mechanisms adapt on a trialwise basis to different sources of feedback to drive context-dependent control and decision-making.
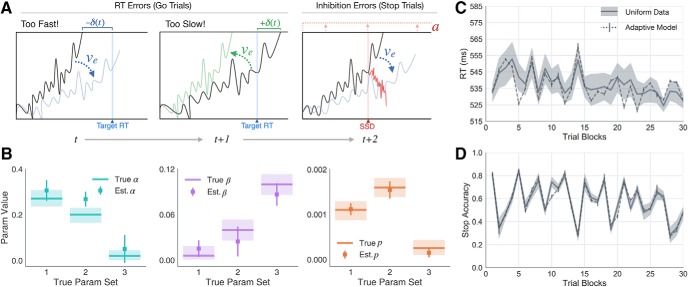
We implemented two forms of corrective learning (Fig. 7A): one targeting the execution drift rate v and another targeting the height of the execution boundary a. We hereafter denote execution drift rate as v rather than ve to avoid multiple subscripts in the adaptive model equations. On correct Go trials (Fig. 7A, left, middle), the current drift rate (vt) was updated (vt+1; Eq. 6) to reflect the signed difference between the model's RT on the current trial and the target time (TG = 520 ms), increasing the drift rate following “slow” responses (i.e., RTt > TG) and decreasing the drift rate following “fast” responses (i.e., RTt < TG). On failed Stop trials, vt was updated according to the same equation but with the error term reflecting the difference between RTt and the trial response deadline (TS = 680 ms), thus slowing the drift rate to reduce the probability of failed stops in the future. This form of RT-dependent modulation in the drift rate is motivated by recent findings demonstrating adaptation of action velocity by dopaminergic prediction error signaling in the striatum (Yttri and Dudman, 2016). In the context of the “believer-skeptic” framework (Dunovan and Verstynen, 2016), fast RT errors could reinforce the “skeptic” (i.e., indirect pathway) and suppress the “believer” (i.e., direct pathway) by decreasing dopaminergic tone in the striatum as follows:
In addition to receiving feedback about errors in action timing, subjects also received penalties for failing to suppress responses on Stop trials. In the adaptive DPM, failed stops (Fig. 7A, right) caused an increase in the boundary height (a0) according to a δ function with height βt and decayed exponentially on each subsequent trial (at{err}) until reaching its baseline value a0 or until another stop error occurred (Eq. 7) as follows:
This form of adaptation in boundary height is motivated by physiological evidence that the STN plays a critical role in setting threshold for action execution and that this relationship is modulated by error commissions (Cavanagh et al., 2014). On all correct Go trials and the first failed Stop trial, the timing errors were scaled by the same learning rate (α0). An additional parameter was included to modulate the sensitivity (π) to stop errors over time (Eq. 8), allowing the model to capture an observed decrease in the stop accuracy over time in each of context groups (Fig. 8C). According to Equation 8, π dropped exponentially over time at a rate p, acting as a scalar on αt (Eq. 9) and βt (Eq. 10) before updating values of drift rate (Eq. 6) and boundary height (Eq. 8) after a failed stop. Higher values of p led to more rapid decay of π toward zero and, thus, a more rapid desensitization to Stop trial errors as follows:
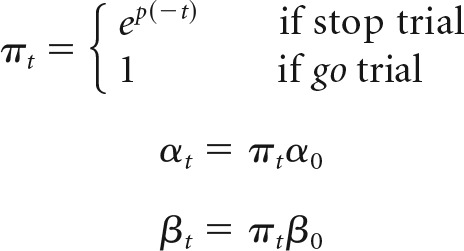 |
Figure 7.
Adaptive DPM parameter recovery and learning predictions in Uniform context. A, Schematic showing how the execution drift rate is modulated following timing errors on Go trials (left) and how the boundary height is modulated following failed inhibitions on Stop trials. B, Parameter recovery results for α (left, teal), β (middle, purple), and p (right, orange) parameters in the primary version of the adaptive DPM. Horizontal lines indicate true generative parameter means. Light colors represent the range of sampled subject-level estimates. Squares represent estimated parameter means. Error bars represent ±1 SD. Subject-averaged timeseries (dark line) and 95% CI (gray area) showing the (C) RT on Go trials and (D) accuracy on Stop trials. Each point in the timeseries (n = 30) represents the windowed average RT/accuracy over ∼30 trials. The corresponding adaptive model predictions are overlaid (dotted line), averaged over simulations to each individual subject's data.
Figure 8.
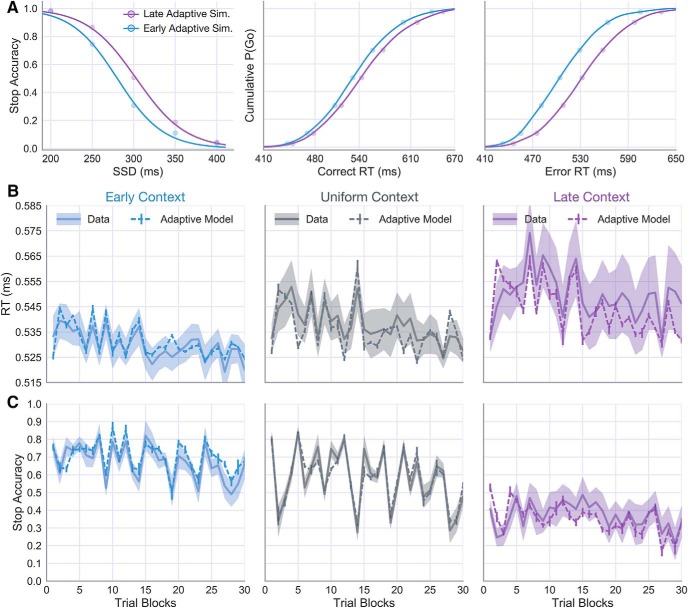
Adaptive DPM modulates behavior according to context-specific control demands. A, Average stop accuracy curves (left) and correct (middle) and error (right) RT distributions predicted by adaptive model simulations in the Early (blue) and Late (purple) contexts (initialized with the optimal parameters of the Uniform context). B, Empirical timeseries of go RTs with model predictions overlaid for Early (left), Uniform (middle), and Late (right) contexts. C, Empirical and model predicted timeseries of stop accuracy for the same conditions as in B.
Adaptive DPM parameter identifiability
Before fitting the adaptive DPM to observed subject data, we first performed a parameter recovery analysis, similar to that conducted for the static DPM, to ensure that the learning rate and decay parameters introduced in the adaptive model could be reliably identified (for procedural details, see Materials and Methods). The parameter recovery results are displayed in Figure 7B, showing the recovered estimates for α, β, and p overlaid on the true values. For all three generative parameter sets, the optimization procedure for fitting the adaptive DPM accurately recovered the true values of α, β, and p. In one case (recovery estimates of α for parameter set 2), the 95% CI of recovered parameter estimates failed to overlap with the range of generative values; however, the trend of recovered α estimates followed the trend of the true values across parameter sets 1 (highest α), 2 (medium α), and 3 (lowest α).
Adaptive fits in the uniform context
After confirming the identifiability of learning parameters in the adaptive DPM, we next sought to confirm that the trial-averaged behavior of the adaptive model was preserved after fitting the learning rates (e.g., stop accuracy curve on probe trials and RT quantiles on correct and error trials). The adaptive DPM's predictions are indeed closely aligned with the empirical statistics used to fit the static model (adaptive DPM χ2static = 0.005, static DPM χ2static = 0.011; Table 4). Although this is not necessarily surprising, it is promising to confirm that introducing feedback-dependent adaptation in the drift rate and boundary height parameters does not compromise the model's fit to trial-averaged statistics. Next, we inspected the degree to which this model captured changes in Go trial RT and Stop trial accuracy in the Uniform context. Indeed, the predicted time course of both behavioral measures showed a high degree of correspondence with the observed behavioral patterns (Fig. 7C,D). These qualitative fits show that it is indeed possible to capture feedback-dependent changes in RT and stop accuracy with the specific types of error learning in ve (Eq. 6) and a (Eq. 7) parameters. Without an alternative model with which to compare, however, it is impossible to conclude anything about the specificity of these particular learning rules (e.g., the hypothesized dependencies of ve and a on timing and control errors, respectively). Therefore, we compared the fits afforded by the primary version of the adaptive DPM with an alternative version in which a was modulated by timing errors and ve was modulated by failed stops. In the alternative version of the model, Equation 6 becomes at+1 = at · , increasing and decreasing a following fast (RTt < 520 ms) and slow (RTt > 520 ms) responses on Go trials, and increasing a on failed Stop trials in proportion to the speed of response speed. Additionally, Equation 7 becomes υterr = υ0 − βte−terr, slowing ve by a magnitude of βt. Indeed, this alternate version of the adaptive model afforded an improvement over the static model fits to trial-averaged statistics (adaptive DPMalt χ2static = 0.007, static model χ2static = 0.011; Table 4); however, compared with the adaptive DPM in which ve was modulated by timing errors and a was increased following failed stops (χ2adapt = 0.235, AIC = −326.4, BIC = −320.1), fits of the alternative adaptive model (χ2adapt = 0.861, AIC = −248.6, BIC = −242.3) provided a worse fit to feedback-dependent changes in RT and stop accuracy over time in the Uniform context (Table 4).
Table 4.
Adaptive dependent process model fit statistics
| Model version | α | β | p | χ2adapt (static) | AICadapt (static) | BICadapt (static) |
|---|---|---|---|---|---|---|
| Primary | 0.309 | 0.032 | 0.002 | 0.235 (0.005) | −326.4 (−198.6) | −320.1 (−195.1) |
| Alternative | 0.005 | 0.199 | 0.004 | 0.861 (0.007) | −248.6 (−189.1) | −242.3 (−185.5) |
Adaptive predictions in early and late contexts
Consistent with our original hypotheses, fits of the primary version of the adaptive DPM to behavior in the Uniform context highlight two possible mechanisms for acquiring the prior on the SSD: adaptive modulation of response speed by the drift rate and cautionary increases in boundary height following control errors. To confirm that these mechanisms work together to adaptively learn based only on the statistics of previous input signals, we took the average parameter scheme from the Uniform context fits and simulated each subject in the Early and Late contexts. If the context-dependent changes in the RT distributions and stop accuracy are indeed a reflection of the proposed learning mechanisms, then the model simulations should reveal similar RT and accuracy time courses as in the observed behavior.
Figure 8A shows the simulated stop-curve and RT distributions generated by the adaptive model based on feedback in the Early and Late conditions. As in the observed data (Fig. 3A), adaptation to Early SSDs led to impaired stopping accuracy, but faster RTs relative to simulated predictions in the Late condition. In Figure 8B, C, the middle panels show the same trial-binned RT and stop accuracy means as in Figure 7C, D (Uniform condition), flanked by corresponding time courses from simulations to Early (left) and Late (right) conditions. The adaptive model predictions show a high degree of flexibility, conforming to idiosyncratic changes in the trialwise behavioral dynamics within each context SSD condition. For instance, the RTs in the Early condition exhibit a relatively minor and gradual decay over the course of the experiment (Fig. 8B, left), contrasting markedly from the early increase and general volatility of RTs in the Late condition (Fig. 8B, right). The adaptive DPM largely captures both patterns, underscoring feedback-driven adaptation in the drift rate as a powerful and flexible tool for commanding inhibitory control across a variety of settings. In addition to predicting group differences in the time course of RTs, the simulations in Figure 8C show a striking degree of precision in the model-estimated changes in stop accuracy, both over time and between groups.
Because the static model fits revealed marginal evidence for the drift-only model (Fig. 6A), we next asked whether this simpler model was able to account for the learning-related behavioral changes with the same precision as the dual-learning (i.e., drift and boundary) model. To test this hypothesis, we ran simulations in which the boundary learning rate was set to zero, thereby leaving only the drift rate free to vary in response to feedback. Figure 9A shows the error between observed and model-predicted estimates for each of the behavioral measures in Figure 3 (e.g., RT, stop accuracy, and posterror slowing) based on 20 simulations of the drift-only and dual-learning models. Compared with the drift-only model, the dual-learning model showed no significant benefits in terms of fit to the trialwise RT (t(24) = 1.09, p = 0.28) or accuracy (t(24) = 0.23, p = 0.82) but showed a marked improvement in the fit to posterror slowing (t(24) = −6.91, p < 0.00001) (Fig. 9A). Importantly, the interaction of drift rate and boundary adaptation in the dual-learning model not only reduced the error in the model fit, but recovered the same qualitative pattern of posterror slowing across contexts observed in the data (Fig. 9B). In contrast, the drift-only model predicted the largest posterror slowing effect in the Early condition (Fig. 9B, left). This is particularly revealing because no information about the observed posterror slowing was included in the adaptive cost function when fitting the learning-rate parameters. Collectively, these results suggest that goal-directed tuning of movement timing (i.e., RT) and control (i.e., stop accuracy) is best described by feedback-driven changes in the drift rate and boundary-height parameters of accumulation-to-bound decisions.
Figure 9.
Utility of including boundary adaptation compared with drift-only model. A, Relative error of simulated compared with observed RT, accuracy, and posterror slowing on probe trial measures based on 20 simulated datasets for the drift-only and drift and bound adaptive models. Posterror slowing in each context condition as predicted by the (B) drift-only and (C) drift and bound models. For comparison with patterns observed in empirical data, see Figure 3C. Error bars indicate the 95% CI around the mean.
Discussion
Here we demonstrate the existence of two separable, yet interacting, learning mechanisms for inhibitory control that allow for adapting to statistical regularities in environmental signals. Adaptation to errors in the timing of action execution was mediated by adjustments in the drift rate that progressively improved the precision of RTs with respect to the target RT. Inhibition errors (i.e., executed responses on trials requiring a stop) had a posterror slowing effect, mediated by an increase in the execution threshold that decayed over subsequent trials (Fischer et al., 2018). These two mechanisms allowed for principled, context-specific adjustments in behavioral control to conflicting sources of task error (i.e., go timing and stop accuracy). Relative to the Uniform condition, subjects in the Early condition exhibited faster RTs at the expense of accuracy on probe Stop trials (Fig. 3B). Subjects in the Early condition benefited from predictably short SSDs, making it easier to reactively cancel actions on Stop trials without sacrificing the precision of Go trial RTs. In contrast, subjects in the Late condition slowed their RT on Go trials to accommodate the higher probability of a stop cue late in the trial. Thus, due to incurring more stop errors, subjects in the Late context delayed responding on Go trials to improve inhibition accuracy. This principled adaptation in both action timing and inhibition was best described by an adaptive version of the DPM in the current study, linking different kinds of task-relevant feedback signals to adaptation in dissociable control parameters.
These findings shed a critical light on the nature of inhibitory control processes measured using accumulation-to-bound models. In standard accumulation-to-bound models of decision-making, the drift rate and boundary height parameters are functionally dissociated as representing the strength of evidence and response caution, respectively (Brown and Heathcote, 2008; Ratcliff et al., 2016). This dissociation, however, is only useful insofar as evidence is clearly defined and can be manipulated independently of the additional factors bearing on behavior (e.g., caution, expectation, attention). With the exception of perceptual decision-making tasks (Roitman and Shadlen, 2002), where evidence can be interpreted with respect to the strength of sensory information provided by the stimulus, it is often unclear which sources of information should be treated as evidence in the deliberation process and which are used to set the boundary height. Understanding which learning signals these parameters rely on provides critical insights into the sources of information that drive the different decision parameters.
At the computational level, the drift rate parameter reflects the log-likelihood ratio of evidence for alternative hypotheses. In the context of the current task, the execution drift rate can be interpreted as representing the relative evidence for go and no-go decisions encoded by the circuit-level competition between the direct and indirect pathways (Bahuguna et al., 2015). Indeed, studies combining behavioral modeling with single-unit recordings (Ding and Gold, 2010), optogenetics in animals (Yttri and Dudman, 2016), and neuroimaging in humans (van Maanen et al., 2016) have found reliable links between behaviorally derived estimates of drift rate and activity in the striatum (Brody and Hanks, 2016). Crucially, the dynamics of competition between direct and indirect pathways are sensitive to dopaminergic signals that provide important feedback about the environmental consequences of recent actions to drive behavior in the direction of the agent's current goal (Kravitz et al., 2012; Shan et al., 2014; Cox et al., 2015; Vicente et al., 2016). Feedback-dependent reweighting of corticostriatal connections has primarily been studied in the context of action-value learning; however, new evidence suggests a more nuanced role in tuning task-relevant movement parameters (Rueda-Orozco and Robbe, 2015; Dudman and Krakauer, 2016; Yttri and Dudman, 2016). Yttri and Dudman (2016) demonstrated this by stimulating direct or indirect pathway neurons in the mouse striatum based on the velocity of a recently executed lever press and measuring the effects on future movements. Similar to the opponent effects of dopaminergic error signals that mediate action-value associations (Kravitz et al., 2012; Collins and Frank, 2014), they found that stimulation of the direct pathway following high-velocity presses further increased the velocity of future movements, whereas stimulation of indirect pathway neurons decreased velocity. While the current study was not concerned with action velocity per se, the adaptation of the drift rate parameter to errors in action timing resembles a similar behavioral dynamic to that observed by Yttri and Dudman (2016). Indeed, a recent study by Soares et al. (2016) found that dopaminergic neurons in the mouse midbrain were not only necessary for accurate temporal perception but that the perception of time could be systematically sped up or slowed down through optogenetic suppression and stimulation of these neurons. Future studies will be needed to confirm the proposed dependency of the drift rate on striatum in which model fits to behavior are performed in the presence of dopaminergic weighting at direct and indirect synapses.
Based on previous evidence that proactive control is mediated by the striatum (Majid et al., 2013; Pas et al., 2017), we have argued that the feedback-dependent modulation of execution drift rate is, at least in part, dopaminergic modulation of the competition between the direct and indirect pathways (Dunovan and Verstynen, 2016). In addition to the dopamine hypothesis, an alternative possibility is that adaptation of the drift rate stems from top-down changes in the background excitability of the striatum, driven by diffuse inputs from premotor regions, such as supplementary motor area and pre-supplementary motor area (Forstmann et al., 2008; Murakami et al., 2014, 2017; van Maanen et al., 2016). It remains unclear what functional differences may exist between premotor and dopaminergic representations of time or how they might differentially influence the encoding of action timing within the striatum. Integrating the behavioral and modeling techniques defined here with electrophysiological and optogenetic manipulations can better distinguish the nature of the training signal that modulates striatal activity during action control.
Outside of the striatum, recent links have been identified between activity fluctuations in the STN and adaptive changes in behavior (Cavanagh et al., 2014; Herz et al., 2016; Wessel et al., 2016; Justin Rossi et al., 2017), raising new and interesting questions about the extent to which striatal and subthalamic learning signals independently influence behavior and how they might interact (Tewari et al., 2016). Numerous studies have implicated the STN in setting the height of the decision threshold (Cavanagh et al., 2011; Ratcliff and Frank, 2012; Frank et al., 2015; Herz et al., 2016, 2017; Zavala et al., 2016), controlled by diffuse excitatory inputs to the output nucleus of the BG and further suppressing motor thalamus to delay action execution. Due to the monosynaptic connections between cortex and the STN that make up the hyperdirect pathway (Nambu et al., 2002), unexpected sensory events (e.g., stop signals) can be quickly relayed through the STN to raise the decision threshold for ongoing action plans to prevent execution (Wiecki and Frank, 2013; Wessel and Aron, 2017). In addition to this rapid cortically mediated form of adaptation, evidence suggests that strategic adjustments in decision threshold are achieved by more gradual forms of plasticity in the indirect pathway (Wei et al., 2015; Schechtman et al., 2016). In the current study, adaptive changes in the boundary height accounted for the observed posterror slowing in responses following failed Stop trials, motivated by neuroimaging and electrophysiological evidence of STN-mediated slowing of responses (Cavanagh et al., 2014; Frank et al., 2015; Herz et al., 2016). For simplicity, boundary adaption was restricted to being unidirectional, increasing after a stop error and decaying back to, but never below, its original value. However, some evidence suggests that STN exerts bidirectional control over decision threshold, capable of promoting the adoption of both speed and accuracy policies (Herz et al., 2017). Thus, relating the adaptive threshold in the DPM to recordings in the STN will likely require a more nuanced approach to generalize beyond the current task. Future studies will be needed to examine how these BG-mediated adaptation mechanisms are recruited to modify behavior, the relevant task dimensions they are sensitive to, and the extent to which they differ from cortical sources of feedback learning (Purcell and Kiani, 2016).
Considered in the context of the emerging literature on BG pathways, the current study highlights two distinct feedback-dependent learning mechanisms: (1) a gradual tuning of the execution drift rate that corrects for timing errors; and (2) a cautionary increase in the execution threshold following failed action inhibition. While cognitive models, such as the adaptive DPM, are unable to capture the complexity of neural information processing that underlies adaptive action control, they do provide a rich description of the component operations, helping to guide study design and interpretation in experimental neuroscience. Using a straightforward hybridization of accumulation-to-bound dynamics and reinforcement learning, the current study provides evidence for a dual-mechanism account of feedback-dependent learning in inhibitory control.
Footnotes
This work was supported in part by National Science Foundation Career Award 1351748 and Army Research Laboratory Cooperative Agreement W911NF-10-2-0022. The views and conclusions contained in this document are those of the authors and should not be interpreted as representing the official policies, either expressed or implied, of the Army Research Laboratory or the U.S. government. We thank Patrick Beukema and Kevin Jarbo for helpful comments on drafts of this manuscript; and Leo Scholl and Tara Molesworth for assistance with data collection.
The authors declare no competing financial interests.
References
- Bahuguna et al., 2015. Bahuguna J, Aertsen A, Kumar A (2015) Existence and control of Go/No-Go decision transition threshold in the striatum. PLoS Comput Biol 11:e1004233. 10.1371/journal.pcbi.1004233 [DOI] [PMC free article] [PubMed] [Google Scholar]
- Bariselli et al., 2018. Bariselli S, Fobbs WC, Creed MC, Kravitz AV (2018) A competitive model for striatal action selection. Brain Res. Advance online publication. Retrieved October 6, 2018. doi: 10.1016/j.brainres.2018.10.009. 10.1016/j.brainres.2018.10.009 [DOI] [PMC free article] [PubMed] [Google Scholar]
- Bogacz and Cohen, 2004. Bogacz R, Cohen JD (2004) Parameterization of connectionist models. Behav Res Methods Instrum Comput 36:732–741. 10.3758/BF03206554 [DOI] [PubMed] [Google Scholar]
- Bogacz and Larsen, 2011. Bogacz R, Larsen T (2011) Integration of reinforcement learning and optimal decision-making theories of the basal ganglia. Neural Comput 23:817–851. 10.1162/NECO_a_00103 [DOI] [PubMed] [Google Scholar]
- Bogacz et al., 2006. Bogacz R, Brown E, Moehlis J, Holmes P, Cohen JD (2006) The physics of optimal decision making: a formal analysis of models of performance in two-alternative forced-choice tasks. Psychol Rev 113:700–765. 10.1037/0033-295X.113.4.700 [DOI] [PubMed] [Google Scholar]
- Brittain et al., 2012. Brittain JS, Watkins KE, Joundi RA, Ray NJ, Holland P, Green AL, Aziz TZ, Jenkinson N (2012) A role for the subthalamic nucleus in response inhibition during conflict. J Neurosci 32:13396–13401. 10.1523/JNEUROSCI.2259-12.2012 [DOI] [PMC free article] [PubMed] [Google Scholar]
- Brody and Hanks, 2016. Brody CD, Hanks TD (2016) Neural underpinnings of the evidence accumulator. Curr Opin Neurobiol 37:149–157. 10.1016/j.conb.2016.01.003 [DOI] [PMC free article] [PubMed] [Google Scholar]
- Brown and Heathcote, 2008. Brown SD, Heathcote A (2008) The simplest complete model of choice response time: linear ballistic accumulation. Cogn Psychol 57:153–178. 10.1016/j.cogpsych.2007.12.002 [DOI] [PubMed] [Google Scholar]
- Cavanagh et al., 2011. Cavanagh JF, Wiecki TV, Cohen MX, Figueroa CM, Samanta J, Sherman SJ, Frank MJ (2011) Subthalamic nucleus stimulation reverses mediofrontal influence over decision threshold. Nat Neurosci 14:1462–1467. 10.1038/nn.2925 [DOI] [PMC free article] [PubMed] [Google Scholar]
- Cavanagh et al., 2014. Cavanagh JF, Sanguinetti JL, Allen JJ, Sherman SJ, Frank MJ (2014) The subthalamic nucleus contributes to posterror slowing. J Cogn Neurosci 26:2637–2644. 10.1162/jocn_a_00659 [DOI] [PubMed] [Google Scholar]
- Collins and Frank, 2014. Collins AG, Frank MJ (2014) Opponent actor learning (OpAL): modeling interactive effects of striatal dopamine on reinforcement learning and choice incentive. Psychol Rev 121:337–366. 10.1037/a0037015 [DOI] [PubMed] [Google Scholar]
- Cox et al., 2015. Cox SM, Frank MJ, Larcher K, Fellows LK, Clark CA, Leyton M, Dagher A (2015) Striatal D1 and D2 signaling differentially predict learning from positive and negative outcomes. Neuroimage 109:95–101. 10.1016/j.neuroimage.2014.12.070 [DOI] [PubMed] [Google Scholar]
- Ding and Gold, 2010. Ding L, Gold JI (2010) Caudate encodes multiple computations for perceptual decisions. J Neurosci 30:15747–15759. 10.1523/JNEUROSCI.2894-10.2010 [DOI] [PMC free article] [PubMed] [Google Scholar]
- Dudman and Krakauer, 2016. Dudman JT, Krakauer JW (2016) The basal ganglia: from motor commands to the control of vigor. Curr Opin Neurobiol 37:158–166. 10.1016/j.conb.2016.02.005 [DOI] [PubMed] [Google Scholar]
- Dunovan and Verstynen, 2016. Dunovan K, Verstynen T (2016) Believer-skeptic meets actor-critic: rethinking the role of basal ganglia pathways during decision-making and reinforcement learning. Front Neurosci 10:106. 10.3389/fnins.2016.00106 [DOI] [PMC free article] [PubMed] [Google Scholar]
- Dunovan et al., 2015. Dunovan K, Lynch B, Molesworth T, Verstynen T (2015) Competing basal-ganglia pathways determine the difference between stopping and deciding not to go. Elife 4:e08723. 10.7554/eLife.08723 [DOI] [PMC free article] [PubMed] [Google Scholar]
- Fischer et al., 2018. Fischer AG, Nigbur R, Klein TA, Danielmeier C, Ullsperger M (2018) Cortical beta power reflects decision dynamics and uncovers multiple facets of posterror adaptation. Nat Commun 9:5038. 10.1038/s41467-018-07456-8 [DOI] [PMC free article] [PubMed] [Google Scholar]
- Forstmann et al., 2008. Forstmann BU, Dutilh G, Brown S, Neumann J, von Cramon DY, Ridderinkhof KR, Wagenmakers EJ (2008) Striatum and pre-SMA facilitate decision-making under time pressure. Proc Natl Acad Sci U S A 105:17538–17542. 10.1073/pnas.0805903105 [DOI] [PMC free article] [PubMed] [Google Scholar]
- Frank and Badre, 2012. Frank MJ, Badre D (2012) Mechanisms of hierarchical reinforcement learning in corticostriatal circuits: 1. Computational analysis. Cereb Cortex 22:509–526. 10.1093/cercor/bhr114 [DOI] [PMC free article] [PubMed] [Google Scholar]
- Frank et al., 2015. Frank MJ, Gagne C, Nyhus E, Masters S, Wiecki TV, Cavanagh JF, Badre D (2015) fMRI and EEG predictors of dynamic decision parameters during human reinforcement learning. J Neurosci 35:485–494. 10.1523/JNEUROSCI.2036-14.2015 [DOI] [PMC free article] [PubMed] [Google Scholar]
- Herz et al., 2016. Herz DM, Zavala BA, Bogacz R, Brown P (2016) Neural correlates of decision thresholds in the human subthalamic nucleus. Curr Biol 26:916–920. 10.1016/j.cub.2016.01.051 [DOI] [PMC free article] [PubMed] [Google Scholar]
- Herz et al., 2017. Herz DM, Tan H, Brittain JS, Fischer P, Cheeran B, Green AL, FitzGerald J, Aziz TZ, Ashkan K, Little S, Foltynie T, Limousin P, Zrinzo L, Bogacz R, Brown P (2017) Distinct mechanisms mediate speed-accuracy adjustments in cortico-subthalamic networks. Elife 6:21481. 10.7554/eLife.21481 [DOI] [PMC free article] [PubMed] [Google Scholar]
- Justin Rossi et al., 2017. Justin Rossi P, Peden C, Castellanos O, Foote KD, Gunduz A, Okun MS (2017) The human subthalamic nucleus and globus pallidus internus differentially encode reward during action control. Hum Brain Mapp 38:1952–1964. 10.1002/hbm.23496 [DOI] [PMC free article] [PubMed] [Google Scholar]
- Kravitz et al., 2012. Kravitz AV, Tye LD, Kreitzer AC (2012) Distinct roles for direct and indirect pathway striatal neurons in reinforcement. Nat Neurosci 15:816–818. 10.1038/nn.3100 [DOI] [PMC free article] [PubMed] [Google Scholar]
- Majid et al., 2013. Majid DS, Cai W, Corey-Bloom J, Aron AR (2013) Proactive selective response suppression is implemented via the basal ganglia. J Neurosci 33:13259–13269. 10.1523/JNEUROSCI.5651-12.2013 [DOI] [PMC free article] [PubMed] [Google Scholar]
- Maritz and Jarrett, 1978. Maritz JS, Jarrett RG (1978) A Note on Estimating the Variance of the Sample Median. Journal of the American Statistical Association 73:194–196. 10.2307/2286545 [DOI] [Google Scholar]
- Miletić et al., 2017. Miletić S, Turner BM, Forstmann BU, van Maanen L (2017) Parameter recovery for the leaky competing accumulator model. J Math Psychol 76:25–50. 10.1016/j.jmp.2016.12.001 [DOI] [Google Scholar]
- Murakami et al., 2014. Murakami M, Vicente MI, Costa GM, Mainen ZF (2014) Neural antecedents of self-initiated actions in secondary motor cortex. Nat Neurosci 17:1574–1582. 10.1038/nn.3826 [DOI] [PubMed] [Google Scholar]
- Murakami et al., 2017. Murakami M, Shteingart H, Loewenstein Y, Mainen ZF (2017) Distinct sources of deterministic and stochastic components of action timing decisions in rodent frontal cortex. Neuron 94:908–919.e7. 10.1016/j.neuron.2017.04.040 [DOI] [PubMed] [Google Scholar]
- Nambu et al., 2002. Nambu A, Tokuno H, Takada M (2002) Functional significance of the cortico-subthalamo-pallidal “hyperdirect” pathway. Neurosci Res 43:111–117. 10.1016/S0168-0102(02)00027-5 [DOI] [PubMed] [Google Scholar]
- Nelder and Mead, 1965. Nelder JA, Mead R (1965) A simplex method for function minimization. The computer journal 7:308–313. 10.1093/comjnl/7.4.308 [DOI] [Google Scholar]
- Pas et al., 2017. Pas P, van den Munkhof HE, du Plessis S, Vink M (2017) Striatal activity during reactive inhibition is related to the expectation of stop signals. Neuroscience 361:192–198. 10.1016/j.neuroscience.2017.08.037 [DOI] [PubMed] [Google Scholar]
- Pedersen et al., 2017. Pedersen ML, Frank MJ, Biele G (2017) The drift diffusion model as the choice rule in reinforcement learning. Psychon Bull Rev 24:1234–1251. 10.3758/s13423-016-1199-y [DOI] [PMC free article] [PubMed] [Google Scholar]
- Purcell and Kiani, 2016. Purcell BA, Kiani R (2016) Neural mechanisms of posterror adjustments of decision policy in parietal cortex. Neuron 89:658–671. 10.1016/j.neuron.2015.12.027 [DOI] [PMC free article] [PubMed] [Google Scholar]
- Ratcliff and Frank, 2012. Ratcliff R, Frank MJ (2012) Reinforcement-based decision making in corticostriatal circuits: mutual constraints by neurocomputational and diffusion models. Neural Comput 24:1186–1229. 10.1162/NECO_a_00270 [DOI] [PubMed] [Google Scholar]
- Ratcliff and Tuerlinckx, 2002. Ratcliff R, Tuerlinckx F (2002) Estimating parameters of the diffusion model: approaches to dealing with contaminant reaction times and parameter variability. Psychon Bull Rev 9:438–481. 10.3758/BF03196302 [DOI] [PMC free article] [PubMed] [Google Scholar]
- Ratcliff et al., 2016. Ratcliff R, Smith PL, Brown SD, McKoon G (2016) Diffusion decision model: current issues and history. Trends Cogn Sci 20:260–281. 10.1016/j.tics.2016.01.007 [DOI] [PMC free article] [PubMed] [Google Scholar]
- Roitman and Shadlen, 2002. Roitman JD, Shadlen MN (2002) Response of neurons in the lateral intraparietal area during a combined visual discrimination reaction time task. J Neurosci 22:9475–9489. 10.1523/JNEUROSCI.22-21-09475.2002 [DOI] [PMC free article] [PubMed] [Google Scholar]
- Rueda-Orozco and Robbe, 2015. Rueda-Orozco PE, Robbe D (2015) The striatum multiplexes contextual and kinematic information to constrain motor habits execution. Nat Neurosci 18:453–460. 10.1038/nn.3924 [DOI] [PMC free article] [PubMed] [Google Scholar]
- Schall et al., 2017. Schall JD, Palmeri TJ, Logan GD (2017) Models of inhibitory control. Philos Trans R Soc Lond B Biol Sci 372:20160193. 10.1098/rstb.2016.0193 [DOI] [PMC free article] [PubMed] [Google Scholar]
- Schechtman et al., 2016. Schechtman E, Noblejas MI, Mizrahi AD, Dauber O, Bergman H (2016) Pallidal spiking activity reflects learning dynamics and predicts performance. Proc Natl Acad Sci U S A 113:E6281–E6289. 10.1073/pnas.1612392113 [DOI] [PMC free article] [PubMed] [Google Scholar]
- Schmidt et al., 2013. Schmidt R, Leventhal DK, Mallet N, Chen F, Berke JD (2013) Canceling actions involves a race between basal ganglia pathways. Nat Neurosci 16:1118–1124. 10.1038/nn.3456 [DOI] [PMC free article] [PubMed] [Google Scholar]
- Shan et al., 2014. Shan Q, Ge M, Christie MJ, Balleine BW (2014) The acquisition of goal-directed actions generates opposing plasticity in direct and indirect pathways in dorsomedial striatum. J Neurosci 34:9196–9201. 10.1523/JNEUROSCI.0313-14.2014 [DOI] [PMC free article] [PubMed] [Google Scholar]
- Shenoy and Yu, 2011. Shenoy P, Yu AJ (2011) Rational decision-making in inhibitory control. Front Hum Neurosci 5:48. 10.3389/fnhum.2011.00048 [DOI] [PMC free article] [PubMed] [Google Scholar]
- Soares et al., 2016. Soares S, Atallah BV, Paton JJ (2016) Midbrain dopamine neurons control judgment of time. Science 354:1273–1277. 10.1126/science.aah5234 [DOI] [PubMed] [Google Scholar]
- Sutton and Barto, 1998. Sutton RS, Barto AG (1998) Introduction to reinforcement learning. Cambridge, MA: Massachusetts Institute of Technology. [Google Scholar]
- Tewari et al., 2016. Tewari A, Jog R, Jog MS (2016) The striatum and subthalamic nucleus as independent and collaborative structures in motor control. Front Syst Neurosci 10:17. 10.3389/fnsys.2016.00017 [DOI] [PMC free article] [PubMed] [Google Scholar]
- van Maanen et al., 2016. van Maanen L, Fontanesi L, Hawkins GE, Forstmann BU (2016) Striatal activation reflects urgency in perceptual decision making. Neuroimage 139:294–303. 10.1016/j.neuroimage.2016.06.045 [DOI] [PubMed] [Google Scholar]
- van Ravenzwaaij and Oberauer, 2009. van Ravenzwaaij D, Oberauer K (2009) How to use the diffusion model: parameter recovery of three methods: EZ, fast-dm, and DMAT. J Math Psychol 53:463–473. 10.1016/j.jmp.2009.09.004 [DOI] [Google Scholar]
- Verbruggen and Logan, 2009. Verbruggen F, Logan GD (2009) Models of response inhibition in the stop signal and stop-change paradigms. Neurosci Biobehav Rev 33:647–661. 10.1016/j.neubiorev.2008.08.014 [DOI] [PMC free article] [PubMed] [Google Scholar]
- Verstynen and Sabes, 2011. Verstynen T, Sabes PN (2011) How each movement changes the next: an experimental and theoretical study of fast adaptive priors in reaching. J Neurosci 31:10050–10059. 10.1523/JNEUROSCI.6525-10.2011 [DOI] [PMC free article] [PubMed] [Google Scholar]
- Vicente et al., 2016. Vicente AM, Galvão-Ferreira P, Tecuapetla F, Costa RM (2016) Direct and indirect dorsolateral striatum pathways reinforce different action strategies. Curr Biol 26:R267–R269. 10.1016/j.cub.2016.02.036 [DOI] [PMC free article] [PubMed] [Google Scholar]
- Visser and Poessé, 2017. Visser I, Poessé R (2017) Parameter recovery, bias and standard errors in the linear ballistic accumulator model. Br J Math Stat Psychol 70:280–296. 10.1111/bmsp.12100 [DOI] [PubMed] [Google Scholar]
- Wales and Doye, 1997. Wales D, Doye JP (1997) Global optimization by basin-hopping and the lowest energy structures of Lennard-Jones clusters containing up to 110 atoms. J Phys Chem A 101:5111–5116. 10.1021/jp970984n [DOI] [Google Scholar]
- Wei and Wang, 2016. Wei W, Wang XJ (2016) Inhibitory control in the cortico-basal ganglia-thalamocortical loop: complex regulation and interplay with memory and decision processes. Neuron 92:1093–1105. 10.1016/j.neuron.2016.10.031 [DOI] [PMC free article] [PubMed] [Google Scholar]
- Wei et al., 2015. Wei W, Rubin JE, Wang XJ (2015) Role of the indirect pathway of the basal ganglia in perceptual decision making. J Neurosci 35:4052–4064. 10.1523/JNEUROSCI.3611-14.2015 [DOI] [PMC free article] [PubMed] [Google Scholar]
- Wessel and Aron, 2017. Wessel JR, Aron AR (2017) On the globality of motor suppression: unexpected events and their influence on behavior and cognition. Neuron 93:259–280. 10.1016/j.neuron.2016.12.013 [DOI] [PMC free article] [PubMed] [Google Scholar]
- Wessel et al., 2016. Wessel JR, Jenkinson N, Brittain JS, Voets SH, Aziz TZ, Aron AR (2016) Surprise disrupts cognition via a fronto-basal ganglia suppressive mechanism. Nat Commun 7:11195. 10.1038/ncomms11195 [DOI] [PMC free article] [PubMed] [Google Scholar]
- White et al., 2018. White CN, Servant M, Logan GD (2018) Testing the validity of conflict drift-diffusion models for use in estimating cognitive processes: a parameter-recovery study. Psychon Bull Rev 25:286–301. 10.3758/s13423-017-1271-2 [DOI] [PMC free article] [PubMed] [Google Scholar]
- Wiecki and Frank, 2013. Wiecki TV, Frank MJ (2013) A computational model of inhibitory control in frontal cortex and basal ganglia. Psychol Rev 120:329–355. 10.1037/a0031542 [DOI] [PubMed] [Google Scholar]
- Wu et al., 2002. Wu S, Amari S, Nakahara H (2002) Population coding and decoding in a neural field: a computational study. Neural Comput 14:999–1026. 10.1162/089976602753633367 [DOI] [PubMed] [Google Scholar]
- Yttri and Dudman, 2016. Yttri EA, Dudman JT (2016) Opponent and bidirectional control of movement velocity in the basal ganglia. Nature 533:402–406. 10.1038/nature17639 [DOI] [PMC free article] [PubMed] [Google Scholar]
- Zavala et al., 2016. Zavala B, Tan H, Little S, Ashkan K, Green AL, Aziz T, Foltynie T, Zrinzo L, Zaghloul K, Brown P (2016) Decisions made with less evidence involve higher levels of corticosubthalamic nucleus theta band synchrony. J Cogn Neurosci 28:811–825. 10.1162/jocn_a_00934 [DOI] [PMC free article] [PubMed] [Google Scholar]


