

Abstract
The regulated turnover of synaptic vesicle (SV) proteins is thought to involve the ubiquitin-dependent tagging and degradation through endo-lysosomal and autophagy pathways. Yet, it remains unclear which of these pathways are used, when they become activated, and whether SVs are cleared en masse together with SV proteins or whether both are degraded selectively. Equally puzzling is how quickly these systems can be activated and whether they function in real-time to support synaptic health. To address these questions, we have developed an imaging-based system that simultaneously tags presynaptic proteins while monitoring autophagy. Moreover, by tagging SV proteins with a light-activated ROS generator, Supernova, it was possible to temporally control the damage to specific SV proteins and assess their consequence to autophagy-mediated clearance mechanisms and synaptic function. Our results show that, in mouse hippocampal neurons of either sex, presynaptic autophagy can be induced in as little as 5–10 min and eliminates primarily the damaged protein rather than the SV en masse. Importantly, we also find that autophagy is essential for synaptic function, as light-activated damage to, for example, Synaptophysin only compromises synaptic function when autophagy is simultaneously blocked. These data support the concept that presynaptic boutons have a robust highly regulated clearance system to maintain not only synapse integrity, but also synaptic function.
SIGNIFICANCE STATEMENT The real-time surveillance and clearance of synaptic proteins are thought to be vital to the health, functionality, and integrity of vertebrate synapses and are compromised in neurodegenerative disorders, yet the fundamental mechanisms regulating these systems remain enigmatic. Our analysis reveals that presynaptic autophagy is a critical part of a real-time clearance system at synapses capable of responding to local damage of synaptic vesicle proteins within minutes and to be critical for the ongoing functionality of these synapses. These data indicate that synapse autophagy is not only locally regulated but also crucial for the health and functionality of vertebrate presynaptic boutons.
Keywords: autophagy, free radical, presynapse, protein inactivation, supernova
Introduction
The integrity of vertebrate synapses requires robust cellular programs that monitor the activity states of thousands of proteins, eliminating those that are misfolded or damaged. Failure of these programs can lead to the accumulation of nonfunctional proteins that reduce the efficiency of synaptic transmission and promote neurodegeneration (Waites et al., 2013; Vijayan and Verstreken, 2017; Liang and Sigrist, 2018). Neurons are endowed with several surveillance and clearance systems. These include a ubiquitin-based tagging system that conjugates ubiquitin chains to damaged proteins, as well as several degradative systems that, for example, eliminate soluble proteins via the proteasome or integral membrane proteins and protein aggregates via the endo-lysosomal and/or autophagy systems (Wang et al., 2017).
Given their distance from the cell soma and high metabolic demand, synapses poise a significant challenge to neurons, as they have to maintain and ensure a stable functional pool of proteins (Tammineni et al., 2017). How might this be achieved? Emerging data indicate that synapses use their own local machinery to eliminate proteins (e.g., in response to changes in synaptic activity or homeostatic plasticity) (Vijayan and Verstreken, 2017). For example, the ESCRT machinery facilitates via Rab35 the elimination of subsets of synaptic vesicle (SV) proteins in response to changes in synaptic activity (Sheehan et al., 2016). Moreover, specific E3 ubiquitin ligases have been associated with the selective removal of key regulators of synaptic transmission, such as RIM1 (Yao et al., 2007) and Munc13 by the proteasome (Yi and Ehlers, 2005; Jiang et al., 2010). Intriguingly, two active zone proteins, Piccolo and Bassoon, have also been identified as regulators of presynaptic proteostasis, as their inactivation leads to the loss of SVs and disintegration of synaptic junctions through the activation of E3 ligases (Waites et al., 2013) and autophagy (Okerlund et al., 2017).
Although these clearance systems are anticipated to ensure functionality of synaptic proteins, it remains unclear whether some are specialized in the removal of only subsets of synaptic proteins. A growing number of studies point to the importance of autophagy not only in maintaining mitochondrial health, but also the clearance of aggregated proteins (Vijayan and Verstreken, 2017). Interestingly, in Alzheimer's disease brains, an upregulation of autophagy has been observed (Nixon et al., 2005; Boland et al., 2008; Lee et al., 2010); however, in other diseases characterized by aggregate-prone proteins, such as Parkinson's and Huntington's disease, autophagy is not engaged (Spencer et al., 2009; Martinez-Vicente et al., 2010; Rubinsztein et al., 2012; Nixon, 2013), which might contribute to the accumulation of protein aggregates and subsequent reduced neuronal survival (Yue et al., 2009; Ebrahimi-Fakhari et al., 2011; Nixon, 2013). This latter concept is supported by the analysis of Atg5 or Atg7 KO mice, two essential autophagy-related proteins, which exhibit hallmarks of neurodegeneration (Hara et al., 2006; Komatsu et al., 2006). Defining the role of degradative systems during health and disease requires a better understanding of when and where each is turned on and which subsets of proteins they eliminate. For example, those critical for the real-time maintenance of synaptic function should be locally regulated and operating on a second to minute time scale, whereas those responding to chronic damage may act on longer time scales, such as hours. To address these fundamental questions, we have developed a strategy to selectively damage SV proteins within presynaptic boutons. This was accomplished by tethering the light-activated free ROS generator Supernova (SN) (Takemoto et al., 2013) to different SV proteins, allowing the local light-activated ROS-mediated damage of SV proteins with a half-radius of photo-damage as small as 3–4 nm (Takemoto et al., 2013).
This manipulation was found to rapidly and selectively induce presynaptic autophagy within 5 min and lead primarily to the elimination of damaged proteins and not SV proteins en masse. Moreover, the selective damage of SV proteins allowed us to show that presynaptic autophagy is critical for the real-time maintenance of synaptic transmission.
Materials and Methods
Construction of vectors.
Monitoring of autophagy within presynaptic boutons was achieved by creating a set of lentiviral expression vectors. All vectors are based on the commercially available vector FUGW (plasmid #14883, Addgene). To coexpress mCherry-tagged Synaptophysin (Syp) and eGFP-LC3, Syp-mCherry (Syp, NM_012664.3) was synthesized by Eurofins Genomics with a downstream glycine linker that was fused to a self-cleaving 2A peptide (Kim et al., 2011). This element was then exchanged with GFP in the FUGW vector by ligation. Subsequently, the eGFP-LC3 (LC3, U05784.1) segment from FU-ptf-LC3 (Okerlund et al., 2017) was subcloned in frame after the P2A sequence, which resulted in the vector FU-Syp-mCherry-P2A-eGFP-LC3. This vector also served as a template for tagging Syp with SN. Here, SN was synthesized by Eurofins Genomics (SN, AB522905) (Takemoto et al., 2013) and exchanged for mCherry forming FU-Syp-SN-P2A-eGFP-LC3. For the simultaneous expression of a short hairpin RNA to knock down Atg5 transcripts, a U6 promoter-driven shRNA cassette was cloned upstream of the ubiquitin promoter. The shRNA (5′-CCA TCT GAG CTA CCC AGA TAA TTC AAG AGA TTA TCT GGG TAG CTC AGA TTT TTT TGG AA-3′) was cloned into the vector to form F-U6-shAtg5-U-Syp-SN-P2A-eGFP-LC3. A scrambled shRNA against rat Clathrin served as negative control (F-U6-scRNA(SC)-U-Syp-SN-P2A-eGFP-LC3). To express SN within the lumen of SVs, we inserted SN cDNA sequences at residue 184 in Syp (Syp-lumSN) together with a GSG linker, by Gibson assembly (Gibson et al., 2009) followed by subcloning to create FU-Syp-lumSN-P2A-eGFP-LC3). Ligation of a PCR-amplified SN transcript at the C terminus of Syp and after the downstream sequence of eGFP-LC3 generated the eGFP-LC3 empty vector FU-Syp-SN. To monitor endo-lysosomal systems, PCR-amplified Rab7 (XM_005632015.2) was exchanged with LC3 in FU-Syp-SN-P2A-eGFP-LC3 by Gibson assembly creating FU-Syp-SN-P2A-eGFP-Rab7. Lentiviral vectors expressing eGFP-LC3 and either SN tagged Synapsin (Syn) (NM_019133) or Synaptotagmin (Syt) (NM_001252341) (FU-Syn-SN-P2A-eGFP-LC3 and FU-Syt-SN-P2A-eGFP-LC3) were created by PCR amplification of Syn or Syt from plasmid DNA (Waites et al., 2013; Chang et al., 2018) before being subjected to a Gibson assembly reaction with the purified Syp-deleted FU-Syp-SN-P2A-eGFP-LC3 vector. The vector FU-eGFP-LC3 was created by exchanging GFP in the FUGW vector with the eGFP-LC3 (LC3, U05784.1) segment from FU-ptf-LC3 (Okerlund et al., 2017). All final constructs were verified by both restriction digest and sequencing.
HeLa/HEK293 cell culture and infection.
HeLa (RRID:CVCL_0030)/HEK293 (RRID:CVCL_0045) cells were maintained in DMEM complete medium (10% FCS, 1% P/S) (Thermo Fisher Scientific). Medium was exchanged every 2–4 d. HeLa/HEK293 cells were routinely passaged at 80% confluence. Cells were washed with PBS and subsequently treated with 0.05% Trypsin-EDTA (Thermo Fisher Scientific) for 1 min at 37°C. Trypsin was inhibited using DMEM complete medium; afterward, cells were detached from the flask, counted, and replated at a density of 30,000 per 1 cm2 onto glass coverslips. For the autophagy induction assays, HeLa cells were infected with lentivirus (FU-Syp-mCherry-P2A-eGFP-LC3) 24 h after plating by adding 100 μl per 6 well. Three days after infection, DMEM was exchanged to EBSS medium (Thermo Fisher Scientific) containing 100 μm chloroquine (in H2O, Sigma-Aldrich) for 2 h at 37°C, to enhance the visualization of autophagy by blocking lysosomal degradation. Control cells were left untreated.
Immunocytochemistry of HeLa cells.
Cells were fixed with 4% PFA in PBS for 4 min at room temperature and washed with PBS twice. All following steps were performed at room temperature. Cells were permeabilized by three washing steps with PBS + 0.2% Tween 20 (PBS-T) for a total of 30 min followed by incubation with PBS-T with 5% normal goat serum (blocking solution) for another 30 min. The primary antibody was diluted in blocking solution, and cells were incubated in this solution for 45 min. The following antibodies were used: primary antibodies against LC3 (RRID:AB_2274121) (1:500; rabbit; MBL International; catalog #PM036), p62 (RRID:AB_398152) (1:200; mouse; BD Bioscience; catalog #610833). Afterward, cells were washed three times in PBS-T for 10 min each. The secondary antibody, diluted in PBS-T 1:1000 (RRID:AB_141725, RRID:AB_2535813) (Thermo Fisher Scientific), was put onto the cells for 60 min and washed away twice with PBS-T and once with PBS for 10 min each. Finally, coverslips were mounted using ProLong Diamond Antifade Mountant (Thermo Fisher Scientific).
Dihydroethidium (DHE) assay.
HEK293 cells were seeded on a μ-Slide 8 Well (ibidi) culture dish with a density of 30,000 per 1 cm2 and transfected 1 d later using X-tremeGENE 9 DNA Transfection Reagent (Roche Diagnostics) according to the manufacturer's instructions. At 24–48 h after transfection, DMEM complete medium was changed and DHE was added to a final concentration of 10 μm (in DMSO, Thermo Fisher Scientific) in DMEM complete medium. Cells were incubated with DHE for 20 min at 37°C followed by two washing steps with 37°C warm PBS. Afterward, PBS was exchanged with warm Tyrode's buffer, pH 7.4 (119 mm NaCl, 2.5 mm KCl, 25 mm HEPES, 2 mm CaCl2, 2 mm MgCl2, 30 mm glucose), and live cells were imaged in a custom-built chamber before bleaching SN, immediately after bleaching SN and 15 min after bleaching SN.
Preparation of cultured hippocampal neurons.
All procedures for experiments involving animals were approved by the animal welfare committee of Charité Medical University and the Berlin state government. For live cell imaging and immunocytochemistry, hippocampal neuron cultures from mouse WT animals (C57BL/6J) (RRID:IMSR_JAX:000664) of either sex were prepared on glass coverslips using the Banker protocol (Banker and Goslin, 1988; Meberg and Miller, 2003) or on μ-Slide 8 Well culture dishes (ibidi). For Banker cultures, astrocytes were prepared from mouse WT cortices P 0–2 and seeded on 6-well or 12-well plates at a density of 10,000 per 1 cm2 5–7 d before the addition of neurons (see below). Neuronal cultures were prepared from hippocampi dissected from WT mice P 0–2 brains in cold HBSS (Millipore), followed by a 30 min incubation in enzyme solution (DMEM, Invitrogen, Thermo Fisher Scientific), 3.3 mm cysteine, 2 mm CaCl2, 1 mm EDTA, and 20 U/ml papain (Worthington) at 37°C. Papain reaction was inhibited by the incubation of hippocampi in inhibitor solution (DMEM, 10% FCS, Thermo Fisher Scientific), 38 mm BSA (Sigma-Aldrich), and 95 mm trypsin inhibitor (Sigma-Aldrich) for 5 min. Afterward, cells were triturated in Neurobasal-A medium (2% B27, 1% Glutamax, 0.2% P/S; Thermo Fisher Scientific) by gentle pipetting up and down. Isolated neuronal cells were plated onto nitric acid washed and poly-L-lysine-coated glass coverslips with paraffin dots at a density of 10,000 per 1 cm2. After 1.5 h, the coverslips were put upside down onto the prepared astrocytes and cocultured in Neurobasal-A medium at 37°C, 5% CO2, for 13–15 DIV before starting experiments. For cultures on multiwell culture dishes, dissociated hippocampal neurons were plated directly onto μ-Slide 8 Well Grid-500 ibiTreat culture dishes (ibidi) at a density of 25,000 per 1 cm2 and maintained in Neurobasal-A medium at 37°C, 5% CO2, for 13–15 DIV before starting experiments.
Lentivirus production.
All lentiviral particles were provided by the Viral Core Facility of the Charité-Universitätsmedizin Berlin (https://vcf.charite.de/en/) and were prepared as described previously (Lois et al., 2002). Briefly, HEK293T (RRID:CVCL_0063) cells were cotransfected with 10 μg of shuttle vector, 5 μg of helper plasmid pCMVdR8.9, and 5 μg of pVSV.G with X-tremeGENE 9 DNA transfection reagent (Roche Diagnostics). Virus containing cell culture supernatant was collected after 72 h and filtered for purification. Aliquots were flash-frozen in liquid nitrogen and stored at −80°C. Neurons were infected with lentivirus at 2–3 DIV.
Immunocytochemistry of hippocampal neurons.
To chemically induce or inhibit autophagy, primary hippocampal neurons 13–15 DIV (that were infected with lentivirus at 2–3 DIV) were treated with 2 μm rapamycin (in DMSO, Sigma-Aldrich) and/or 1 μm wortmannin (in DMSO, InvivoGen), respectively. Untreated cells were used as a control. After treatment, cells were fixed with 4% PFA in PBS for 4 min and washed twice with PBS (10 min each). Afterward, cells were permeabilized with PBS-T three times for 10 min each. Following a 30 min incubation with 5% normal goat serum in PBS-T (=blocking solution), neurons were incubated with primary antibodies, diluted in blocking solution, for 45 min at room temperature. The following antibodies were used: primary antibody against p62 (RRID:AB_1279301) (1:500; rabbit; MBL; catalog #PM045), Homer1 (RRID:AB_10549720) (1:1000; guinea pig; Synaptic Systems; catalog #160004), KillerRed (recognizes SN) (1:1000; rabbit; Evrogen; catalog #AB961), GFP (RRID:AB_2534023) (1:1000; chicken; Thermo Fisher Scientific; catalog #A10262), mCherry (RRID:AB_2571870) (1:1000; rabbit; Abcam; catalog #ab167453), LC3 (RRID:AB_796155) (1:500; rabbit; Sigma-Aldrich; catalog #L7543), Bassoon (RRID:AB_2290619) (1:500; guinea pig; Synaptic Systems; catalog #141004), Syt1 (RRID:AB_887832) (1:1000; mouse; Synaptic Systems; catalog #105011), Syp1 (RRID:AB_887824) (1:1000; mouse; Synaptic Systems; catalog #101011), Syn1 (RRID:AB_1281135) (1:1000; rabbit; Abcam; catalog #ab64581), and Chmp2b (RRID:AB_2079471) (1:200; rabbit; Abcam; catalog #ab33174). Afterward, cells were washed three times in PBS-T for 10 min each, incubated with the secondary antibody, diluted in PBS-T 1:1000 (RRID:AB_142924, RRID:AB_2576217, RRID:AB_141725, RRID:AB_141882, RRID:AB_10563566, RRID:AB_2535813, RRID:AB_1500630, RRID:AB_144696) (Thermo Fisher Scientific), for 60 min and washed twice with PBS-T and once with PBS for 10 min each. Finally, coverslips were dipped in H2O and mounted in ProLong Diamond Antifade Mountant (Thermo Fisher Scientific).
Western blot analyses.
Cultured hippocampal neurons, either infected with lentivirus at 2–3 DIV (TD) or uninfected (UT), were grown on 6-well plates with a density of 20,000 per 1 cm2 until 13–15 DIV. All following steps were performed at 4°C. Neurons were kept on ice and washed twice with cold PBS. Subsequently, cells were detached by mechanical force. For total lysates, isolated cells were centrifuged at 4000 rpm for 10 min, resuspended in 100 μl lysis buffer (50 mm Tris, pH 7.9, 150 mm NaCl, 5 mm EDTA, 1% Triton X-100, 1% NP-40, 0.5% deoxycholate, protease inhibitor cOmplete Tablets 1x), and incubated for 5 min on ice. Afterward, cell suspension was centrifuged at 13,000 rpm for 10 min after which the supernatant was transferred into a new tube. For synaptosome suspension (and cytosol fraction) preparation, cortical or hippocampal neurons (both prepared according to Preparation of cultured hippocampal neurons) were treated with 2 μm rapamycin for either 10 min or 2 h. Next, cells were lysed in Syn-PER Synaptic Protein Extraction Reagent (Thermo Fisher Scientific) according to the manufacturer's instructions. Briefly, cells were washed with cold PBS, detached by mechanical force in 100–200 μl Syn-PER reagent, and centrifuged at 1200 × g for 15 min. The supernatant was centrifuged at 15,000 × g for 20 min, and the cytosol fraction was collected. Last, the synaptosome pellet was resuspended in Syn-PER Reagent. Subsequently, the protein concentration was determined using the Pierce BCA Protein Assay Kit (Thermo Fisher Scientific). The same amount of total protein (6.5–10 μg) was then separated by SDS-PAGE and transferred onto a PVDF membrane. Afterward, the membrane was blocked in 5% milk in TBS-T (20 mm Tris, 150 mm NaCl, 0.1% Tween 20) for 1 h followed by primary antibody incubation (1:1000 in 3% milk in TBS-T) overnight or for 72 h at 4°C. The following antibodies were used: primary antibody against mCherry (1:1000; rabbit; Abcam; catalog #ab167453), actin (RRID:AB_476693) (1:1000; rabbit; Sigma-Aldrich; catalog #A2066), Syp1 (1:1000; mouse; Synaptic Systems; catalog #101011), and LC3 (1:1000; rabbit; Sigma-Aldrich; catalog #L7543). Afterward, the membrane was washed three times with TBS-T for 10 min each and incubated with HRP-conjugated secondary antibody (1:2500 in 3% milk in TBS-T) (RRID:AB_772206, RRID:AB_772193) (Sigma-Aldrich) for 1 h at room temperature. Afterward, the membrane was washed three times with TBS-T, and bands were visualized using the imaging system Fusion FX7 (Vilber) using 20× LumiGLO Reagent and 20× peroxidase (Cell Signaling Technology).
Photobleaching primary hippocampal neurons expressing SN/mCherry-constructs.
Primary hippocampal neurons grown in μ-Slide 8 Well Grid-500 ibiTreat (ibidi) culture dishes expressing Syp-SN, Syp-mCherry, Syp-lumSN, Syn-SN, or Syt-SN cassettes were imaged at 13–15 DIV in Neurobasal medium without phenol red (Thermo Fisher Scientific) at 37°C. Afterward, a smaller diaphragm restricted area within the FOV was bleached for 60 s using 563 nm wavelength light from a mercury lamp (100% HXP 120 V, 43 HE filter set 563/581). Immediately after bleaching, a second image was taken confirming the radius of the bleached area. Subsequently, neurons were fixed at different time points (2–10 min, 56–64 min, 116–124 min) after bleaching SN and immunostained with antibodies against SN (using a KillerRed antibody), mCherry, GFP, Bassoon, Syt1, Syp1, LC3, or Chmp2b (for procedure, see Immunocytochemistry of hippocampal neurons). To scavenge ROS, 60 μm N-acetyl-L-cysteine (NAC) (in DMEM, Sigma-Aldrich) was added right before the bleaching and kept on the cells until fixation. For autophagy inhibition, 1 μm wortmannin was added right before the bleaching and kept on the cells until fixation. After immunostaining, the same FOVs, including the bleached areas, were imaged using the grid on the μ-Slide 8 Well Grid-500 culture dishes.
Basal autophagy in primary hippocampal neurons.
Primary hippocampal neurons in μ-Slide 8 Well Grid-500 ibiTreat (ibidi) culture dishes expressing FU-eGFP-LC3 were left untreated and fixed at 13–15 DIV. Afterward, neurons were immunostained with antibodies against GFP, Bassoon and Syp1, Syn1, or Syt1 (for procedure, see Immunocytochemistry of hippocampal neurons).
Electron microscopy.
Cultured hippocampal neurons were plated on astrocytes on carbon-coated, 6 mm sapphire disks at a density of 20,000 per 1 cm2 and infected with FU-Syp-SN-P2A-eGFP-LC3 at 2–3 DIV. To better correlate ROIs at the fluorescence and electron microscopy level, carbon was coated in the shape of an alphabetical grid on sapphire disks with the help of a metal mask (finder grid, Plano). After a total of 13–15 d in culture, the sapphire disks were transferred into uncoated μ-Slide 8 Well to perform the bleaching experiment (for procedure, see Bleaching of primary hippocampal neurons expressing SN constructs). Cryo-fixation using a high-pressure freezing machine (EM-ICE, Leica Microsystems) was conducted at different time points after bleaching (10 min, 40 min) in Neurobasal medium without phenol red with the addition of a drop of 10% Ficoll solution (Sigma-Aldrich) to prevent ice crystal damage. After freezing, samples were cryo-substituted in anhydrous acetone containing 1% glutaraldehyde, 1% osmium tetroxide, and 1% milliQ water in an automated freeze-substitution device (AFS2, Leica Microsystems). The temperature was kept for 4 h at −90°C, brought to −20°C (5°C/h), kept for 12 h at −20°C, and then brought from −20°C to 20°C (5°C/h). Once at room temperature, samples were en bloc stained in 0.1% uranyl acetate in acetone, infiltrated in increasing concentration of Epoxy resin (Epon 812, EMS Adhesives) in acetone and finally embedded in pure Epon for 48 h at 65°C. Sapphire disks were removed from the cured resin block by thermal shock. At this point, the alphabetical grid was visible on the resin block and was used to find back the bleached regions. The corresponding areas were excised from the block for ultrathin sectioning. For each sapphire, as a control, an additional resin block was excised from the quadrant opposite to the bleached area. The 50-nm-thick sections were obtained using an Ultracut ultramicrotome (Leica Microsystems) equipped with an Ultra 45 diamond knife (Ultra 45, Diatome) and collected on formvar-coated 200-mesh copper grids (EMS Adhesives). Sections were counterstained with uranyl acetate and lead citrate and imaged in a FEI Tecnai G20 Transmission Electron Microscope (FEI), operated at 80–200 keV, and equipped with a Veleta 2000 × 2000 CCD camera (Olympus). Approximately 200 electron micrographs were collected (pixel size = 0.7 nm) for each sample. Data were analyzed blindly using the ImageJ software. Double-membraned structures per presynaptic terminal were counted.
Electrophysiology.
Whole-cell patch-clamp recordings were performed on autaptic hippocampal neurons at 13–18 DIV. All recordings were obtained at ∼25°C from neurons clamped at −70 mV with a Multiclamp 700B amplifier (Molecular Devices) under the control of Clampex 10.4 software (Molecular Devices). Data were sampled at 10 kHz and low-pass Bessel filtered at 3 kHz. Series resistance was compensated at 70%, and cells whose series resistance changed >25% throughout the recording session were excluded from the analysis. Neurons were immersed in standard extracellular solution consisting of 140 mm NaCl, 2.4 mm KCl, 10 mm HEPES, 10 mm glucose, 2 mm CaCl2, and 4 mm MgCl2. The borosilicate glass electrodes (3–8 mΩ) were filled with the internal solution containing 136 mm KCl, 17.8 mm HEPES, 1 mm EGTA, 0.6 mm MgCl2, 4 mm ATP-Mg, 0.3 mm GTP-Na, 12 mm phosphocreatine, and 50 U/ml phosphocreatine kinase. All solutions were adjusted to pH 7.4 and osmolarity of ∼300 mOsm. Coverslips with cultured neurons were placed on an IX73 microscope (Olympus) with 20× phase contrast objective. For SN bleaching, illumination from a Mercury Vapor Short Arc lamp (X-Cite 120PC Q, Excelitas Technologies) was filtered through a 560/40 nm filter cube (Olympus U-FF mCherry) and controlled with a mechanical shutter. Lamp iris settings (100%) resulted in 71% bleaching of SN intensity (compared with 22% of mCherry bleaching), after 60 s of illumination. From each neuron, 6 sweeps of EPSCs were evoked with a 2 ms voltage step from −70 mV to 0 mV at 0.2 Hz. Sixty seconds of illumination started immediately after the end of the sixth sweep; and after 5 min of waiting, a second set of EPSCs was recorded. Control condition without illumination included a 6 min waiting period. During recordings with wortmannin, 1 μm wortmannin solution was applied onto the cell using a fast-flow system from the beginning of the first EPSC until end of the recording session. Electrophysiological data were analyzed offline using Axograph X (RRID:SCR_014284) (Axograph Scientific), Excel (Microsoft), and Prism (GraphPad).
Image acquisition and quantification.
All images were acquired on a spinning disc confocal microscope (Carl Zeiss Axio Oberserver.Z1 with Andor spinning disc and cobolt, omricron, i-beam laser) (Carl Zeiss, Andor) using either a 40× or 63× 1.4 NA Plan-Apochromat oil objective and an iXon ultra (Andor) camera controlled by iQ software (RRID:SCR_014461) (Andor). Images were processed using ImageJ (RRID:SCR_003070) and OpenView software (written by Dr. Noam Ziv, Technion Institute, Haifa, Israel). In brief with the OpenView software, multichannel intensities were measured using a box routine associated with individual boutons. Boxes varied between 7 × 7 and 9 × 9 pixels in size, whereas settings were kept the same (e.g., thresholds). The average intensity (synaptic proteins, eGFP-LC3 et cetera) was calculated from all picked puncta and normalized to the control (untreated or unbleached). For quantification of number of puncta, separated axons were randomly picked and the number of puncta per unit length was counted manually. For SN experiments, axons were selected showing no or little eGFP-LC3 staining before bleaching. All SN evaluations were normalized to the unbleached control. To analyze the decrease in DHEblue intensity following bleaching, HEK293 cells were marked in ImageJ using the Polygon selection tool, and mean intensities of the identified areas were measured. Intensities of numerous samples were averaged and plotted. Band intensities of Western blots were analyzed with the help of ImageJ and the Analyze>Gels tool. To determine the fraction of extrasynaptic eGFP-LC3 puncta positive for Syp-SN/Syn-SN/Syt-SN/Syp-lumSN/Syp1/Syn1/Syt1, multichannel images were manually scanned for eGFP-LC3 puncta within the bleached area that were not colocalizing with Bassoon. Of these extrasynaptic eGFP-LC3 puncta, the fraction of eGFP-LC3 puncta positive for a specific synaptic protein was quantified. The fraction of extrasynaptic Syp-SN/Syn-SN/Syt-SN/Syp-lumSN puncta positive for eGFP-LC3 was determined accordingly. For each analysis, the following procedure was done: each experiment was performed with 2–4 independently prepared cultures. During each rapamycin experiment, 1 or 2 coverslips were used. A total of 10 images were taken from a maximum of 2 coverslips. From these, numerous synapses and up to 40 axons were used for the analyses. For SN experiments, 2–4 independently prepared cultures were bleached. During each experiment, 2 wells for each time point were used. One or two images were taken per time point per well, leading to a total of ∼20–30 axons and 60–250 synapses/puncta analyzed. Depicted normalized means of intensities in puncta represent the means of all analyzed synapses/puncta per experimental condition normalized to their in-culture controls.
Experimental design and statistical analyses.
Statistical design for all experiments can be found in the figure legends. Independent experiments equal independent cultures. All data representations and statistical analyses were performed with GraphPad Prism (RRID:SCR_002798).
Results
Monitoring presynaptic autophagy
The primary goal of this study is to examine how and whether the local generation of ROS around SVs triggers a synaptic clearance response that removes damaged proteins. Based on previous studies showing that elevated ROS levels around organelles, such as mitochondria, lead to the activation of autophagy (Yang and Yang, 2011; Wang et al., 2012; Ashrafi et al., 2014), we anticipated that a similar generation of ROS around SVs may also induce a presynaptic autophagy-based clearance program. Thus, while other clearance mechanisms, such as the endo-lysosomal or the proteasome system, could also be activated (see below), we initially sought to develop a live cell imaging-based system that could detect changes in presynaptic autophagy, following different insults.
To achieve this goal, we initially created a lentiviral vector (FU-Syp-mCh-P2A-eGFP-LC3) that coexpresses mCherry-tagged Syp (Syp-mCh), as a presynaptic marker, and eGFP-tagged LC3, to detect autophagic vacuoles (AVs) (Fig. 1A). To allow for the independent expression of Syp-mCh and eGFP-LC3, a P2A cleavage site was placed between the two coding sequences (Fig. 1A). P2A is a highly efficient “self-cleaving” small peptide derived from porcine teschovirus-1 leading to post-translational cleavage of the initially transcribed fusion protein (Kim et al., 2011). The vector was tested in a number of different assays. First, it was lentivirally transduced into HeLa cells, where Syp-mCh and eGFP-LC3 both exhibited a largely diffuse cytoplasmic distribution (Fig. 1B). The addition of 100 μm chloroquine that impedes autophagic flux blocking lysosomal degradation (Klionsky et al., 2012; Galluzzi et al., 2016; Mauthe et al., 2018) resulted in a redistribution of eGFP-LC3 into a punctate pattern that colocalizes with total LC3 (endogenously and exogenously expressed) and the autophagophore marker p62 (Johansen and Lamark, 2011) (Fig. 1B). However, Syp-mCh retained its diffuse cytosolic pattern and was not recruited into AVs (Fig. 1B). These data indicate not only that the P2A site is efficiently cleaved, but also that eGFP-LC3 reliably reports the formation of AVs as previously reported (Mizushima et al., 2010; Klionsky et al., 2012; Okerlund et al., 2017).
Figure 1.

Rapamycin induces rapid increase in presynaptic autophagy. A, Schematic of lentiviral vector FU-Syp-mCherry-P2A-eGFP-LC3 expressing Syp-mCherry (mCh) and eGFP-LC3 under a ubiquitin promoter. Post-translational cleavage at the P2A site separates the two proteins. B, Autophagy induction (EBSS + 100 μm chloroquine for 2 h) of FU-Syp-mCherry-P2A-eGFP-LC3-expressing HeLa cells, demonstrating that, following autophagy induction, eGFP-LC3 puncta colocalize with both endogenous LC3 and p62, but not Syp-mCh. C, Live cell images of hippocampal neurons expressing FU-Syp-mCherry-P2A-eGFP-LC3 analyzed at 14 DIV. Syp-mCh and eGFP-LC3 exhibit different patterns, indicating P2A-mediated cleavage. Arrow indicates Syp-mCh puncta. Arrowhead indicates colocalization of Syp-mCh and eGFP-LC3. D, Representative images of hippocampal neurons infected with FU-Syp-mCherry-P2A-eGFP-LC3 and immunostained with antibodies against the postsynaptic protein Homer1. Colocalization of Syp-mCh and Homer1 indicates presynaptic targeting of Syp-mCh. E, Western blot of lysates prepared from hippocampal neurons infected with FU-Syp-mCherry-P2A-eGFP-LC3 (TD) or UT and stained with mCherry antibodies. Top band, Uncleaved Syp-mCh-P2A-eGFP-LC3 fusion protein. Bottom band, Cleaved Syp-mCh. The lower size band representing cleaved Syp-mCh is much more abundant than the higher molecular size band, representing Syp-mCh-P2A-eGFP-LC3 fusion protein, thus indicating efficient cleavage. F–H, Images of hippocampal neurons expressing FU-Syp-mCherry-P2A-eGFP-LC3, treated with 2 μm rapamycin (R) for 2 h (F) or 10 min (G, H) before fixation and staining with antibodies against p62 (H). I–M, Quantification of the normalized intensity of eGFP-LC3 levels at Syp-mCh puncta (I, K) as well as the number of puncta/100 μm of axon (J,L) after 2 h (I, J) or 10 min (K, L) of 2 μm rapamycin treatment. I, Control = 1 ± 0.094, n = 412 synapses, 3 independent experiments; 2 μm R (2 h) = 1.36 ± 0.164, n = 301 synapses, 3 independent experiments, p = 0.0414. J, Control = 2.72 ± 0.529, n = 40 axons, 4 independent experiments; 2 μm R (2 h) = 4.80 ± 0.928, n = 20 axons, 2 independent experiments, p = 0.0407. K, Control = 1 ± 0.094, n = 412 synapses, 3 independent experiments; 2 μm R (10 min) = 1.73 ± 0.092, n = 343 synapses, 3 independent experiments; p < 0.0001. L, Control = 2.72 ± 0.529, n = 40 axons, 4 independent experiments; 2 μm R (10 min) = 5.05 ± 0.695, n = 47 axons, 4 independent experiments; p = 0.0111. Quantification of the normalized p62 levels at eGFP-LC3 puncta (M). M, Control = 1 ± 0.170, n = 50 puncta, 3 independent experiments; 2 μm R (10 min) = 1.91 ± 0.283, n = 52 puncta, 3 independent experiments (p = 0.0072), confirming that eGFP-LC3 puncta depict autophagic organelles. N, Images of hippocampal neurons expressing FU-Syp-mCherry-P2A-eGFP-LC3 and treated with 1 μm wortmannin (W) before and during a 10 min incubation with 2 μm rapamycin (R). O, P, Quantification of N showing that wortmannin suppresses the induction of autophagy at Syp-mCh puncta (O) and along axons (P) following the addition of rapamycin. O, Control = 1 ± 0.073, n = 540 synapses, 4 independent experiments; 2 μm R (10 min) = 1.63 ± 0.071, n = 469 synapses, 4 independent experiments; 2 μm R + 1 μm W (10 min) = 0.98 ± 0.036, n = 152 synapses, 2 independent experiments, p < 0.0001 and p < 0.0001. P, Control = 2.72 ± 0.529, n = 40 axons, 4 independent experiments; 2 μm R (10 min) = 5.05 ± 0.695, n = 47 axons, 4 independent experiments; 2 μm R + 1 μm W (10 min) = 1.92 ± 0.573, n = 20 axons, 2 independent experiments, p = 0.0187 and p = 0.01. Scale bars: B–D, 10 μm; F–H, N, 5 μm. Error bars indicate SEM. Unpaired t test (I–M) and ANOVA Tukey's multiple-comparisons test (O, P) were used to evaluate statistical significance. *p < 0.05, **p < 0.01, ****p < 0.0001.
In a second set of experiments, we examined whether Syp-mCh faithfully labeled presynaptic sites. Here, dissociated cultures of hippocampal neurons were infected to 30% with our lentiviral vector (FU-Syp-mCherry-P2A-eGFP-LC3) at 2–3 DIV and analyzed by immunocytochemistry at 13–15 DIV. Immunostaining of fixed cultures with antibodies to the postsynaptic density protein Homer1 revealed that Syp-mCh forms puncta along the cell somas and dendrites of uninfected cells that colocalize with Homer1 puncta (Fig. 1D), consistent with the presynaptic localization of other XFP-tagged Syp as reported previously (Li et al., 2010). A comparison of Syp-mCh and eGFP-LC3 signals in primary hippocampal neurons during live cell imaging reveals that a small fraction (∼10%) of the Syp-mCh-positive puncta colocalizes with eGFP-LC3-positive puncta (Fig. 1C). The minimal colocalization suggests that the P2A site is functioning properly to uncouple these two proteins. This concept is further supported by Western blots of cellular lysates of infected hippocampal neurons stained with a mCherry antibody. Here, >95% of the immunoreactivity is present in the 70 kDa Syp-mCh band versus the uncleaved 120 kDa Syp-mCh-P2A-eGFP-LC3 band (Fig. 1E), supporting the conclusion that, once expressed in neurons, each reporter is free to operate independently.
In a third set of experiments, we examined how the induction of autophagy with 2 μm of the mTOR inhibitor rapamycin (Boland et al., 2008; Spilman et al., 2010; Hernandez et al., 2012) affected the distribution of eGFP-LC3 relative to Syp-mCh in neurons. Initially, rapamycin was added to sparsely FU-Syp-mCherry-P2A-eGFP-LC3-expressing hippocampal cultures (13–15 DIV) for 2 h, as most previous studies had shown that this condition can induce autophagy in neurons (Hernandez et al., 2012). To identify “synaptic” changes in eGFP-LC3 levels, we analyzed the average intensities of eGFP-LC3 puncta that colocalized with Syp-mCh puncta in fixed neurons. This revealed a modest (36%) but significant increase in eGFP-LC3 intensities within presynaptic boutons compared with untreated control neurons (Fig. 1F,I). Monitoring the number of eGFP-LC3 puncta per unit length of axon revealed that 2 h of rapamycin treatment significantly increased the number of eGFP-LC3 puncta present in axons compared with nontreated control neurons (Fig. 1F,J). These data are consistent with the concept that rapamycin can induce the formation of autophagosomes/AVs in hippocampal axons. However, given that vesicular transport is quite rapid, it is unclear whether during the 2 h period the newly formed AVs arose at synapses and dispersed into the axons and/or were generated within axons and then accumulate within presynaptic boutons. We thus explored whether AVs would appear in as little as 10 min following the addition of rapamycin. Surprisingly, we found that not only did eGFP-LC3 puncta appear in axons during this short period of induction (Fig. 1G,L), but eGFP-LC3 intensity was dramatically increased within presynaptic boutons marked with Syp-mCh (Fig. 1G,K). Importantly, we also found that appearing eGFP-LC3 puncta were positive for the autophagy cargo receptor p62 (Johansen and Lamark, 2011) (Fig. 1H,M), suggesting that they are indeed autophagosomes and are forming locally within presynaptic boutons. To further explore whether the observed rapamycin-induced AV formation at synapses is induced via the canonical autophagy pathway, which includes the PI3K Vps34 (Rubinsztein et al., 2012; Lilienbaum, 2013), we included 1 μm wortmannin, a general PI3K inhibitor (Carpenter and Cantley, 1996; Klionsky et al., 2012), together with rapamycin during the 10 min incubation period. This manipulation abolished the accumulation of eGFP-LC3 puncta in both presynaptic boutons (marked with Syp-mCh) (Fig. 1N,O) and along axons (Fig. 1N,P). Together, these data indicate that the machinery necessary for the rapid generation of AVs is located within or very near to presynaptic boutons and can be triggered by a PI3K-dependent pathway.
To corroborate the novel finding that rapamycin induces synaptic autophagy within 10 min (Fig. 1K), cortical and hippocampal neurons were treated with 2 μm rapamycin for either 10 min or 2 h and subsequently lysed and prepared for Western blot analyses. To quantify predominantly synaptic autophagy, synaptosomes (synaptosome suspension) were enriched, leading to a strong Syp signal compared with the cytosol fraction (Fig. 2A). The soluble form of LC3 is defined as LC3-I; LC3 that is conjugated to the autophagosome is defined as LC3-II. Thus, LC3-II is an excellent marker to monitor autophagy (Satoo et al., 2009; Mizushima et al., 2010; Fleming et al., 2011). In our Western blot experiments, both LC3-I and LC3-II bands were increased after 10 min of rapamycin treatment in cortical (Fig. 2A,C) and hippocampal neurons (Fig. 2B,E) compared with untreated control cells. However, the increase in LC3-II is higher in hippocampal neurons than in cortical neurons, indicating that hippocampal neurons are more sensitive to rapamycin-dependent autophagy induction. After a 2 h treatment of rapamycin, LC3-I and LC3-II levels are still elevated in both cortical (Fig. 2A,D) as well as hippocampal (data not shown) neurons. Together, these observations support our conclusion that synaptic autophagy can be induced by rapamycin treatment within a short minute time frame.
Figure 2.

Rapid increase in endogenous LC3 by rapamycin treatment. A, B, Western blot of lysates from cultured cortical (A) and hippocampal (B) neurons treated with 2 μm rapamycin (R) for 10 min (A,B) or 2 h (A) and stained with antibodies against Actin, Syp, and LC3. Note the strong enrichment of LC3-I and LC3-II within the synaptosome suspension (syn) (left) compared with the cytosol fraction (right). Data indicate that synaptic autophagy can be rapidly induced by rapamycin treatment. C–E, Quantification of LC3-II/Actin from the synaptosome suspensions from A (C, D) and B (E). C, Control = 0.29 ± 0.111, 5 independent experiments; 2 μm R (10 min) = 0.44 ± 0.101, 5 independent experiments. D, Control = 0.35 ± 0.178, 3 independent experiments; 2 μm R (2 h) = 0.84 ± 0.200, 3 independent experiments. E, Control = 0.13 ± 0.029, 3 independent experiments; 2 μm R (10 min) = 0.50 ± 0.173, 3 independent experiments. Error bars indicate SEM. Unpaired t test was used to evaluate statistical significance.
Light-activated ROS generation triggers presynaptic autophagy
The ability of rapamycin to induce presynaptic autophagy within 10 min strongly suggests that presynaptic boutons contain local clearance mechanisms, such as autophagy, that could in principle deal with locally damaged proteins in real time. As a direct test of this hypothesis, we explored whether the real-time damage of SV proteins via the production of ROS (Takemoto et al., 2013) could also trigger the rapid clearance of these molecules via, for example, autophagy. To accomplish this goal, we made use of a molecular variant of GFP called SN, a monomeric version of KillerRed (Bulina et al., 2006), previously shown to generate ROS following its excitation with 550–590 nm light (Takemoto et al., 2013). As other photosensitizers, short-lived ROS generated by SN are expected to damage proteins within 1–4 nm of the source (Linden et al., 1992; Takemoto et al., 2013). Thus, to restrict the actions of the ROS to SVs, we initially fused SN to the short cytoplasmic tail of the SV protein Syp (creating Syp-SN). This was then subcloned and coexpressed with eGFP-LC3 via our lentiviral vector (FU-Syp-SN-P2A-eGFP-LC3) (Fig. 3A; see also Fig. 9A).
Figure 3.

Rapid induction of autophagy by ROS-mediated damage by Syp-SN. A, Schematic of FU-Syp-SN-P2A-eGFP-LC3 expression vector. B, Low-magnification images of hippocampal neurons expressing FU-Syp-SN-P2A-eGFP-LC3 grown on top of uninfected neurons before and after photobleaching a ROI (dashed line). Boxes represent areas within (red) and outside (black) bleached area used for analysis. C–E, Images of axon segments (5 min, 1 h, and 2 h after bleaching) that were subsequently fixed and stained with antibodies against GFP to detect eGFP-LC3 and SN to detect Syp-SN. Data indicate that autophagy at synapses can be rapidly induced through Syp-SN photobleaching. F, Quantification of normalized eGFP-LC3 intensities within Syp-SN puncta 5 min (C) after bleaching (unbleached = 1 ± 0.057, n = 119 synapses, 3 independent experiments; bleached = 1.43 ± 0.113, n = 132 synapses, 3 independent experiments, p = 0.001). G, Quantification of the normalized number of eGFP-LC3 puncta per unit axon length, in axons 5 min after photobleaching (C) (unbleached = 1 ± 0.166, n = 17 axons, 3 independent experiments; bleached = 0.70 ± 0.119, n = 18 axons, 3 independent experiments). H, Quantification of normalized eGFP-LC3 intensities within Syp-SN puncta 1 h (D) after bleaching (unbleached = 1 ± 0.071, n = 132 synapses, 3 independent experiments; bleached = 1.43 ± 0.117, n = 167 synapses, 3 independent experiments, p = 0.0035). I, Quantification of the normalized number of eGFP-LC3 puncta per unit axon length in axons 1 h after photobleaching (D) (unbleached = 1 ± 0.146, n = 24 axons, 3 independent experiments; bleached = 1.37 ± 0.166, n = 24 axons, 3 independent experiments). J, Quantification of normalized eGFP-LC3 intensities within Syp-SN puncta 2 h (E) after bleaching (unbleached = 1 ± 0.054, n = 136 synapses, 3 independent experiments; bleached = 1.22 ± 0.065, n = 141 synapses, 3 independent experiments, p = 0.0111). K, Quantification of the normalized number of eGFP-LC3 puncta per unit axon length 2 h after photobleaching (E) (unbleached = 1 ± 0.173, n = 23 axons, 3 independent experiments; bleached = 2.75 ± 0.336, n = 22 axons, 3 independent experiments, p < 0.0001). Scale bars: B, 50 μm; C–E, 10 μm. Error bars indicate SEM. Unpaired t test was used to evaluate statistical significance. *p < 0.05, **p < 0.01, ***p < 0.001, ****p < 0.0001.
Figure 9.

Syt-SN- and Syn-SN-mediated ROS production increases eGFP-LC3 levels at presynaptic boutons. A, Schematic of an SV containing Syp, Syt, or Syn tagged with SN. The short (95 amino acids) (Gordon and Cousin, 2014) versus long (346 amino acids, comprised of two C2 domains) (Ybe et al., 2000) cytoplasmic tails of Syp versus Syt, respectively, which could significantly change the distance of SN to the SV membrane and thus its proximity to other SV proteins. Similarly, tagging SN to the much larger peripherally associated SV protein Syn could also affect its distance to other SV proteins. B–D, Images of hippocampal neurons expressing FU-Syt-SN-P2A-eGFP-LC3 that were fixed and stained with antibodies against GFP and SN 5 min (B), 1 h (C), and 2 h (D) after bleaching. eGFP-LC3 levels are significantly increased 1 h after Syt-SN-mediated ROS production. E–G, Quantification of normalized eGFP-LC3 intensities within Syt-SN puncta, 5 min (E), 1 h (F), and 2 h (G) after bleaching. E, Unbleached = 1 ± 0.074, n = 62 synapses, 2 independent experiments; bleached = 1.06 ± 0.098, n = 76 synapses, 2 independent experiments. F, Unbleached = 1 ± 0.111, n = 73 synapses, 2 independent experiments; bleached = 1.45 ± 0.143, n = 81 synapses, 2 independent experiments, p = 0.0156. G, Unbleached = 1 ± 0.085, n = 58 synapses, 2 independent experiments; bleached = 1.05 ± 0.087, n = 68 synapses, 2 independent experiments. H–J, Images of hippocampal neurons expressing FU-Syn-SN-P2A-eGFP-LC3 that were fixed and stained with antibodies against GFP and SN 5 min (H), 1 h (I), and 2 h (J) after bleaching. eGFP-LC3 levels are significantly increased 1 h and 2 h after Syn-SN-mediated ROS production. K–M, Quantification of normalized eGFP-LC3 intensities within Syn-SN puncta, 5 min (K), 1 h (L), and 2 h (M) after bleaching. K, Unbleached = 1 ± 0.084, n = 58 synapses, 3 independent experiments; bleached = 1.04 ± 0.069, n = 81 synapses, 3 independent experiments. L, Unbleached = 1 ± 0.061, n = 77 synapses, 3 independent experiments; bleached = 1.72 ± 0.103, n = 103 synapses, 3 independent experiments, p < 0.0001. M, Unbleached = 1 ± 0.075, n = 42 synapses, 3 independent experiments; bleached = 1.30 ± 0.090, n = 71 synapses, 3 independent experiments, p = 0.0255. Scale bars, 10 μm. Error bars indicate SEM. Unpaired t test was used to evaluate statistical significance. *p < 0.05, ****p < 0.0001.
As with the FU-Syp-mCherry-P2A-eGFP-LC3 vector, we then verified that both the Syp-SN and eGFP-LC3 portions of the vector were expressed and processed. We also verified that the eGFP-LC3 segment was recruited to p62-positive AVs in HeLa cells treated with chloroquine and that Syp-SN properly localized at Homer1-positive synapses as Syp-mCh (data not shown). Moreover, we confirmed in HeLa cells that 80% of the SN fluorescence could be photobleached during a 60 s exposure of 563 nm wavelength light from a mercury lamp.
To explore whether bleaching of Syp-SN can induce presynaptic autophagy, primary hippocampal neurons grown on μ-Slide 8 Well culture dishes were sparsely infected with FU-Syp-SN-P2A-eGFP-LC3 lentivirus at 2–3 DIV. At ∼14 DIV, they were transferred to a spinning disc confocal microscope equipped with a temperature-controlled live cell imaging chamber. Before bleaching selected FOVs, axons from infected neurons growing on top of uninfected neurons were selected and imaged during excitation with a 491 nm (for the eGFP-LC3 signal) and a 561 nm laser (for the Syp-SN signal). Subsequently, a subregion, selected with a field diaphragm, was bleached by exposing cells to 563 nm light from a mercury lamp for 60 s (Fig. 3B), a condition found to bleach ∼80% of the initial fluorescence. Cultures were fixed 5–120 min after bleaching and immunostained with antibodies against GFP and SN, allowing the post hoc identification of synapses within and outside of the bleached area and the levels and redistribution of eGFP-LC3. Comparing the intensity of eGFP-LC3 at Syp-SN-positive puncta within and outside the bleached area revealed a significant increase in synaptic eGFP-LC3 intensity in the bleached area within 5 min of initial bleaching (Fig. 3C,F). However, at that time point, the number of eGFP-LC3 puncta per axon unit length is not changed compared with the unbleached control (Fig. 3C,G). Similarly, 1 h after bleaching, eGFP-LC3 levels are still elevated in Syp-SN-positive synapses inside the bleached area compared with outside, with only a modest increase in the number of eGFP-LC3 puncta per unit length of axon (Fig. 3D,H,I). Intriguingly, 2 h after triggering ROS production, eGFP-LC3 levels remain somewhat elevated at Syp-SN-positive synapses, and dramatically accumulated as small puncta along axons inside the bleached area (Fig. 3E,J,K) compared with those outside. These latter data imply that the synaptic increase in ROS rapidly induces presynaptic autophagy and that subsequent flux carries the autophagosomal membranes into axons.
Although bleaching of SN is described to coincide with ROS generation (Jarvela and Linstedt, 2014), we additionally made use of the superoxide indicator DHE to monitor for ROS production (Fig. 4A,B). DHE exhibits blue light in the cytoplasm. In the presence of superoxides, DHE intercalates with the DNA and emits red light from the nucleus. This redistribution causes the blue fluorescence in the cytoplasm to drop upon ROS production, which is used as a measure of superoxide generation. Bleaching FU-Syp-SN-P2A-eGFP-LC3-transfected HEK293 cells incubated with DHE shows a significantly higher decrease in DHEblue intensity compared with bleaching FU-Syp-mCherry-P2A-eGFP-LC3 transfected and untransfected (UT) control cells (Fig. 4A,B) confirming superoxide generation after SN bleaching, as previously shown (Takemoto et al., 2013). DHEblue intensity also decreases in the presence of FU-Syp-mCherry-P2A-eGFP-LC3 compared with UT control cells indicating that already bleaching mCherry leads to the production of ROS, however, not as efficient as SN (Fig. 4B). Thus, we further investigated the capability of mCherry bleaching-mediated ROS production to induce synaptic autophagy. Intriguingly, Syp-mCh puncta show increased eGFP-LC3 levels compared with unbleached control boutons 1 h after bleaching (Fig. 4C). However, eGFP-LC3 levels after Syp-SN bleaching are significantly higher than after Syp-mCh bleaching (Fig. 4C,D,F). Furthermore, 60 μm of the ROS scavenger NAC, added to FU-Syp-SN-P2A-eGFP-LC3 infected cells before bleaching, diminishes, although not statistically significant, the earlier observed increase in eGFP-LC3 intensities at synapses (Fig. 4D–F). These data indicate that SN is a potent ROS generator and that the rapid induction of synaptic autophagy is caused by a light-activated local increase of ROS near SVs.
Figure 4.

Bleaching-induced increase in eGFP-LC3 levels at presynaptic boutons is ROS-dependent. A, Images of UT HEK293 cells or those expressing FU-Syp-mCherry-P2A-eGFP-LC3 (mCherry/mCh) or FU-Syp-SN-P2A-eGFP-LC3 (Supernova/SN) before and 15 min after 60 s photobleaching. Cells were treated with 10 μm DHE 20 min before bleaching. B, Quantification of the decrease in DHEblue intensity upon bleaching (UT = 51.08 ± 5.566, n = 26 cells, 3 independent experiments; mCh = 102 ± 12.680, n = 36 cells, 4 independent experiments; SN = 157 ± 21.310, n = 31 cells, 4 independent experiments, p < 0.0001 and p = 0.0253). C–E, Images of hippocampal neurons expressing FU-Syp-mCherry-P2A-eGFP-LC3 (C), FU-Syp-SN-P2A-eGFP-LC3 (D,E) that were fixed and stained with antibodies against GFP and SN/mCherry (XY) 1 h after photobleaching, either in the absence (C,D) or the presence of 60 μm NAC (E). F, Quantification of normalized eGFP-LC3 intensities within Syp-XY puncta (mCh = 1.15 ± 0.049, n = 489 synapses, 4 independent experiments; SN = 1.37 ± 0.056, n = 450 synapses, 4 independent experiments; SN + NAC = 1.18 ± 0.057, n = 198 synapses, 3 independent experiments, p = 0.0049). Scale bars: A, 20 μm; C–E, 10 μm. Error bars indicate SEM. ANOVA Tukey's multiple-comparisons test was used to evaluate statistical significance. *p < 0.05, **p < 0.01, ****p < 0.0001.
To rule out that increased eGFP-LC3 levels after Syp-SN bleaching are simply caused by the slight overexpression of LC3 (eGFP-LC3), we also measured endogenous LC3 levels after bleaching in neurons only expressing FU-Syp-SN (Fig. 5A). In accordance with our previous findings (Fig. 3), Syp-SN bleaching leads to a rapid increase in endogenous LC3 intensities at presynaptic boutons identified through the presence of Bassoon within minutes (Fig. 5B,E), and LC3 levels remain elevated for additional 2 h (Fig. 5C,D,F,G). Both data with endogenous LC3 as well as eGFP-LC3 confirm that local light-activated ROS production can induce synaptic autophagy within a short time period as quick as 5 min. This is in line with our observation that rapamycin can induce autophagy within 10 min (Fig. 1).
Figure 5.

Rapid increase in endogenous LC3 by bleaching of Syp-SN. A, Schematic of FU-Syp-SN expression vector. B–D, Images of hippocampal neurons expressing FU-Syp-SN that were fixed and stained with antibodies against LC3 and Bassoon 5 min, 1 h, and 2 h after bleaching. Data indicate that autophagy at synapses can be rapidly induced through Syp-SN photobleaching. E, Quantification of normalized LC3 intensities within Syp-SN/Bsn puncta 5 min (B) after bleaching (unbleached = 1 ± 0.077, n = 74 synapses, 3 independent experiments; bleached = 1.50 ± 0.126, n = 75 synapses, 3 independent experiments, p = 0.0011). F, Quantification of normalized LC3 intensities within Syp-SN/Bsn puncta 1 h (C) after bleaching (unbleached = 1 ± 0.072, n = 59 synapses, 3 independent experiments; bleached = 1.31 ± 0.092, n = 49 synapses, 3 independent experiments, p = 0.0093). G, Quantification of normalized LC3 intensities within Syp-SN/Bsn puncta 2 h (D) after bleaching (unbleached = 1 ± 0.069, n = 60 synapses, 3 independent experiments; bleached = 1.43 ± 0.101, n = 60 synapses, 3 independent experiments, p = 0.0006). Scale bars, 10 μm. Error bars indicate SEM. Unpaired t test was used to evaluate statistical significance. **p < 0.01, ***p < 0.001.
ROS-induced synaptic autophagy is PI3K- and Atg5-dependent
To investigate whether the observed ROS-induced elevation of eGFP-LC3 is dependent on the canonical PI3K/Vps34 autophagy pathway, 1 μm wortmannin was added to neurons before bleaching Syp-SN and maintained in the culture for the following 2 h, after which neurons were fixed and analyzed. In cells that were not treated with wortmannin, eGFP-LC3 intensity within presynaptic boutons as well as the number of eGFP-LC3 puncta per unit length of axon remained elevated (Fig. 6A,C,D) compared with the unbleached control. In contrast, the inclusion of wortmannin was found to inhibit the light-activated increase in eGFP-LC3 intensity within presynaptic boutons (Fig. 6B,E) but had no effect on the number of eGFP-LC3 puncta per unit length of axon (Fig. 6B,F). These data indicate that the ROS-induced increase in presynaptic autophagy may be dependent on the PI3K signaling pathway, whereas autophagy within axons is not. While most of the Syp-SN is synaptic (data not shown), extrasynaptic pools are likely present, presumably engaged in the active transport within mobile pools of SVs (Tsuriel et al., 2006; Maas et al., 2012; Cohen et al., 2013). Photobleaching damage of this pool could thus contribute to a PI3K-independent form of axonal autophagy in axons, as already described for other cell types (Chu et al., 2007; Zhu et al., 2007; Lemasters, 2014).
Figure 6.

ROS-induced increase in eGFP-LC3 levels at presynaptic boutons is PI3K- and Atg5-dependent. A, B, Images of hippocampal neurons expressing FU-Syp-SN-P2A-eGFP-LC3 that were fixed and stained with antibodies against GFP and SN 2 h after photobleaching, either in the absence (A) or the presence of 1 μm wortmannin (W) (B). C, D, Quantification of normalized eGFP-LC3 intensities within Syp-SN puncta (C) or the normalized number of eGFP-LC3 puncta per unit axon length (D) in bleached and unbleached areas. C, Unbleached = 1 ± 0.057, n = 174 synapses, 3 independent experiments; bleached = 1.22 ± 0.073, n = 174 synapses, 3 independent experiments, p = 0.0173. D, Unbleached = 1 ± 0.221, n = 19 axons, 3 independent experiments; bleached = 2.35 ± 0.403, n = 21 axons, 3 independent experiments, p = 0.0071. E, F, Quantification of normalized eGFP-LC3 intensities within Syp-SN puncta (E) or number of eGFP-LC3 puncta per unit axon length (F) in culture treated with wortmannin before and after photobleaching. E, Unbleached = 1 ± 0.057, n = 179 synapses, 3 independent experiments; bleached = 0.95 ± 0.055, n = 164 synapses, 3 independent experiments. F, Unbleached = 1 ± 0.228, n = 18 axons, 3 independent experiments; bleached = 2.22 ± 0.348, n = 21 axons, 3 independent experiments, p = 0.0077. G, H, Images of hippocampal neurons expressing F-U6-scRNA(SC)-U-Syp-SN-P2A-eGFP-LC3 (G) or F-U6-shAtg5-U-Syp-SN-P2A-eGFP-LC3 (H) that were fixed and stained with antibodies against GFP and SN 2 h after photobleaching. I, J, Quantification of normalized eGFP-LC3 intensities within Syp-SN puncta (I) or the normalized number of eGFP-LC3 puncta per unit axon length (J) in cultures expressing F-U6-scRNA(SC)-U-Syp-SN-P2A-eGFP-LC3. I, Unbleached = 1 ± 0.058, n = 134 synapses, 3 independent experiments; bleached = 1.35 ± 0.073, n = 178 synapses, 3 independent experiments, p = 0.0001. J, Unbleached = 1 ± 0.090, n = 27 axons, 3 independent experiments; bleached = 1.67 ± 0.107, n = 27 axons, 3 independent experiments, p < 0.0001. K, L, Quantification of normalized eGFP-LC3 intensities within Syp-SN puncta (K) or number of eGFP-LC3 puncta per unit axon length (L) in cultures expressing F-U6-shAtg5-U-Syp-SN-P2A-eGFP-LC3. K, Unbleached = 1 ± 0.052, n = 109 synapses, 3 independent experiments; bleached = 0.98 ± 0.055, n = 127 synapses, 3 independent experiments. L, Unbleached = 1 ± 0.103, n = 27 axons, 3 independent experiments; bleached = 1.22 ± 0.122, n = 27 axons, 3 independent experiments. Scale bars, 10 μm. Error bars indicate SEM. Unpaired t test was used to evaluate statistical significance. *p < 0.05, **p < 0.01, ***p < 0.001, ****p < 0.0001.
Additionally, given the caveat that wortmannin is not a selective inhibitor for Vps34 (Bain et al., 2007), we made use of a knockdown approach using an shRNA against the autophagy-related protein Atg5 (shAtg5) to inhibit autophagy. To ensure coexpression of Syp-SN, eGFP-LC3, and the shRNA, a U6 promoter and the small hairpin RNA were integrated upstream into the vector FU-Syp-SN-P2A-eGFP-LC3 (F-U6-shAtg5-U-Syp-SN-P2A-eGFP-LC3). A scrambled shRNA (scRNA/SC) served as a control (F-U6-scRNA(SC)-U-Syp-SN-P2A-eGFP-LC3). Strikingly, neurons expressing the scRNA depict increased eGFP-LC3 levels at Syp-SN puncta as well as an increased number of eGFP-LC3 puncta along axon segments 2 h after bleaching (Fig. 6G,I,J), thus resembling earlier outcomes (Fig. 6A,C,D). However, when shAtg5 is additionally expressed in neurons, its presence inhibits the light-activated increase of synaptic eGFP-LC3 and the number of eGFP-LC3 puncta (Fig. 6H,K,L). These data confirm that ROS-induced eGFP-LC3 accumulation is dependent on canonical autophagy initiation.
ROS-induced damage to Syp promotes AV formation
The appearance of eGFP-LC3-positive puncta within the axons and presynaptic boutons of Syp-SN-expressing cells following photobleaching suggests that this insult induces the autophagic clearance of damaged SVs and their proteins. To formally test this hypothesis, we performed transmission electron microscopy of FU-Syp-SN-P2A-eGFP-LC3-expressing hippocampal neurons. Infected neurons grown on sapphire disks were photobleached with 563 nm light from a mercury lamp for 60 s. Similar to our live imaging experiments, a field diaphragm was used to create bleached and unbleached regions on the same sapphire disk before high pressure freezing and further processing for EM. The number of double-membraned organelles (AVs) within presynaptic boutons or SVs containing axonal varicosities were then quantified as performed previously (Okerlund et al., 2017) (Fig. 7A). Consistent with our light level studies (Fig. 3F), significantly more AVs per presynaptic terminal were observed 10 min after light-activated Syp damage within the bleached area compared with the unbleached area (Fig. 7C,D). Images analyzed ∼40 min after bleaching revealed a slight but nonsignificant increase in AVs/terminal (Fig. 7F,G). These data indicate that most newly formed autophagosomes leave the synapse.
Figure 7.

Syp-SN mediated ROS production increases AVs in presynaptic terminals. A, B, Example EM micrographs of organelles quantified as AVs (A) or MVBs (B). C, F, Representative EM micrographs of unbleached or bleached synapses 10 (C) or 40 (F) min after photobleaching. Arrowheads indicate double-membraned AVs. The number of AVs, but not MVBs, is significantly increased 10 min following Syp-SN-mediated ROS production. D, E, Quantification of the number of AVs (D) or MVBs (E) per terminal 10 min after photobleaching (D: unbleached = 0.05 ± 0.018, n = 228 synapses, 1 independent experiments; bleached = 0.17 ± 0.044, n = 198 synapses, 2 independent experiments, p = 0.0062; E: unbleached = 0.04 ± 0.013, n = 228 synapses, 2 independent experiments; bleached = 0.05 ± 0.016, n = 198 synapses, 2 independent experiments). G, H, Quantification of the number of AVs (G) or MVBs (H) per terminal 40 min after photobleaching (G: unbleached = 0.04 ± 0.016, n = 138 synapses, 2 independent experiments; bleached = 0.09 ± 0.028, n = 215 synapses, 2 independent experiments; H: unbleached = 0.05 ± 0.019, n = 138 synapses, 2 independent experiments; bleached = 0.05 ± 0.014, n = 215 synapses, 2 independent experiments). Scale bars, C, F, 300 nm; A, B, 200 nm. Error bars indicate SEM. Unpaired t test was used to evaluate statistical significance. **p < 0.01.
Conceptually, local ROS-induced damage of synaptic proteins could induce not only autophagy but also other degradative pathways, such as the endo-lysosomal system. One hallmark of the endo-lysosomal system is the appearance of multivesicular bodies (MVBs) (Ceccarelli et al., 1973; Raiborg and Stenmark, 2009). We thus examined whether the light-activated damage of Syp also induces the endo-lysosomal pathway by quantifying the presence of synaptic MVBs within photobleached presynaptic boutons by EM (Fig. 7B). Intriguingly, no change in their number was observed at either 10 or 40 min after photobleaching compared with unbleached boutons (Fig. 7E,H), indicating that the ROS-mediated damage of Syp primarily triggers the activation of autophagy. To confirm this observation, we also monitored whether markers of the endo-lysosomal pathway accumulated in presynaptic boutons following light-activated damage of Syp. Strikingly, levels of the late endosome marker Rab7 are increased at presynaptic boutons 5 min after bleaching (Fig. 8B,E) and stay elevated compared with the unbleached control for at least 2 more hours (Fig. 8E,G,I). Because Rab7 is also abundant on autophagosomes, we stained for another, more specific, MVB marker Chmp2b, which is part of the ESCRT-III complex (Vingtdeux et al., 2012). Interestingly, Chmp2b also accumulates at boutons 1 h after bleaching (Fig. 8C,H). These observations indicate that ROS-mediated damage to Syp/SVs may also engage other degradative pathways, such as the endo-lysosomal system.
Figure 8.

Syp-SN mediated ROS production increases eGFP-Rab7 and Chmp2b levels at presynaptic boutons. A, Schematic of FU-Syp-SN-P2A-eGFP-Rab7 expression vector. B–D, Images of hippocampal neurons expressing FU-Syp-SN-P2A-eGFP-Rab7 that were fixed and stained with antibodies against GFP, SN, and Chmp2b, 5 min, 1 h, and 2 h after Syp-SN-mediated ROS production. E, G, I, Quantification of the normalized eGFP-Rab7 intensity in Syp-SN puncta 5 min, 1 h, or 2 h after photobleaching of Syp-SN. E, Unbleached = 1 ± 0.052, n = 249 synapses, 4 independent experiments; bleached = 1.24 ± 0.066, n = 314 synapses, 4 independent experiments, p = 0.0063. G, Unbleached = 1 ± 0.050, n = 280 synapses, 4 independent experiments; bleached = 1.16 ± 0.053, n = 373 synapses, 4 independent experiments, p = 0.0376. I, Unbleached = 1 ± 0.046, n = 258 synapses, 4 independent experiments; bleached = 1.40 ± 0.083, n = 352 synapses, 4 independent experiments, p = 0.0001. Rab7 levels are significantly increased at all three times. F, H, J, Quantification of the normalized Chmp2b intensity in Syp-SN puncta 5 min, 1 h, or 2 h after photobleaching of Syp-SN. Levels are significantly increased at 1 h, but not 5 min or 2 h, after ROS-mediated damage. F, Unbleached = 1 ± 0.089, n = 67 synapses, 2 independent experiments; bleached = 1.44 ± 0.219, n = 71 synapses, 2 independent experiments. H, Unbleached = 1 ± 0.080, n = 91 synapses, 2 independent experiments; bleached = 1.45 ± 0.174, n = 89 synapses, 2 independent experiments, p = 0.0196. J, Unbleached = 1 ± 0.074, n = 108 synapses, 2 independent experiments; bleached = 1.23 ± 0.134, n = 118 synapses, 2 independent experiments. Scale bars, 10 μm. Error bars indicate SEM. Unpaired t test was used to evaluate statistical significance. *p < 0.05, **p < 0.01, ***p < 0.001.
ROS-induced damage to several presynaptic proteins induces presynaptic autophagy
As ROS generated by illuminating SN is anticipated to damage proteins only within 1–4 nm of the sources (Jacobson et al., 2008; Takemoto et al., 2013), it seems reasonable to predict that the induction of presynaptic autophagy is linked to the damage of proteins, which are then sorted and gathered into the interior of the newly forming autophagophore membrane. If true, the damage to other presynaptic proteins should also lead to the induction of autophagy (Fig. 9A).
To test this hypothesis, we coupled SN to two additional SV proteins, Syt, an integral membrane protein with a long cytoplasmic tail (Hilfiker et al., 1999; Chapman, 2002), and Syn, a larger cytosolic protein (Fig. 9A) that dynamically associates with the outer surface of SVs in an activity-dependent manner (Chi et al., 2001; Waites and Garner, 2011). To permit the simultaneous detection of presynaptic autophagy, we coexpressed Syt-SN or Syn-SN with eGFP-LC3 via our lentiviral vector (FU-Syt-SN-P2A-eGFP-LC3; FU-Syn-SN-P2A-eGFP-LC3). In control experiments, we confirmed that both Syt-SN and Syn-SN and eGFP-LC3 were appropriately processed and that Syt-SN and Syn-SN retained their ability to become selectively localized to presynaptic boutons (data not shown). As described above for Syp-SN, neurons infected at 2–3 DIV were bleached at 13–15 DIV for 60 s and the intensity of eGFP-LC3 within presynaptic boutons quantified. Interestingly, eGFP-LC3 intensity in Syt-SN and Syn-SN puncta as well as the number of eGFP-LC3 puncta along axons did not change within 5 min of photobleaching (Fig. 9B,E,H,K) compared with unbleached boutons. However, 1 h after light-activated damage to either Syt or Syn, eGFP-LC3 intensity significantly increased within presynaptic boutons immunopositive for Syt-SN (Fig. 9C,F) and Syn-SN (Fig. 9I,L). When fixed 2 h after ROS production, eGFP-LC3 levels remained slightly elevated at bleached Syn-SN-positive synapses (Fig. 9J,M) but returned to unbleached levels in Syt-SN-positive synapses (Fig. 9D,G). Together, these data indicate that, as Syp, the local ROS-mediated damage to Syt and the SV-associated protein Syn can induce presynaptic autophagy, albeit at attenuated slower rates. These data indicate that the induction of presynaptic autophagy is tightly coupled to ROS damage to synaptic proteins, and thus associated with the normal clearance of misfolded or damaged proteins.
SN-tagged proteins are more abundant in ROS-induced autophagy organelles than endogenous SV proteins
To date, several studies have demonstrated that autophagosomes form in axons upon starvation, rapamycin treatment as well as enhanced synaptic activity (Maday and Holzbaur, 2014; Wang et al., 2015) and become retrogradely transported along the axon toward the soma (Maday et al., 2012; Cheng et al., 2015a). An unresolved question is which synaptic proteins become associated with autophagic cargos. A related question is whether presynaptic autophagy leads to the en masse removal of SVs or whether it can selectively scavenge damaged proteins. Our ability to damage SV proteins with light and induce autophagy provides a unique opportunity to explore these questions. In an initial experiment, we examined whether Syp-SN appears in extrasynaptic eGFP-LC3-positive puncta following light-activated ROS production. To distinguish between synaptic and extrasynaptic eGFP-LC3 organelles, cultures were fixed and stained with antibodies against the presynaptic active zone protein Bassoon and quantified for the fraction of extrasynaptic eGFP-LC3 puncta-negative for Bassoon but positive for synaptic proteins 1 h after bleaching.
In experiments with Syp-SN, we observed that >70% of extrasynaptic eGFP-LC3 puncta (also referred to as autophagy cargo organelles) are positive for Syp-SN (Fig. 10A,D). This suggests that ROS-damaged Syp-SN is indeed a cargo of these organelles. To investigate whether the presence of Syp-SN in autophagy cargo organelles represents the en masse engulfment of SVs or the selective removal of this damaged protein, we monitored the distribution of endogenous Syt1 within the same neurons, a second core constituent of SVs, in extrasynaptic autophagy organelles following light-induced damage to Syp-SN. As Syt1 is not known to directly interact with Syp, we reasoned that the ROS-mediated damage to Syp-SN would not necessarily damage Syt on the same SV. Interestingly, the fraction of extrasynaptic autophagy organelles that are positive for Syt1 is dramatically smaller than the fraction of Syp-SN-positive autophagy cargo organelles (Fig. 10A,D).
Figure 10.

ROS-damaged SV proteins selectively accumulate in autophagy organelles. A–C, Images of hippocampal neurons expressing SN-tagged synaptic proteins Syp-SN (A), Syt-SN (B), or Syp-lumSN (C) that were fixed 1 h after bleaching and stained with antibodies against GFP, SN, Bassoon, and Syt1 (A,C) or Syp1 (B). D, Quantification of the fraction of extrasynaptic eGFP-LC3 puncta positive for SN-tagged Syp, indicated by arrowheads in A, or endogenous Syt1 within the same experiment (Syp-SN = 0.71 ± 0.075, n = 38 puncta, 3 independent experiments; Syt1 = 0.18 ± 0.064, n = 38 puncta, 3 independent experiments, p < 0.0001). Also quantified is the fraction of extrasynaptic Syp-SN puncta that are positive for eGFP-LC3 (0.43 ± 0.060, n = 68 puncta, 3 independent experiments). E, Quantification of the fraction of extrasynaptic eGFP-LC3 puncta positive for SN-tagged Syt, indicated by arrowheads (B), or endogenous Syp1 within the same experiment (Syt-SN = 0.70 ± 0.081, n = 33 puncta, 2 independent experiments; Syp1 = 0.18 ± 0.068, n = 33 puncta, 2 independent experiments, p < 0.0001). Also quantified is the fraction of extrasynaptic Syt-SN puncta that are positive for eGFP-LC3 (0.43 ± 0.068, n = 54 puncta, 2 independent experiments). F, Quantification of the fraction of extrasynaptic eGFP-LC3 puncta positive for luminal SN-tagged Syp (Syp-lumSN), indicated by arrowheads in C, or endogenous Syt1 within the same experiment (Syp-lumSN = 0.08 ± 0.033, n = 66 puncta, 3 independent experiments; Syt1 = 0.17 ± 0.046, n = 66 puncta, 3 independent experiments). Also quantified is the fraction of extrasynaptic Syp-lumSN puncta that are positive for eGFP-LC3 (0.51 ± 0.077, n = 43 puncta, 3 independent experiments). G, Images of hippocampal neurons expressing FU-eGFP-LC3 fixed and stained with antibodies against GFP, Bassoon, and Syp1, Syn1, or Syt1. H, Quantification of the fraction of extrasynaptic eGFP-LC3 puncta also positive for endogenous Syp1, Syn1, or Syt1. The fraction of extrasynaptic eGFP-LC3 puncta positive for Syp1 is significantly higher than the fraction positive for Syn1 (Syp1 basal = 0.40 ± 0.051, n = 93 puncta, 2 independent experiments; Syn1 basal = 0.14 ± 0.038, n = 85 puncta, 2 independent experiments; Syt1 basal = 0.28 ± 0.050, n = 81 puncta, 2 independent experiments). Scale bars, 10 μm. Error bars indicate SEM. Unpaired t test (D–F) and ANOVA Tukey's multiple-comparisons test (H) were used to evaluate statistical significance. ***p < 0.001, ****p < 0.0001.
To confirm the selectivity of autophagic cargo after SN-induced damage, we performed the experiment vice versa and quantified the fraction of Syt-SN-positive extrasynaptic autophagy cargo organelles 1 h after bleaching. As with Syp-SN, >65% of the extrasynaptic eGFP-LC3 puncta colocalized with Syt-SN, whereas only 18% of the endogenous Syp1 (Syp1) was present at these sites (Fig. 10B,E). These data indicate that the autophagic machinery within presynaptic boutons can detect and selectively remove damaged SV proteins.
The selectivity of the autophagic cargo points toward a selective tagging of the damaged SN fusion protein. This tagging likely happens at the cytoplasmic side of the SVs as this is where the degradation machinery is located. To test this hypothesis, we fused SN to Syp between the third and fourth transmembrane domain, resulting in a luminal SN (FU-Syp-lumSN-P2A-eGFP-LC3). Here, we did not observe an accumulation of eGFP-LC3 at bleached Syp-lumSN-positive boutons (data not shown). Intriguingly, the fraction of Syp-lumSN-positive extrasynaptic autophagy cargo organelles is very low (Fig. 10C,F) compared with Syp-SN (Fig. 10D), indicating that bleached Syp-lumSN does not become cargo of autophagy organelles after ROS-induced autophagy.
The low but significant presence of endogenous Syp1 and Syt1 in eGFP-LC3 puncta could arise either from the peripheral damage of ROS or be part of the basal flux of these proteins through this pathway. We thus examined whether, under basal conditions, endogenous Syp1 and Syt1 versus Syn1 associate with extrasynaptic eGFP-LC3 puncta. Here, we observed that higher levels of both endogenous Syp1 and Syt1 were found at extrasynaptic eGFP-LC3 puncta compared with Syn1 (Fig. 10G,H). These data indicate that these former SV proteins may be cleared through this degradative pathway also under basal conditions. Additionally, these data indicate that autophagy plays a minor role in the clearance of Syn1.
Synaptic autophagy acts as a beneficial surveillance mechanism maintaining synapse function
A fundamental question within the synaptic proteostasis field is what roles do different clearance systems play during synaptic transmission. Most studies to date on autophagy rely either on the analysis of genetic ablation and inactivation of key autophagic proteins (Atg5 and Atg7) (Rubinsztein et al., 2011; Russell et al., 2014) or the activation of autophagy with drugs, such as rapamycin, none of which are specific for the synapse and generally trigger a homeostatic response from other systems masking a specific role of autophagy in the system. Having shown that light-activated ROS production can be used to rapidly (5 min) trigger the autophagic clearance of selectively damaged SV proteins, we were keen to explore whether presynaptic autophagy contributes to the real-time maintenance of synaptic function.
We therefore performed electrophysiological experiments. EPSC amplitudes were recorded from autaptic neurons, infected with FU-Syp-SN-P2A-eGFP-LC3 lentivirus at 2–3 DIV, at 13–18 DIV. Interestingly, bleaching alone did not robustly change the ESPC amplitude (Fig. 11A,D), and neither did treatment with 1 μm wortmannin without bleaching (Fig. 11B,D). However, under autophagy inhibition with 1 μm wortmannin, light-activated ROS production leads to a significant decrease in EPSC amplitudes (Fig. 11C,D). A similar effect could be observed when autophagy was inhibited by knocking down Atg5. Intriguingly, neurons expressing shRNA against Atg5 (shAtg5) alone did not show an altered EPSC amplitude (Fig. 11F,H), indicating that basal autophagy is not necessary for synapse function. However, challenging the system through the light-activated ROS production leads to a significant decrease of the EPSC amplitude in neurons expressing shAtg5 (Fig. 11G,H) but not in neurons expressing scrambled shRNA (Fig. 11E,H). Together, these data nicely support the hypothesis that autophagy can play a real-time role in the maintenance of synaptic transmission helping the synaptic terminals to cope with protein-damaging insults.
Figure 11.
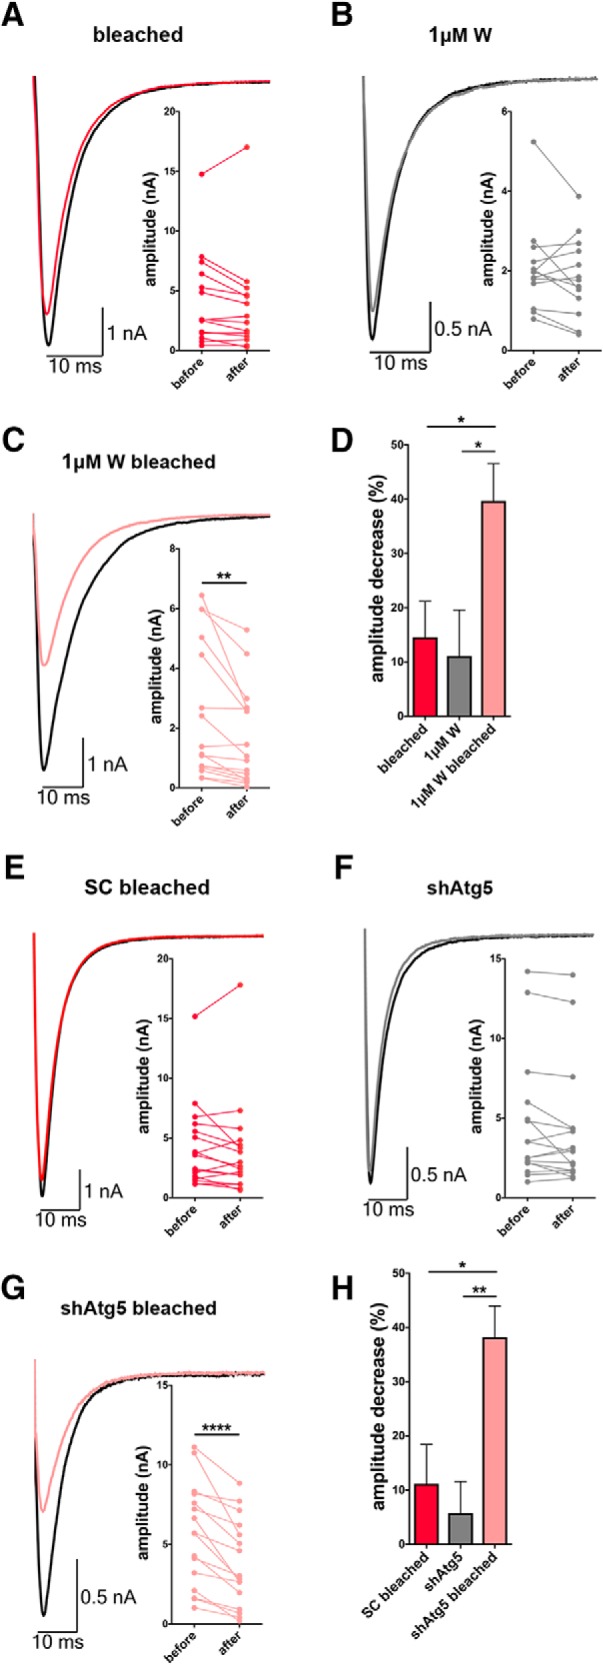
ROS-induced damage to Syp-SN impairs evoked release only when autophagy is inhibited. A–C, Example traces of whole-cell patch recordings of evoked EPSCs from autaptic hippocampal neurons expressing FU-Syp-SN-P2A-eGFP-LC3 before and 5 min after ROS-induced damage to Syp-SN either in the absence (A) or the presence of 1 μm wortmannin (W) (C). Neurons treated with wortmannin but were not bleached served as a control (B). A, Amplitude: before = 4.25 ± 1.050, after = 3.74 ± 1.134, 14 neurons, 3 independent experiments. B, Amplitude: before = 2.07 ± 0.311, after = 1.85 ± 0.277, 13 neurons, 3 independent experiments. C, Amplitude: before = 2.50 ± 0.570, after = 1.63 ± 0.409, 16 neurons, 3 independent experiments, p = 0.0042. D, Quantification of the percentage decrease in EPSC amplitude after photobleaching (A, C) or waiting period (B). The decrease in amplitude is significantly higher when 1 μm wortmannin is present (bleached = 14.57 ± 6.620, n = 14 neurons, 3 independent experiments; 1 μm W = 11.09 ± 8.479, n = 13 neurons, 3 independent experiments; 1 μm W bleached = 39.69 ± 6.869, n = 16 neurons, 3 independent experiments, p = 0.0445 and p = 0.0223). E–G, Example traces of whole-cell patch recordings of evoked EPSCs from autaptic hippocampal neurons expressing F-U6-scRNA(SC)-U-Syp-SN-P2A-eGFP-LC3 (E) or F-U6-shAtg5-U-Syp-SN-P2A-eGFP-LC3 (G) before and 5 min after ROS-induced damage to Syp-SN. Neurons expressing F-U6-shAtg5-U-Syp-SN-P2A-eGFP-LC3 that were not bleached served as a control (F). E, Amplitude: before = 4.23 ± 0.853, after = 3.87 ± 0.980, 17 neurons, 3 independent experiments. F, Amplitude: before = 4.60 ± 0.987, after = 4.22 ± 0.962, 16 neurons, 3 independent experiments. G, Amplitude: before = 5.58 ± 0.800, after = 3.79 ± 0.687, 16 neurons, 3 independent experiments, p < 0.0001. H, Quantification of the percentage decrease in EPSC amplitude after photobleaching (E, G) or waiting period (F). The decrease in amplitude is significantly higher in F-U6-shAtg5-U-Syp-SN-P2A-eGFP-LC3-expressing neurons that were bleached (SC bleached = 11.15 ± 7.261, n = 17 neurons, 3 independent experiments; shAtg5 = 5.74 ± 5.836, n = 16 neurons, 3 independent experiments; shAtg5 bleached = 38.19 ± 5.766, n = 16 neurons, 3 independent experiments, p = 0.0114 and p = 0.0024). Error bars indicate SEM. Paired t test (A–C, E–G) and ANOVA Tukey's multiple-comparisons test (D, H) were used to evaluate statistical significance. *p < 0.05, **p < 0.01, ****p < 0.0001.
Discussion
Mechanisms regulating quality control and turnover of synaptic proteins are fundamental to synapse integrity; however, they are not well understood. In this study, we provide evidence that autophagy can be rapidly induced within presynaptic boutons either by rapamycin or by the selective damage of SV proteins through superoxides. The time range of autophagy induction is consistent with the concept that the machinery is maintained and regulated within presynaptic boutons. Our data also suggest a real-time role for autophagy in maintaining synaptic function, as without it the accumulation of damaged SV proteins can compromise synaptic transmission.
A prerequisite for a real-time functionality for autophagy within presynaptic boutons is its activation on short time scales after insults that damage presynaptic proteins. Studies show that autophagic organelles appear within axons and presynaptic boutons 3–7 h following the addition of rapamycin (Hernandez et al., 2012) or 48 h after treatment with Sonic Hedgehog (Petralia et al., 2013). A high potassium stimulus also increased the appearance of LC3-positive puncta within tens of minutes in axons (Wang et al., 2015) and dendritic spines (Shehata et al., 2012), indicating that the autophagic machinery can be activated within different neuronal compartments. Mechanistically, Bassoon, as well as presynaptic proteins, such as Rab26 and Endophilin A, have been functionally linked to autophagy (Binotti et al., 2015; Soukup et al., 2016; Okerlund et al., 2017; Vanhauwaert et al., 2017) of which Atg5, Atg16, LC3, and p62 have been localized to presynaptic boutons (Okerlund et al., 2017). However, as autophagosomes are highly mobile (Maday et al., 2012; Cheng et al., 2015b), it remains unclear whether they arise within boutons or simply accumulate there.
In the current study, we developed a lentiviral vector, expressing an SV protein and the autophagy marker LC3 to monitor autophagic structures in real time. Similar to earlier studies (Hernandez et al., 2012), we observed low basal autophagy levels within axons (Fig. 1F). However, eGFP-LC3 levels increase within 10 min within presynaptic boutons and axons following 2 μm rapamycin treatment (Fig. 1G,K,L). The rapid LC3 increase seen on the light microscopy level could also be seen in Western blot analyses using synaptosomes (Fig. 2E). Synaptic eGFP-LC3 accumulation appears to be due to elevated autophagy as its increase was blocked by 1 μm wortmannin and Atg5 knockdown (Figs. 1N–P, 6K,L) (Codogno et al., 2011; Mizushima et al., 2011).
Although the induction of presynaptic autophagy is faster than previously recognized, the addition of rapamycin is neither specific for any one neuronal compartment, nor a natural inducer of autophagy (Deng et al., 2017). Therefore, we developed a vector system that allows us to generate a spatiotemporally controlled insult within presynaptic boutons. Here, we made use of the fact that free radicals trigger the damage of proteins in vivo (Jarvela and Linstedt, 2014) and tagged synaptic proteins with the genetically encoded photosensitizer SN (Takemoto et al., 2013). With similar approaches, it has been possible to acutely damage mitochondria and induce mitophagy (Yang and Yang, 2011; Wang et al., 2012; Ashrafi et al., 2014).
ROS-induced damage of Syp led to a rapid induction of autophagy, indicated by the accumulation of eGFP-LC3 within presynaptic boutons within 5 min and its spread into axons over time (1–2 h) (Fig. 3I,K). The fast temporal accumulation of LC3 in boutons was also observed for autophagic vacuoles, as detected by electron microscopy (Fig. 7D). These data indicate that the autophagy machinery is present within presynaptic terminals and can be engaged following a local insult to SV proteins within minutes.
A fundamental question raised by our study is whether ROS damage to SV proteins exclusively turns on autophagy as the clearance mechanism or multiple protein degradation systems. The endo-lysosomal system has been reported to also clear SV proteins in response to ongoing synaptic activity (Uytterhoeven et al., 2011; Sheehan et al., 2016). One hallmark of this pathway is the appearance of MVBs (Raiborg and Stenmark, 2009). We failed to observe an increase in the number of synaptic MVBs on electron microscopy level (Fig. 7E,H), indicating that, in contrast to autophagy, the endo-lysosomal system is not robustly engaged by ROS-mediated protein damage. However, monitoring Rab7 and Chmp2b levels (Stenmark, 2009; Sheehan et al., 2016) by light microscopy, we did observe a modest increase in their colocalization with Syp-SN, following ROS production (Fig. 8). Thus, we cannot presently rule out that ROS-mediated damage to SV proteins can also trigger the activation of several degradative systems. Interestingly, Sheehan et al. (2016) show that only a subset of SV proteins are preferentially degraded by the endo-lysosomal system, highlighting the importance to address in the future if distinct SV proteins are degraded via specific and therefore separate pathways and how they are being tagged.
Our data indicate that autophagy induction is not solely dependent on the damage of Syp, as the destruction of Syt as well as Syn also leads to elevated autophagy levels at presynapses (Fig. 9). However, for Syt-SN and Syn-SN, eGFP-LC3 levels increased with a slower time course (∼1 h) (Fig. 9). The discrepancy could be due to differences in what fraction of SV proteins are damaged by ROS, a situation that would be influenced by the relative abundance of the SN-tagged proteins and/or the number of juxtaposed SV proteins that are additionally damaged by ROS. Interestingly, Syp has the highest copy number per SV compared with Syt and Syn (Takamori et al., 2006). Future studies could help resolve this issue and/or whether some SV proteins are more directly linked to the induction of synaptic autophagy.
An additional question raised by our study is whether the clearance mechanisms triggered by ROS-mediated damage lead to the selective removal of only the damaged SV protein or the elimination of the entire SV. Indeed, ∼70% of extrasynaptic eGFP-LC3 puncta were also positive for Syp-SN following ROS-mediated damage (Fig. 10D). Intriguingly, a much smaller fraction (18%) of these puncta were also positive for endogenous SV protein Syt, which does not directly interact with Syp (Bonanomi et al., 2007; Rizzoli, 2014). These data suggest that presynaptic autophagy can specifically remove damaged SV proteins from synapses. This concept is supported by a reciprocal experiment performed with neurons expressing Syt-SN. Here, we also observed a dramatic recruitment of Syt-SN into extrasynaptic eGFP-LC3 puncta, but only modest levels of endogenous Syp (Fig. 10E), implying that ROS-mediated damage caused by SN is rather limited and primarily affects juxtaposed proteins, a concept consistent with the low quantum yield of SN (Shu et al., 2011; Trewin et al., 2018) and the limited damage half-radius of 3–4 nm (Takemoto et al., 2013). Importantly, the inability of photobleaching luminally localized SN to trigger the sorting of Syp-lumSN into autophagy organelles (Fig. 10F) indicates that ROS damage has to occur on the cytoplasm face of SV proteins to be recognizable for the autophagic machinery. Conceptually, a selective removal model also makes metabolic sense, as it would allow for the differential removal of specific misfolded or damaged proteins, consistent with different half-lives of SV proteins (Cohen et al., 2013). Although the mechanism of selective removal remains unclear, we hypothesize that SV proteins are directly removed from SVs or that their removal is dependent on an intermediary endosomal sorting step. Further studies will be necessary to discriminate between these options.
The rapid induction of presynaptic autophagy within minutes suggests that autophagy possibly has real-time functions at synapses (e.g., helping to maintain synaptic health and integrity). Studies by Lin et al. (2013) showed that tagging Syp with miniSOG leads to a real-time disruption of neurotransmitter release following light activation. In contrast, in our experiments with Syp-SN, we did not observe an overt change in synaptic function, assessed by the evoked release of neurotransmitter following light-activated ROS production (Fig. 11). This suggests that protein damage caused by Syp-SN radiation is less potent than that induced with miniSOG-Syp. Intriguingly, when the induction of autophagy was blocked during ROS-mediated damage of Syp-SN, the evoked EPSC amplitudes were reduced (Fig. 11), indicating that, upon autophagy inhibition, damaged synaptic proteins accumulate within presynaptic terminals having a direct impact on neurotransmitter release and thus EPSC amplitude. Conceptually, the decrease in EPSC amplitude could also be explained by a postsynaptic effect (e.g., a downregulation of postsynaptic receptors). Given that SN is directly tethered to an SV protein, the most likely effect of ROS is on the neurotransmitter release machinery, a concept requiring further study. Either way, our electrophysiological data suggest that synaptic autophagy can function in real time to remove damaged SV proteins, contributing to the maintenance of synaptic function. This is consistent with the rapid increase in presynaptic autophagy following ROS-mediated damage (Fig. 3).
Together, SN appears to represent a powerful tool to spatiotemporally induce damage to synapses and thus increase our understanding of how different clearance systems function during both health and disease. This will be particularly important for the study of neurodegenerative disease where the proper function of autophagy is thought to be crucial for neuronal health (Rubinsztein et al., 2012; Nixon, 2013).
Footnotes
This work was supported by Deutsches Zentrum für Neurodegenerative Erkrankungen, Deutsche Forschungsgemeinschaft SFB958 to C.C.G. We thank Prof. Eckart D. Gundelfinger and Noam E. Ziv for discussion and valuable comments on the manuscript; Anny Kretschmer, Katja Czieselsky, Bettina Brokowski and Katja Poetschke for technical assistance; and the Virus Core Facility of the Charité-Universitätsmedizin Berlin for virus production.
The authors declare no competing financial interests.
References
- Ashrafi et al., 2014. Ashrafi G, Schlehe JS, LaVoie MJ, Schwarz TL (2014) Mitophagy of damaged mitochondria occurs locally in distal neuronal axons and requires PINK1 and parkin. J Cell Biol 206:655–670. 10.1083/jcb.201401070 [DOI] [PMC free article] [PubMed] [Google Scholar]
- Bain et al., 2007. Bain J, Plater L, Elliott M, Shpiro N, Hastie CJ, McLauchlan H, Klevernic I, Arthur JS, Alessi DR, Cohen P (2007) The selectivity of protein kinase inhibitors: a further update. Biochem J 408:297–315. 10.1042/BJ20070797 [DOI] [PMC free article] [PubMed] [Google Scholar]
- Banker and Goslin, 1988. Banker G, Goslin K (1988) Developments in neuronal cell culture. Nature 336:185–186. 10.1038/336185a0 [DOI] [PubMed] [Google Scholar]
- Binotti et al., 2015. Binotti B, Pavlos NJ, Riedel D, Wenzel D, Vorbrüggen G, Schalk AM, Kühnel K, Boyken J, Erck C, Martens H, Chua JJ, Jahn R (2015) The GTPase Rab26 links synaptic vesicles to the autophagy pathway. Elife 4:e05597. 10.7554/eLife.05597 [DOI] [PMC free article] [PubMed] [Google Scholar]
- Boland et al., 2008. Boland B, Kumar A, Lee S, Platt FM, Wegiel J, Yu WH, Nixon RA (2008) Autophagy induction and autophagosome clearance in neurons: relationship to autophagic pathology in Alzheimer's disease. J Neurosci 28:6926–6937. 10.1523/JNEUROSCI.0800-08.2008 [DOI] [PMC free article] [PubMed] [Google Scholar]
- Bonanomi et al., 2007. Bonanomi D, Rusconi L, Colombo CA, Benfenati F, Valtorta F (2007) Synaptophysin I selectively specifies the exocytic pathway of synaptobrevin 2/VAMP2. Biochem J 404:525–534. 10.1042/BJ20061907 [DOI] [PMC free article] [PubMed] [Google Scholar]
- Bulina et al., 2006. Bulina ME, Chudakov DM, Britanova OV, Yanushevich YG, Staroverov DB, Chepurnykh TV, Merzlyak EM, Shkrob MA, Lukyanov S, Lukyanov KA (2006) A genetically encoded photosensitizer. Nat Biotechnol 24:95–99. 10.1038/nbt1175 [DOI] [PubMed] [Google Scholar]
- Carpenter and Cantley, 1996. Carpenter CL, Cantley LC (1996) Phosphoinositide kinases. Curr Opin Cell Biol 8:153–158. 10.1016/S0955-0674(96)80060-3 [DOI] [PubMed] [Google Scholar]
- Ceccarelli et al., 1973. Ceccarelli B, Hurlbut WP, Mauro A (1973) Turnover of transmitter and synaptic vesicles at the frog neuromuscular junction. J Cell Biol 57:499–524. 10.1083/jcb.57.2.499 [DOI] [PMC free article] [PubMed] [Google Scholar]
- Chang et al., 2018. Chang S, Trimbuch T, Rosenmund C (2018) Synaptotagmin-1 drives synchronous Ca(2+)-triggered fusion by C2B-domain-mediated synaptic-vesicle-membrane attachment. Nat Neurosci 21:33–40. 10.1038/s41593-017-0037-5 [DOI] [PMC free article] [PubMed] [Google Scholar]
- Chapman, 2002. Chapman ER. (2002) Synaptotagmin: a Ca(2+) sensor that triggers exocytosis? Nat Rev Mol Cell Biol 3:498–508. 10.1038/nrm855 [DOI] [PubMed] [Google Scholar]
- Cheng et al., 2015a. Cheng XT, Zhou B, Lin MY, Cai Q, Sheng ZH (2015a) Axonal autophagosomes recruit dynein for retrograde transport through fusion with late endosomes. J Cell Biol 209:377–386. 10.1083/jcb.201412046 [DOI] [PMC free article] [PubMed] [Google Scholar]
- Cheng et al., 2015b. Cheng XT, Zhou B, Lin MY, Cai Q, Sheng ZH (2015b) Axonal autophagosomes use the ride-on service for retrograde transport toward the soma. Autophagy 11:1434–1436. 10.1080/15548627.2015.1062203 [DOI] [PMC free article] [PubMed] [Google Scholar]
- Chi et al., 2001. Chi P, Greengard P, Ryan TA (2001) Synapsin dispersion and reclustering during synaptic activity. Nat Neurosci 4:1187–1193. 10.1038/nn756 [DOI] [PubMed] [Google Scholar]
- Chu et al., 2007. Chu CT, Zhu J, Dagda R (2007) Beclin 1-independent pathway of damage-induced mitophagy and autophagic stress: implications for neurodegeneration and cell death. Autophagy 3:663–666. 10.4161/auto.4625 [DOI] [PMC free article] [PubMed] [Google Scholar]
- Codogno et al., 2011. Codogno P, Mehrpour M, Proikas-Cezanne T (2011) Canonical and non-canonical autophagy: variations on a common theme of self-eating? Nat Rev Mol Cell Biol 13:7–12. 10.1038/nrm3249 [DOI] [PubMed] [Google Scholar]
- Cohen et al., 2013. Cohen LD, Zuchman R, Sorokina O, Müller A, Dieterich DC, Armstrong JD, Ziv T, Ziv NE (2013) Metabolic turnover of synaptic proteins: kinetics, interdependencies and implications for synaptic maintenance. PLoS One 8:e63191. 10.1371/journal.pone.0063191 [DOI] [PMC free article] [PubMed] [Google Scholar]
- Deng et al., 2017. Deng Z, Purtell K, Lachance V, Wold MS, Chen S, Yue Z (2017) Autophagy receptors and neurodegenerative diseases. Trends Cell Biol 27:491–504. 10.1016/j.tcb.2017.01.001 [DOI] [PubMed] [Google Scholar]
- Ebrahimi-Fakhari et al., 2011. Ebrahimi-Fakhari D, Cantuti-Castelvetri I, Fan Z, Rockenstein E, Masliah E, Hyman BT, McLean PJ, Unni VK (2011) Distinct roles in vivo for the ubiquitin-proteasome system and the autophagy-lysosomal pathway in the degradation of alpha-synuclein. J Neurosci 31:14508–14520. 10.1523/JNEUROSCI.1560-11.2011 [DOI] [PMC free article] [PubMed] [Google Scholar]
- Fleming et al., 2011. Fleming A, Noda T, Yoshimori T, Rubinsztein DC (2011) Chemical modulators of autophagy as biological probes and potential therapeutics. Nat Chem Biol 7:9–17. 10.1038/nchembio.500 [DOI] [PubMed] [Google Scholar]
- Galluzzi et al., 2016. Galluzzi L, Bravo-San Pedro JM, Blomgren K, Kroemer G (2016) Autophagy in acute brain injury. Nat Rev Neurosci 17:467–484. 10.1038/nrn.2016.51 [DOI] [PubMed] [Google Scholar]
- Gibson et al., 2009. Gibson DG, Young L, Chuang RY, Venter JC, Hutchison CA 3rd, Smith HO (2009) Enzymatic assembly of DNA molecules up to several hundred kilobases. Nat Methods 6:343–345. 10.1038/nmeth.1318 [DOI] [PubMed] [Google Scholar]
- Gordon and Cousin, 2014. Gordon SL, Cousin MA (2014) The sybtraps: control of synaptobrevin traffic by synaptophysin, alpha-synuclein and AP-180. Traffic 15:245–254. 10.1111/tra.12140 [DOI] [PMC free article] [PubMed] [Google Scholar]
- Hara et al., 2006. Hara T, Nakamura K, Matsui M, Yamamoto A, Nakahara Y, Suzuki-Migishima R, Yokoyama M, Mishima K, Saito I, Okano H, Mizushima N (2006) Suppression of basal autophagy in neural cells causes neurodegenerative disease in mice. Nature 441:885–889. 10.1038/nature04724 [DOI] [PubMed] [Google Scholar]
- Hernandez et al., 2012. Hernandez D, Torres CA, Setlik W, Cebrián C, Mosharov EV, Tang G, Cheng HC, Kholodilov N, Yarygina O, Burke RE, Gershon M, Sulzer D (2012) Regulation of presynaptic neurotransmission by macroautophagy. Neuron 74:277–284. 10.1016/j.neuron.2012.02.020 [DOI] [PMC free article] [PubMed] [Google Scholar]
- Hilfiker et al., 1999. Hilfiker S, Pieribone VA, Nordstedt C, Greengard P, Czernik AJ (1999) Regulation of synaptotagmin I phosphorylation by multiple protein kinases. J Neurochem 73:921–932. 10.1046/j.1471-4159.1999.0730921.x [DOI] [PubMed] [Google Scholar]
- Jacobson et al., 2008. Jacobson K, Rajfur Z, Vitriol E, Hahn K (2008) Chromophore-assisted laser inactivation in cell biology. Trends Cell Biol 18:443–450. 10.1016/j.tcb.2008.07.001 [DOI] [PMC free article] [PubMed] [Google Scholar]
- Jarvela and Linstedt, 2014. Jarvela TS, Linstedt AD (2014) The application of KillerRed for acute protein inactivation in living cells. Curr Protoc Cytom 69:12.35.1–12.35.10. 10.1002/0471142956.cy1235s69 [DOI] [PMC free article] [PubMed] [Google Scholar]
- Jiang et al., 2010. Jiang X, Litkowski PE, Taylor AA, Lin Y, Snider BJ, Moulder KL (2010) A role for the ubiquitin-proteasome system in activity-dependent presynaptic silencing. J Neurosci 30:1798–1809. 10.1523/JNEUROSCI.4965-09.2010 [DOI] [PMC free article] [PubMed] [Google Scholar]
- Johansen and Lamark, 2011. Johansen T, Lamark T (2011) Selective autophagy mediated by autophagic adapter proteins. Autophagy 7:279–296. 10.4161/auto.7.3.14487 [DOI] [PMC free article] [PubMed] [Google Scholar]
- Kim et al., 2011. Kim JH, Lee SR, Li LH, Park HJ, Park JH, Lee KY, Kim MK, Shin BA, Choi SY (2011) High cleavage efficiency of a 2A peptide derived from porcine teschovirus-1 in human cell lines, zebrafish and mice. PLoS One 6:e18556. 10.1371/journal.pone.0018556 [DOI] [PMC free article] [PubMed] [Google Scholar]
- Klionsky et al., 2012. Klionsky DJ, Abdalla FC, Abeliovich H, Abraham RT, Acevedo-Arozena A, Adeli K, Agholme L, Agnello M, Agostinis P, Aguirre-Ghiso JA, Ahn HJ, Ait-Mohamed O, Ait-Si-Ali S, Akematsu T, Akira S, Al-Younes HM, Al-Zeer MA, Albert ML, Albin RL, Alegre-Abarrategui J, et al. (2012) Guidelines for the use and interpretation of assays for monitoring autophagy. Autophagy 8:445–544. 10.4161/auto.19496 [DOI] [PMC free article] [PubMed] [Google Scholar]
- Komatsu et al., 2006. Komatsu M, Waguri S, Chiba T, Murata S, Iwata J, Tanida I, Ueno T, Koike M, Uchiyama Y, Kominami E, Tanaka K (2006) Loss of autophagy in the central nervous system causes neurodegeneration in mice. Nature 441:880–884. 10.1038/nature04723 [DOI] [PubMed] [Google Scholar]
- Lee et al., 2010. Lee JH, Yu WH, Kumar A, Lee S, Mohan PS, Peterhoff CM, Wolfe DM, Martinez-Vicente M, Massey AC, Sovak G, Uchiyama Y, Westaway D, Cuervo AM, Nixon RA (2010) Lysosomal proteolysis and autophagy require presenilin 1 and are disrupted by Alzheimer-related PS1 mutations. Cell 141:1146–1158. 10.1016/j.cell.2010.05.008 [DOI] [PMC free article] [PubMed] [Google Scholar]
- Lemasters, 2014. Lemasters JJ. (2014) Variants of mitochondrial autophagy: types 1 and 2 mitophagy and micromitophagy (Type 3). Redox Biol 2:749–754. 10.1016/j.redox.2014.06.004 [DOI] [PMC free article] [PubMed] [Google Scholar]
- Li et al., 2010. Li L, Tasic B, Micheva KD, Ivanov VM, Spletter ML, Smith SJ, Luo L (2010) Visualizing the distribution of synapses from individual neurons in the mouse brain. PLoS One 5:e11503. 10.1371/journal.pone.0011503 [DOI] [PMC free article] [PubMed] [Google Scholar]
- Liang and Sigrist, 2018. Liang Y, Sigrist S (2018) Autophagy and proteostasis in the control of synapse aging and disease. Curr Opin Neurobiol 48:113–121. 10.1016/j.conb.2017.12.006 [DOI] [PubMed] [Google Scholar]
- Lilienbaum, 2013. Lilienbaum A. (2013) Relationship between the proteasomal system and autophagy. Int J Biochem Mol Biol 4:1–26. [PMC free article] [PubMed] [Google Scholar]
- Lin et al., 2013. Lin JY, Sann SB, Zhou K, Nabavi S, Proulx CD, Malinow R, Jin Y, Tsien RY (2013) Optogenetic inhibition of synaptic release with chromophore-assisted light inactivation (CALI). Neuron 79:241–253. 10.1016/j.neuron.2013.05.022 [DOI] [PMC free article] [PubMed] [Google Scholar]
- Linden et al., 1992. Linden KG, Liao JC, Jay DG (1992) Spatial specificity of chromophore assisted laser inactivation of protein function. Biophys J 61:956–962. 10.1016/S0006-3495(92)81902-1 [DOI] [PMC free article] [PubMed] [Google Scholar]
- Lois et al., 2002. Lois C, Hong EJ, Pease S, Brown EJ, Baltimore D (2002) Germline transmission and tissue-specific expression of transgenes delivered by lentiviral vectors. Science 295:868–872. 10.1126/science.1067081 [DOI] [PubMed] [Google Scholar]
- Maas et al., 2012. Maas C, Torres VI, Altrock WD, Leal-Ortiz S, Wagh D, Terry-Lorenzo RT, Fejtova A, Gundelfinger ED, Ziv NE, Garner CC (2012) Formation of Golgi-derived active zone precursor vesicles. J Neurosci 32:11095–11108. 10.1523/JNEUROSCI.0195-12.2012 [DOI] [PMC free article] [PubMed] [Google Scholar]
- Maday and Holzbaur, 2014. Maday S, Holzbaur EL (2014) Autophagosome biogenesis in primary neurons follows an ordered and spatially regulated pathway. Dev Cell 30:71–85. 10.1016/j.devcel.2014.06.001 [DOI] [PMC free article] [PubMed] [Google Scholar]
- Maday et al., 2012. Maday S, Wallace KE, Holzbaur EL (2012) Autophagosomes initiate distally and mature during transport toward the cell soma in primary neurons. J Cell Biol 196:407–417. 10.1083/jcb.201106120 [DOI] [PMC free article] [PubMed] [Google Scholar]
- Martinez-Vicente et al., 2010. Martinez-Vicente M, Talloczy Z, Wong E, Tang G, Koga H, Kaushik S, de Vries R, Arias E, Harris S, Sulzer D, Cuervo AM (2010) Cargo recognition failure is responsible for inefficient autophagy in Huntington's disease. Nat Neurosci 13:567–576. 10.1038/nn.2528 [DOI] [PMC free article] [PubMed] [Google Scholar]
- Mauthe et al., 2018. Mauthe M, Orhon I, Rocchi C, Zhou X, Luhr M, Hijlkema KJ, Coppes RP, Engedal N, Mari M, Reggiori F (2018) Chloroquine inhibits autophagic flux by decreasing autophagosome-lysosome fusion. Autophagy 14:1435–1455. 10.1080/15548627.2018.1474314 [DOI] [PMC free article] [PubMed] [Google Scholar]
- Meberg and Miller, 2003. Meberg PJ, Miller MW (2003) Culturing hippocampal and cortical neurons. Methods Cell Biol 71:111–127. 10.1016/S0091-679X(03)01007-0 [DOI] [PubMed] [Google Scholar]
- Mizushima et al., 2010. Mizushima N, Yoshimori T, Levine B (2010) Methods in mammalian autophagy research. Cell 140:313–326. 10.1016/j.cell.2010.01.028 [DOI] [PMC free article] [PubMed] [Google Scholar]
- Mizushima et al., 2011. Mizushima N, Yoshimori T, Ohsumi Y (2011) The role of Atg proteins in autophagosome formation. Annu Rev Cell Dev Biol 27:107–132. 10.1146/annurev-cellbio-092910-154005 [DOI] [PubMed] [Google Scholar]
- Nixon, 2013. Nixon RA. (2013) The role of autophagy in neurodegenerative disease. Nat Med 19:983–997. 10.1038/nm.3232 [DOI] [PubMed] [Google Scholar]
- Nixon et al., 2005. Nixon RA, Wegiel J, Kumar A, Yu WH, Peterhoff C, Cataldo A, Cuervo AM (2005) Extensive involvement of autophagy in Alzheimer disease: an immuno-electron microscopy study. J Neuropathol Exp Neurol 64:113–122. 10.1093/jnen/64.2.113 [DOI] [PubMed] [Google Scholar]
- Okerlund et al., 2017. Okerlund ND, Schneider K, Leal-Ortiz S, Montenegro-Venegas C, Kim SA, Garner LC, Waites CL, Gundelfinger ED, Reimer RJ, Garner CC (2017) Bassoon controls presynaptic autophagy through Atg5. Neuron 93:897–913.e7. 10.1016/j.neuron.2017.01.026 [DOI] [PubMed] [Google Scholar]
- Petralia et al., 2013. Petralia RS, Schwartz CM, Wang YX, Kawamoto EM, Mattson MP, Yao PJ (2013) Sonic hedgehog promotes autophagy in hippocampal neurons. Biol Open 2:499–504. 10.1242/bio.20134275 [DOI] [PMC free article] [PubMed] [Google Scholar]
- Raiborg and Stenmark, 2009. Raiborg C, Stenmark H (2009) The ESCRT machinery in endosomal sorting of ubiquitylated membrane proteins. Nature 458:445–452. 10.1038/nature07961 [DOI] [PubMed] [Google Scholar]
- Rizzoli, 2014. Rizzoli SO. (2014) Synaptic vesicle recycling: steps and principles. EMBO J 33:788–822. 10.1002/embj.201386357 [DOI] [PMC free article] [PubMed] [Google Scholar]
- Rubinsztein et al., 2011. Rubinsztein DC, Mariño G, Kroemer G (2011) Autophagy and aging. Cell 146:682–695. 10.1016/j.cell.2011.07.030 [DOI] [PubMed] [Google Scholar]
- Rubinsztein et al., 2012. Rubinsztein DC, Codogno P, Levine B (2012) Autophagy modulation as a potential therapeutic target for diverse diseases. Nat Rev Drug Discov 11:709–730. 10.1038/nrd3802 [DOI] [PMC free article] [PubMed] [Google Scholar]
- Russell et al., 2014. Russell RC, Yuan HX, Guan KL (2014) Autophagy regulation by nutrient signaling. Cell Res 24:42–57. 10.1038/cr.2013.166 [DOI] [PMC free article] [PubMed] [Google Scholar]
- Satoo et al., 2009. Satoo K, Noda NN, Kumeta H, Fujioka Y, Mizushima N, Ohsumi Y, Inagaki F (2009) The structure of Atg4B-LC3 complex reveals the mechanism of LC3 processing and delipidation during autophagy. EMBO J 28:1341–1350. 10.1038/emboj.2009.80 [DOI] [PMC free article] [PubMed] [Google Scholar]
- Sheehan et al., 2016. Sheehan P, Zhu M, Beskow A, Vollmer C, Waites CL (2016) Activity-dependent degradation of synaptic vesicle proteins requires Rab35 and the ESCRT pathway. J Neurosci 36:8668–8686. 10.1523/JNEUROSCI.0725-16.2016 [DOI] [PMC free article] [PubMed] [Google Scholar]
- Shehata et al., 2012. Shehata M, Matsumura H, Okubo-Suzuki R, Ohkawa N, Inokuchi K (2012) Neuronal stimulation induces autophagy in hippocampal neurons that is involved in AMPA receptor degradation after chemical long-term depression. J Neurosci 32:10413–10422. 10.1523/JNEUROSCI.4533-11.2012 [DOI] [PMC free article] [PubMed] [Google Scholar]
- Shu et al., 2011. Shu X, Lev-Ram V, Deerinck TJ, Qi Y, Ramko EB, Davidson MW, Jin Y, Ellisman MH, Tsien RY (2011) A genetically encoded tag for correlated light and electron microscopy of intact cells, tissues, and organisms. PLoS Biol 9:e1001041. 10.1371/journal.pbio.1001041 [DOI] [PMC free article] [PubMed] [Google Scholar]
- Soukup et al., 2016. Soukup SF, Kuenen S, Vanhauwaert R, Manetsberger J, Hernández-Díaz S, Swerts J, Schoovaerts N, Vilain S, Gounko NV, Vints K, Geens A, De Strooper B, Verstreken P (2016) A LRRK2-dependent EndophilinA phosphoswitch is critical for macroautophagy at presynaptic terminals. Neuron 92:829–844. 10.1016/j.neuron.2016.09.037 [DOI] [PubMed] [Google Scholar]
- Spencer et al., 2009. Spencer B, Potkar R, Trejo M, Rockenstein E, Patrick C, Gindi R, Adame A, Wyss-Coray T, Masliah E (2009) Beclin 1 gene transfer activates autophagy and ameliorates the neurodegenerative pathology in alpha-synuclein models of Parkinson's and Lewy body diseases. J Neurosci 29:13578–13588. 10.1523/JNEUROSCI.4390-09.2009 [DOI] [PMC free article] [PubMed] [Google Scholar]
- Spilman et al., 2010. Spilman P, Podlutskaya N, Hart MJ, Debnath J, Gorostiza O, Bredesen D, Richardson A, Strong R, Galvan V (2010) Inhibition of mTOR by rapamycin abolishes cognitive deficits and reduces amyloid-beta levels in a mouse model of Alzheimer's disease. PLoS One 5:e9979. 10.1371/journal.pone.0009979 [DOI] [PMC free article] [PubMed] [Google Scholar]
- Stenmark, 2009. Stenmark H. (2009) Rab GTPases as coordinators of vesicle traffic. Nat Rev Mol Cell Biol 10:513–525. 10.1038/nrm2728 [DOI] [PubMed] [Google Scholar]
- Takamori et al., 2006. Takamori S, Holt M, Stenius K, Lemke EA, Grønborg M, Riedel D, Urlaub H, Schenck S, Brügger B, Ringler P, Müller SA, Rammner B, Gräter F, Hub JS, De Groot BL, Mieskes G, Moriyama Y, Klingauf J, Grubmüller H, Heuser J, et al. (2006) Molecular anatomy of a trafficking organelle. Cell 127:831–846. 10.1016/j.cell.2006.10.030 [DOI] [PubMed] [Google Scholar]
- Takemoto et al., 2013. Takemoto K, Matsuda T, Sakai N, Fu D, Noda M, Uchiyama S, Kotera I, Arai Y, Horiuchi M, Fukui K, Ayabe T, Inagaki F, Suzuki H, Nagai T (2013) SuperNova, a monomeric photosensitizing fluorescent protein for chromophore-assisted light inactivation. Sci Rep 3:2629. 10.1038/srep02629 [DOI] [PMC free article] [PubMed] [Google Scholar]
- Tammineni et al., 2017. Tammineni P, Ye X, Feng T, Aikal D, Cai Q (2017) Impaired retrograde transport of axonal autophagosomes contributes to autophagic stress in Alzheimer's disease neurons. Elife 6:e21776. 10.7554/eLife.21776 [DOI] [PMC free article] [PubMed] [Google Scholar]
- Trewin et al., 2018. Trewin AJ, Berry BJ, Wei AY, Bahr LL, Foster TH, Wojtovich AP (2018) Light-induced oxidant production by fluorescent proteins. Free Radic Biol Med 218:157–164. 10.1016/j.freeradbiomed.2018.02.002 [DOI] [PMC free article] [PubMed] [Google Scholar]
- Tsuriel et al., 2006. Tsuriel S, Geva R, Zamorano P, Dresbach T, Boeckers T, Gundelfinger ED, Garner CC, Ziv NE (2006) Local sharing as a predominant determinant of synaptic matrix molecular dynamics. PLoS Biol 4:e271. 10.1371/journal.pbio.0040271 [DOI] [PMC free article] [PubMed] [Google Scholar]
- Uytterhoeven et al., 2011. Uytterhoeven V, Kuenen S, Kasprowicz J, Miskiewicz K, Verstreken P (2011) Loss of skywalker reveals synaptic endosomes as sorting stations for synaptic vesicle proteins. Cell 145:117–132. 10.1016/j.cell.2011.02.039 [DOI] [PubMed] [Google Scholar]
- Vanhauwaert et al., 2017. Vanhauwaert R, Kuenen S, Masius R, Bademosi A, Manetsberger J, Schoovaerts N, Bounti L, Gontcharenko S, Swerts J, Vilain S, Picillo M, Barone P, Munshi ST, de Vrij FM, Kushner SA, Gounko NV, Mandemakers W, Bonifati V, Meunier FA, Soukup SF, et al. (2017) The SAC1 domain in synaptojanin is required for autophagosome maturation at presynaptic terminals. EMBO J 36:1392–1411. 10.15252/embj.201695773 [DOI] [PMC free article] [PubMed] [Google Scholar]
- Vijayan and Verstreken, 2017. Vijayan V, Verstreken P (2017) Autophagy in the presynaptic compartment in health and disease. J Cell Biol 216:1895–1906. 10.1083/jcb.201611113 [DOI] [PMC free article] [PubMed] [Google Scholar]
- Vingtdeux et al., 2012. Vingtdeux V, Sergeant N, Buée L (2012) Potential contribution of exosomes to the prion-like propagation of lesions in Alzheimer's disease. Front Physiol 3:229. 10.3389/fphys.2012.00229 [DOI] [PMC free article] [PubMed] [Google Scholar]
- Waites and Garner, 2011. Waites CL, Garner CC (2011) Presynaptic function in health and disease. Trends Neurosci 34:326–337. 10.1016/j.tins.2011.03.004 [DOI] [PubMed] [Google Scholar]
- Waites et al., 2013. Waites CL, Leal-Ortiz SA, Okerlund N, Dalke H, Fejtova A, Altrock WD, Gundelfinger ED, Garner CC (2013) Bassoon and piccolo maintain synapse integrity by regulating protein ubiquitination and degradation. EMBO J 32:954–969. 10.1038/emboj.2013.27 [DOI] [PMC free article] [PubMed] [Google Scholar]
- Wang et al., 2015. Wang T, Martin S, Papadopulos A, Harper CB, Mavlyutov TA, Niranjan D, Glass NR, Cooper-White JJ, Sibarita JB, Choquet D, Davletov B, Meunier FA (2015) Control of autophagosome axonal retrograde flux by presynaptic activity unveiled using botulinum neurotoxin type a. J Neurosci 35:6179–6194. 10.1523/JNEUROSCI.3757-14.2015 [DOI] [PMC free article] [PubMed] [Google Scholar]
- Wang et al., 2017. Wang YC, Lauwers E, Verstreken P (2017) Presynaptic protein homeostasis and neuronal function. Curr Opin Genet Dev 44:38–46. 10.1016/j.gde.2017.01.015 [DOI] [PubMed] [Google Scholar]
- Wang et al., 2012. Wang Y, Nartiss Y, Steipe B, McQuibban GA, Kim PK (2012) ROS-induced mitochondrial depolarization initiates PARK2/PARKIN-dependent mitochondrial degradation by autophagy. Autophagy 8:1462–1476. 10.4161/auto.21211 [DOI] [PubMed] [Google Scholar]
- Yang and Yang, 2011. Yang JY, Yang WY (2011) Spatiotemporally controlled initiation of parkin-mediated mitophagy within single cells. Autophagy 7:1230–1238. 10.4161/auto.7.10.16626 [DOI] [PubMed] [Google Scholar]
- Yao et al., 2007. Yao I, Takagi H, Ageta H, Kahyo T, Sato S, Hatanaka K, Fukuda Y, Chiba T, Morone N, Yuasa S, Inokuchi K, Ohtsuka T, Macgregor GR, Tanaka K, Setou M (2007) SCRAPPER-dependent ubiquitination of active zone protein RIM1 regulates synaptic vesicle release. Cell 130:943–957. 10.1016/j.cell.2007.06.052 [DOI] [PMC free article] [PubMed] [Google Scholar]
- Ybe et al., 2000. Ybe JA, Wakeham DE, Brodsky FM, Hwang PK (2000) Molecular structures of proteins involved in vesicle fusion. Traffic 1:474–479. 10.1034/j.1600-0854.2000.010605.x [DOI] [PubMed] [Google Scholar]
- Yi and Ehlers, 2005. Yi JJ, Ehlers MD (2005) Ubiquitin and protein turnover in synapse function. Neuron 47:629–632. 10.1016/j.neuron.2005.07.008 [DOI] [PubMed] [Google Scholar]
- Yue et al., 2009. Yue Z, Friedman L, Komatsu M, Tanaka K (2009) The cellular pathways of neuronal autophagy and their implication in neurodegenerative diseases. Biochim Biophys Acta 1793:1496–1507. 10.1016/j.bbamcr.2009.01.016 [DOI] [PMC free article] [PubMed] [Google Scholar]
- Zhu et al., 2007. Zhu JH, Horbinski C, Guo F, Watkins S, Uchiyama Y, Chu CT (2007) Regulation of autophagy by extracellular signal-regulated protein kinases during 1-methyl-4-phenylpyridinium-induced cell death. Am J Pathol 170:75–86. 10.2353/ajpath.2007.060524 [DOI] [PMC free article] [PubMed] [Google Scholar]