Abstract
The transition of apical progenitors (APs) to basal progenitors (BPs) is an important neurogenic process during cortical expansion. Presenilin enhancer 2 (Pen-2, also named as Psenen) is a key subunit of γ-secretase and has been implicated in neurodevelopmental disease. However, it remains unknown how Pen-2 may regulate the maintenance of APs. To address this question, we generated a conditional KO (cKO) mouse in which Pen-2 is specifically inactivated in neural progenitor cells in the telencephalon. Both male and female embryos were used. We show that Pen-2 cKO cortices display remarkable depletion of Aps, but transient increase on BPs, compared with controls. We demonstrate that the proliferation rate of APs or BPs is not changed, but the switch of APs to BPs is dramatically accelerated in Pen-2 cKO cortices. Molecular analyses reveal decreased levels of Hes1 and Hes5 but increased levels of Ngn2 and NeuroD1 in Pen-2 KO cells. We report that expression of Notch1 intracellular domain in Pen-2 cKO cortices restores the population of APs and BPs. In summary, these findings highlight a central role of the Notch signaling in Pen-2-dependent maintenance of neural stem cells in the developing neocortex.
SIGNIFICANCE STATEMENT Presenilin enhancer 2 (Pen-2) has been implicated in neurodevelopmental disease. However, mechanisms by which Pen-2 regulates cortical development are not understood. In this study, we generated neural progenitor cell-specific Pen-2 conditional KO mice. We observe depletion of apical progenitors and transiently increased the number of basal progenitors in the developing neocortex of Pen-2 mutant mice. Mechanistic analyses reveal decreased levels of Hes1 and Hes5, but increased levels of neurogenic transcription factors in Pen-2 mutant cortices, compared with controls. We demonstrate that reintroduction of Notch intracellular domain into mutant mice restores the population of apical progenitors to basal progenitors. The above findings strongly suggest that the Pen-2-Notch pathway plays an essential role in the maintenance of neural stem cells during cortical development.
Keywords: γ-secretase, neural stem cell, neurogenesis, Notch signaling, Presenilin enhancer 2
Introduction
Apical progenitors (APs) and basal progenitors (BPs) are two major neural progenitor cells (NPCs) in the developing cortex (Greig et al., 2013). Proliferation of APs, switch of APs to BPs, and neuronal differentiation are critical processes during corticogenesis (Götz and Huttner, 2005; Guillemot and Hassan, 2017). At early embryonic stages, the proliferation of APs and the switch of APs to BPs are finely balanced to promote the expansion of NSCs and the growth of the cortex (Fietz and Huttner, 2011; Imayoshi and Kageyama, 2014a; Sousa et al., 2017). The Notch signaling is a conserved development pathway (De Strooper, 2003; Kopan and Ilagan, 2009), and it plays critical roles in NSC proliferation, NSC maintenance, and cortical expansion (Ables et al., 2011; Pierfelice et al., 2011; Fiddes et al., 2018; Suzuki et al., 2018). Once activated by its ligands, Notch is cleaved by γ-secretase to release Notch1 intracellular domain (NICD), which translocates to the nucleus to form the NICD-Rbpj complex. The latter then induces the expression of Notch-targeted genes (Kopan and Ilagan, 2009).
Pen-2 is a key component of γ-secretase (De Strooper, 2003; Kimberly et al., 2003; Acx et al., 2017). It not only contributes to the catalytic property of this enzyme (Bammens et al., 2011) but also acts as a substrate-binding site (Fukumori and Steiner, 2016). Early work reported that knockdown of Pen-2 results in decreased γ-secretase activity (Francis et al., 2002; Steiner et al., 2002). It has been shown that Pen-2 is critical for the endoproteolysis of PS1 (Luo et al., 2003), and that Pen-2 is sufficient to generate active γ-secretase through the endoproteolysis of presenilin (PS) (Ahn et al., 2010; Holmes et al., 2014; Hu et al., 2017). A recent study revealed an essential role of Pen-2 in development because germ-line deletion of this gene causes early embryonic lethality in mice (Bammens et al., 2011). Abundant evidence has shown that the 19q13 microdeletion syndrome manifests microcephaly and intellectual disability (Kulharya et al., 1998; Malan et al., 2009; Forzano et al., 2012; Gana et al., 2012; Lin et al., 2012). Because Pen-2 is located in the deleted region, it might act as one of the candidate genes to cause this disorder. However, the underlying mechanisms remain unknown.
In this study, we generated NPC-specific Pen-2 cKO mice. We observed rapid depletion of APs but transient increase on BPs in the dorsal telencephalon of Pen-2 cKO mice. Molecular analysis reveals decreased γ-secretase activity but increased levels of neurogenic transcription factors, such as Ngn2 and NeuroD1 in Pen-2 cKO animals. We show that expression of NICD restores the population of APs and BPs in Pen-2 cKO cortices. Overall, these findings provide direct evidence indicating that Pen-2 regulates the maintenance of NSCs via Notch-dependent switch of APs to BPs.
Materials and Methods
Generation of floxed Pen-2 mice and NICD conditional transgenic mice.
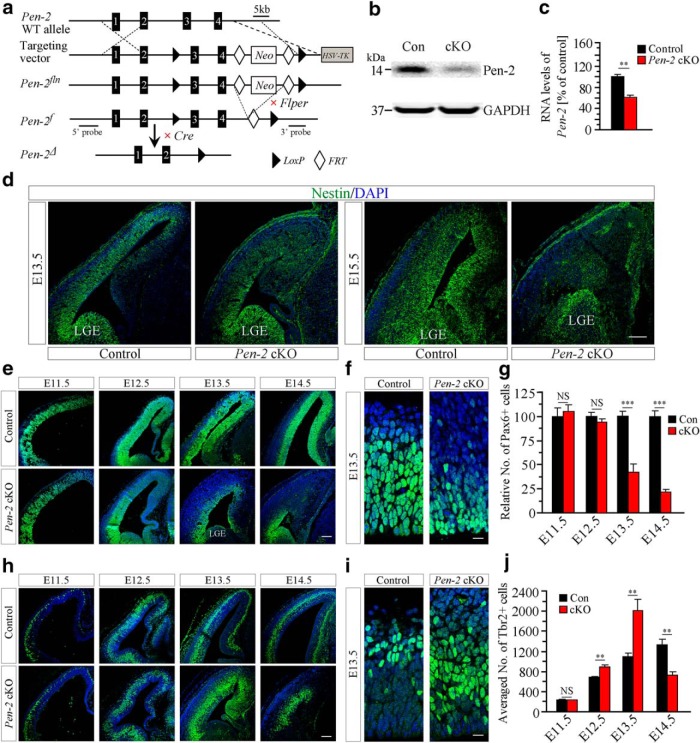
In the gene targeting strategy (see Fig. 1a), a 17 kb mouse genomic clone encompassing exons 1–4 of the Pen-2 gene was isolated from 129/SVJ mouse genomic library and subcloned into the NotI site of pBlue scriptII KS for the targeting vector, in which a neomycin resistance cassette was flanked by two FRT sites (open diamonds) and a loxP element (arrowhead). Another loxP with a BamHI site was introduced into the intron 3 to allow conditional removal of exons 3 and 4. An HSV-thimidine kinase (HSV-TK) was included at the 3′ end of the targeting vector for negative selection. Genomic DNA extracted from transfected embryonic stem cells (ES cells) cells was digested with BamHI and blotted with a 3′ outside the probe. R1 ES cells were electroporated with the targeting vector. Southern blotting was performed to screen for properly recombined ES cells. Homologously recombined clones were isolated and injected into blastocysts of C57BL/6 mice to generate chimeric mice, which were crossed to B6 mice to obtain Pen-2fln/+. After breeding with an flper mouse (Ho et al., 2006), Pen-2f/+ was obtained.
Figure 1.
Depletion of APs but transient increase on BPs in Pen-2 cKO cortices. a, Gene targeting strategy for the generation of floxed Pen-2 mice. In the targeting vector, a neomycin resistance cassette, FRT (open diamond), and two LoxP (arrowhead) sites are shown. HSV-TK was used for negative selection. b, Western blotting on Pen-2. Pen-2 levels were reduced in E13.5 Pen-2 cKO cortices. c, Relative Pen-2 mRNA levels. There was a significant difference between control and Pen-2 cKO: **p < 0.01. n = 4 embryos per group. d, Nestin IHC. The immunoreactivity of Nestin in the dorsal telencephalon was different between control and Pen-2 cKO cortices at E13.5 or E15.5, but it was comparable in the lateral ganglionic eminence between the two groups. Scale bar, 100 μm. e, Pax6 IHC. There was decreased immunoreactivity of Pax6 in E13.5 and E14.5 Pen-2 cKO cortices. Scale bar, 100 μm. f, Pax6 IHC at large scale. Scale bar, 12.5 μm. g, Relative number of Pax6+ cells in the dorsal telencephalon. There were significant genotype (p < 0.001), age (p < 0.001), and genotype × age effects (p < 0.001) (n = 3 embryos per group per age). h, Tbr2 IHC. The immunoreactivity of Tbr2 was altered in Pen-2 cKO cortices. Scale bar, 100 μm. i, Tbr2 IHC at large scale. Scale bar, 12.5 μm. j, The averaged number of Tbr2+ cells in the dorsal telencephalon. There was a transient increase followed by depletion in Pen-2 cKO cortices (n = 4 embryos per group per age). ***p < 0.005.
We generated a conditional transgenic (cTg) mouse, which expresses the mouse NICD encoding amino acids of 1744–2531 of Notch1 under the control of the chicken β-actin promoter. Plasmid-containing NICD (Ong et al., 2006) was purchased from Addgene (plasmid #20183). The expression of NICD is blocked by a STOP element, which is flanked by two LoxP sites and placed between the coding sequence and the β-actin promoter. NICD cTg mice were viable, fertile, and behaviorally normal.
Animals.
For Pen-2 cKO (Pen-2f/f;Emx1IREScre), we bred Pen-2f/f with an Emx1IREScre mutant (Gorski et al., 2002) to obtain Pen-2f/+;Emx1IREScre, which was crossed back to Pen-2f/f. Emx1IREScre and mTmG mice were purchased from the The Jackson Laboratory. The mice used for breeding were in the C57BL/6 background in this study. Both male and female embryos were used. The mice were maintained in the core animal facility of the Model Animal Research Center (MARC) at Nanjing University. The temperature of the animal room was 25 ± 1°C. The light cycle of the animal room was automatically controlled (12 h for light and 12 h for dark). Mice had free access to food and water. Mouse breeding and experiments were conducted under an Institutional Animal Care and Use Committee-approved protocol. All the experiments were performed in accordance with the Guide for the Care and Use of Laboratory Animals of Nanjing University.
Nissl staining.
Pregnant mice were killed with CO2. The head of each embryo or newborn mouse was dissected out, fixed in 4% PFA overnight at 4°C, and dehydrated using graded ethanol. After paraffin embedding, each block containing one head was sectioned coronally (10 μm in thickness) using a microtome. Brain sections were deparaffinized, rehydrated, and then rinsed. Sections were treated with 0.1% cresyl violet for 1 min and then rinsed with distilled water. Sections were dried and then sealed using neutral resin (Sinopharm Chemical Reagent). For each embryo, a total of three sections spaced 200 μm were measured, and the averaged value was used as the mean thickness.
Immunohistochemistry (IHC).
Sections were deparaffinized, ethanol rehydrated, and then boiled in 0.01 m sodium citrate buffer solution, pH 6.0. The sections were blocked using hydrogen peroxide (30% H2O2 diluted in methanol at 10:1) and then incubated with BSA (5% BSA in PBS). They were immunostained with antibodies raised against BrdU (ab6326; Abcam), Cleaved caspase-3 (CC3, #9661; Cell Signaling Technology), Nestin (AF2736; R&D Systems), Pax6 (PRB-278P; Covance), phospho-H3 (#9701; Cell Signaling Technology), Tbr2 (ab23345; Abcam), Dcx (sc-8066; Santa Cruz Biotechnology), Tuj1 (21617; SAB), Ki67 (ab15580; Abcam), Sox2 (sc-17320; Santa Cruz Biotechnology), Ngn2 (MAB3314; R&D Systems), and Hes1 (#11988; Cell Signaling Technology).
After incubation with biotin-labeled secondary antibodies which were diluted in PBS, the sections were treated using the avidin-biotin peroxidase complex (ABC kit, Vector Laboratories PK-6100), developed by DAB (Vector Laboratories SK-4100), and then dehydrated using graded ethanol. For fluorescence immunostaining, the sections were incubated with AlexaFluor-488 goat anti-mouse/anti-rabbit, AlexaFluor-594 goat anti-mouse/anti-rabbit, AlexaFluor-Cy5 goat-anti rat, AlexaFluor-Cy3 donkey anti-rabbit, or AlexaFluor-Cy5 donkey anti-goat secondary antibodies (Invitrogen). Sections were mainly analyzed using a TCS SP5 laser confocal microscope (Leica Microsystems).
BrdU labeling.
To label NPCs in proliferation, BrdU was intraperitoneally injected to pregnant dams at different ages. BrdU (B5002, Sigma-Aldrich) was administered at the concentration of 100 mg/kg. Embryonic brains were collected 30 min after the injection. Three brain sections spaced at 200 μm from each embryo were immunostained with an antibody against BrdU.
Cell counting.
For cell counting for each embryo, three coronal sections spaced 200 μm apart were used. IHC Images for Pax6, Tbr2, PH3, and Hes1 were captured under the 10× objective lens of a BX53 microscope (Olympus). The total number of Pax6+, Tbr2+, PH3+, Hes1+, BrdU+/Pax6+, BrdU+/Tbr2+, or Sox2+/Tbr2+ cells in the VZ/SVZ was counted. The cell number for each section was then averaged across 3 sections to make the mean value.
Immunoblotting.
The dorsal telencephalon from embryos was dissected and homogenized in cold radio immunoprecipitation assay lysis buffer consisting of the following (in mm): 20 Tris-HCl, pH 7.4, 150 NaCl, 1 EDTA, 1% NP-40, 0.5% sodium deoxycholate, and 0.1% SDS-containing protease and phosphatase inhibitors (Thermo Fisher Scientific). Lysates were cleared by centrifugation (12,000 rpm for 20 min). Normalized volumes of samples (40 μg total protein) were resolved in 10% or 12% SDS-PAGE (Invitrogen), transferred to nitrocellulose membrane. After blocking with 5% (w/v) nonfat dry milk for an hour, membranes were probed with primary antibodies overnight and detected using infrared dye-coupled secondary antibodies (goat anti-rabbit IRdye800, goat anti-rabbit IRdye680, goat anti-mouse IRdye800, and goat anti-mouse IRdye680). Membranes were scanned and data were quantified using Odyssey Infrared Imaging System (Li-Cor). Primary antibodies used were as follows: anti-Pen-2 (36-7100; 1:200; Invitrogen), anti-Pen-2 (a15172; 1:1000; ABclonal Technology), anti-PS1-NTF (71-1300; 1:500; Invitrogen), anti-NCT (34-9200; 1:500; Invitrogen), anti-APP (A8717; 1:500; Sigma-Aldrich), anti-Cleaved Notch (4147; 1:500; Cell Signaling Technology), anti-Ngn2 (13144; 1:500; Cell Signaling Technology), anti-Hes1 (ab71559; 1:500; Abcam), anti-NeuroD1 (ab60704; 1:1000; Abcam), anti-GPADH (CW0100; 1:10,000; CWBIO), and anti-β-actin (CW0096; 10,000, CWBIO).
ISH.
ISH using digoxigenin-labeled cRNA antisense probes was performed according to standard methods. The probe for Hes1 was prepared using a modified pGEM-T Easy Vector (Promega), which contains Hes1 cDNAs (197-1137 nt, Gene accession 15205) and bacteriophage T7/SP6 RNA polymerase promoter sequence (T7: TAATACGACTCACTATAGGG, SP6: ATTTAGGTGACAC TATAGAA).
RNA isolation.
RNA was isolated from E13.5 control and Pen-2 cKO cortices using the TRIzol reagent (Invitrogen). The purity and concentration of RNA were determined by a spectrophotometer (NanoDrop, ND-1000). Isolated RNAs were kept at −80°C until use.
Purification of Pen-2 KO cells by FACS.
The cortex was dissected from Pen-2f/+;Emx1IREScre;mTmG (control) and Pen-2f/f;Emx1IREScre;mTmG (Pen2 cKO) embryos under a stereomicroscope. After being digested by trypsin, cortical tissues became single-cell suspension-containing Cre+ cells expressing GFP and Cre− cells with red fluorescent protein. The above cell suspensions were then used for cell sorting by FACS (BD Biosciences, FACS AriaIII) to purify Cre+ cells. The sorting efficiency was larger than 90% for each sample, as indicated by the FACS instrument. The cell suspension was centrifuged (3000 rpm) to discard the supernatant. Cells were treated using TRIzol reagent (Invitrogen) for RNA purification.
qRT-PCR.
Total RNA (1 μg) was reverse transcribed using PrimeScript RT reagent Kit (Takara). Real-time PCR was performed in an ABI StepOne Plus machine. All the primers used for quantitative real-time PCR (qPCR) analyses were as follows. For Pen-2, forward: TGGATTTGCGTTCCTG CCTTTTCT, reverse: ATGAAGTTGTTAGGGAGTGCC. For Pen-2, forward: TGG ATTTGCGTTCCTGCCTTTTCT, reverse: ATGAAGTTGTTAGGGAGTGCC. For PS1, forward: GCTTGTAGGCGCCTTTAGTG, reverse: TTCTCCTCCAAGCTGC CTAA. For Aph-1a, forward: TATCCACTGCCCATGACTGA, reverse: GCAGATTC AAACCCACCAGT. For Pax6, forward: TCCACCTCACTCCCAAGAAC, reverse: AGGCTCTCAACCCAGCTACA. For Tbr2, forward: CCTGGTGGTGTTTTGTTG TG, reverse: AATCCAGCACCTTGAACGAC. For Ngn2, forward: CTCACGAAGA TCGAGACGCT, reverse: TATGGGGACGTGGAGTTGGA. For NeuroD1, forward: CAAAGCCACGGATCAATCTT, reverse: TCCCGGGAATAGTGAAACTG. For NeuroD2, forward: GTGAGCTGGGAGAACTGAGG, reverse: AACAGAAACACG CAATGCAC. For NeuroD6, forward: GAATGGCTTGTCCAGAAGGA, reverse: TA ACAGGGGACCACTTTTCG. For Hes1, forward: TCCAAGCTAGAGAAGGCAGACA, reverse: CGCGGTATTTCCCCAACA. For Hes5, forward: TTTGCAGCTCCTT CGTTGC, reverse: CCATTCCCACCATCACACC. For Dll1, forward: CAAGGATA TAGCCCCGATGA, reverse: TAGTGCAATGGGAACAACCA. For Cux1, forward: CAGAGTCTGTGCCTCATCCA, reverse: TTCAGTCAACACCACCCTGA. For Ctip2, forward: TTGCTCCCTATTGGAACCTG, reverse: CTATGCAGGGCAGACA CAGA. For Tuj1, forward: TTGCTCCCTATTGGAACCTG, reverse: TGCAGGCAG TCACAATTCTC. For Tbr1, forward: AGAGGCTCTGGAAACACGAA, reverse: ACTCGACTCGCCTAGGAACA. For Olig1, forward: GGTTTCCGAGCTGGATG TTA, reverse: AGCAAGCTCAAACGTTGGTT. For Olig2, forward: GATGGAGAG ATGCGTTCGTT, reverse: TGGGGGAAAGAAGTCAAGTG. For GAPDH, forward: AATGTGTCCGTCGTGGATCT, reverse: CCCTGTTGCTGTAGCCGTAT.
TUNEL assay.
Brain sections were blocked using a blocking buffer for 30 min followed by the treatment of fluorescein at 37°C for 1 h, as described in the manual by the manufacturer (Vazyme). TUNEL was also costained with Pax6 (1:500, PRB-278P, Covance) and Tbr2 (1:500, ab23345, Abcam). Sections were incubated with AlexaFluor-594 secondary antibodies (Invitrogen, 1:500). Images were captured using a TCS SP5 confocal laser scanning microscope (Leica Microsystems).
Experimental design and statistical analysis.
Data were presented as mean ± SEM. ANOVA was conducted to analyze overall and genotype × aging effects. Two-tailed Student's t test for pairwise comparisons was performed post hoc to examine the difference between control and mutant mice. p < 0.05 was considered statistically significant. p < 0.01 was considered highly significant.
Results
Rapid depletion of APs but transient increase on BPs in Pen-2 cKO cortices
Because Pen-2 straight KO (Pen-2−/−) mice are embryonic lethal (Bammens et al., 2011), Pen-2f/+ (Fig. 1a) was generated to overcome this problem. Pen-2f/+ was bred with the Emx1IREScre mouse (Gorski et al., 2002) to generate viable NPC-specific Pen-2 cKO mice. qPCR and Western analyses revealed significantly decreased Pen-2 expression in E13.5 Pen-2 cKO cortices compared with controls (Fig. 1b,c: p < 0.01). The residue Pen-2 may come from NPCs and other types of cells, which do not express the Cre recombinase.
To study NPC development, IHC on Nestin was conducted. The immunoreactivity of Nestin in the dorsal telencephalon was dramatically changed in Pen-2 cKO embryos at E13.5 and E15.5 compared with controls (Fig. 1d). It was not decreased in the ventral telencephalon, including lateral ganglionic eminence in Pen-2 cKOs (Fig. 1d). This was likely due to that the Cre recombinase was specifically expressed in the dorsal telencephalon (Gorski et al., 2002).
Because APs and BPs are major NPCs in the developing cortex, we examined them separately. The immunoreactivity of Pax6 was unchanged in Pen-2 cKO cortices at E11.5 and E12.5 but decreased at E13.5 and E14.5 compared with controls (Fig. 1e,f). The relative number of Pax6+ cells per section in the dorsal telencephalon was dramatically decreased in Pen-2 cKOs at E13.5 and E14.5 (p < 0.005) but not E11.5 and E12.5 (p > 0.2) (Fig. 1g). In contrast, Tbr2+ cells exhibited a different pattern (Fig. 1h,i). The total number of Tbr2+ cells in the dorsal telencephalon per section was unchanged in Pen-2 cKOs at E11.5 (Fig. 1j: p > 0.9), increased at E12.5 and E13.5 (p < 0.01), but decreased at E14.5 (p < 0.01) compared with controls.
Unchanged proliferation rate of APs but accelerated switch of APs to BPs in Pen-2 cKO cortices
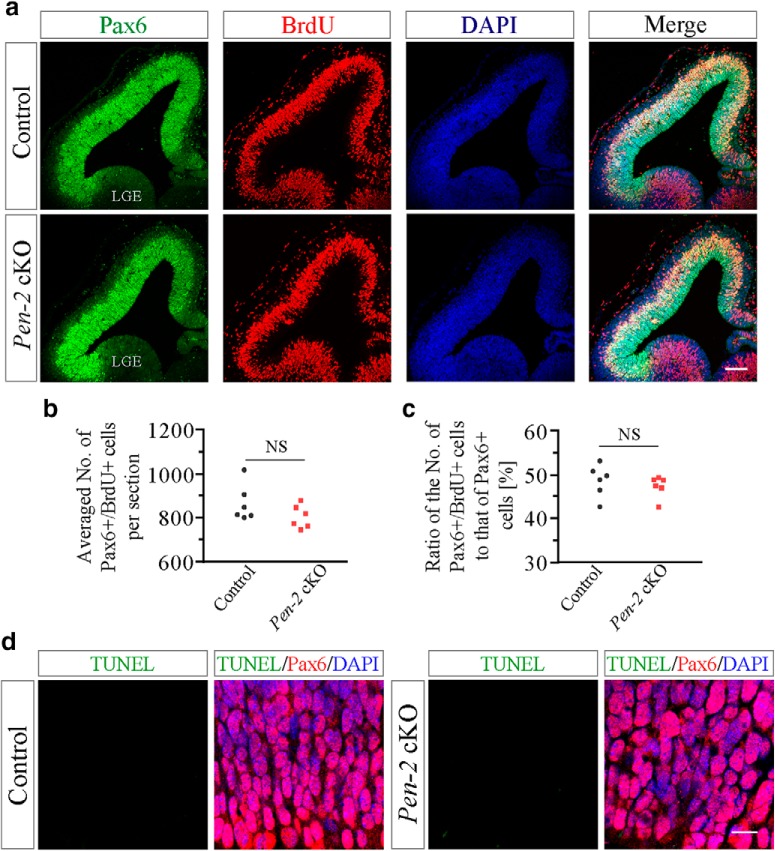
To test whether the change on APs was due to abnormal proliferation in Pen-2 cKO embryos, brain sections at E12.5 were collected 30 min after the BrdU injection. Costaining of Pax6 and BrdU showed no significant difference on the total number of Pax6+/BrdU+ cells between control and Pen-2 cKO groups (Fig. 2a,b). Moreover, the ratio of the total number of Pax6+/BrdU+ cells to that of Pax6+ cells was not decreased in Pen-2 cKO cortices (Fig. 2c: p > 0.1). Therefore, the proliferation rate of APs was not significantly affected. To study whether there was abnormal apoptosis in APs in Pen-2 cKOs, TUNEL was costained with Pax6. We did not observe cells doubly positive for TUNEL/Pax6 in control and Pen-2 cKO cortices at E12.5 (Fig. 2d). Costaining of CC3 and Pax6 also revealed no change on CC3+/Pax6+ cells in Pen-2 cKO cortices compared with controls (data not shown).
Figure 2.
Unchanged proliferation rate in APs in Pen-2 cKO cortices. a, Representative images for costaining of Pax6/BrdU/DAPI. BrdU was injected into pregnant mice at E12.5. The immunoreactivity of Pax6 was comparable between control and Pen-2 cKO cortices. Scale bar, 100 μm. b, Averaged number of Pax6+/BrdU+ cells in the dorsal telencephalon per section. There was no significant difference between control and Pen-2 cKO (n = 6 embryos per group). c, Percentage of Pax6+/BrdU+ cells to Pax6+ cells in the dorsal telencephalon. There was no significant difference between control and Pen-2 cKO cortices (p > 0.2; n = 6 embryos per group). d, Costaining of TUNEL/Pax6/DAPI using E12.5 brain sections. There were no cells doubly positive for TUNEL/Pax6 in control and Pen-2 cKO cortices. Three embryos were examined per group. Scale bar, 10 μm.
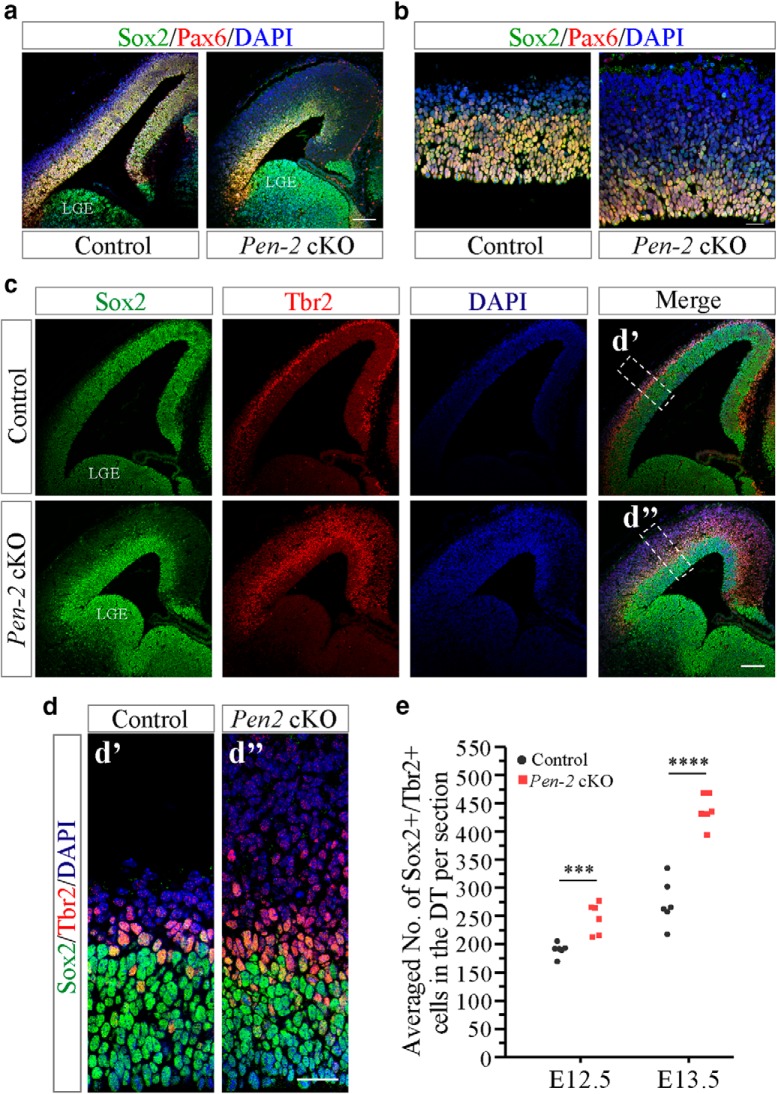
To understand cellular mechanisms to account for the change on APs in Pen-2 cKO cortices, we performed double staining of Sox2 and Tbr2 using brain sections at E12.5 and E13.5. Like Pax6, Sox2 is a marker for APs. First, we observed that the immunostaining pattern for Sox2 in the dorsal telencephalon overlapped with that for Pax6 (Fig. 3a,b). Second, cell counting results revealed significantly increased number of cells doubly positive for Sox2 and Tbr2 in Pen-2 cKO cortices compared with controls (Fig. 3c–e: p < 0.005), indicating accelerated switch of APs to BPs.
Figure 3.
Accelerated switch of APs to BPs in Pen-2 cKO cortices. a, Double-immunostaining of Pax6/Sox2. Sox2+ cells were immunopositive for Pax6 in the dorsal telencephalon in control and Pen-2 cKO mice at E13.5. However, Sox2+ cells were negative for Pax6 in the ventral telencephalon. Scale bar, 100 μm. b, Double-immunostaining of Pax6/Sox2 at higher magnification. Scale bar, 25 μm. c, Representative images for costaining of Sox2/Tbr2/DAPI on E13.5 brain sections. Scale bar, 100 μm. d, Boxed areas in c were enlarged. Scale bar, 25 μm. e, Averaged number of Sox2+/Tbr2+ cells in the dorsal telencephalon in E12.5 and E13.5 cortices (n = 6 embryos per group per age). There were significant differences between control and Pen-2 cKO: ***p < 0.005; ****p < 0.001.
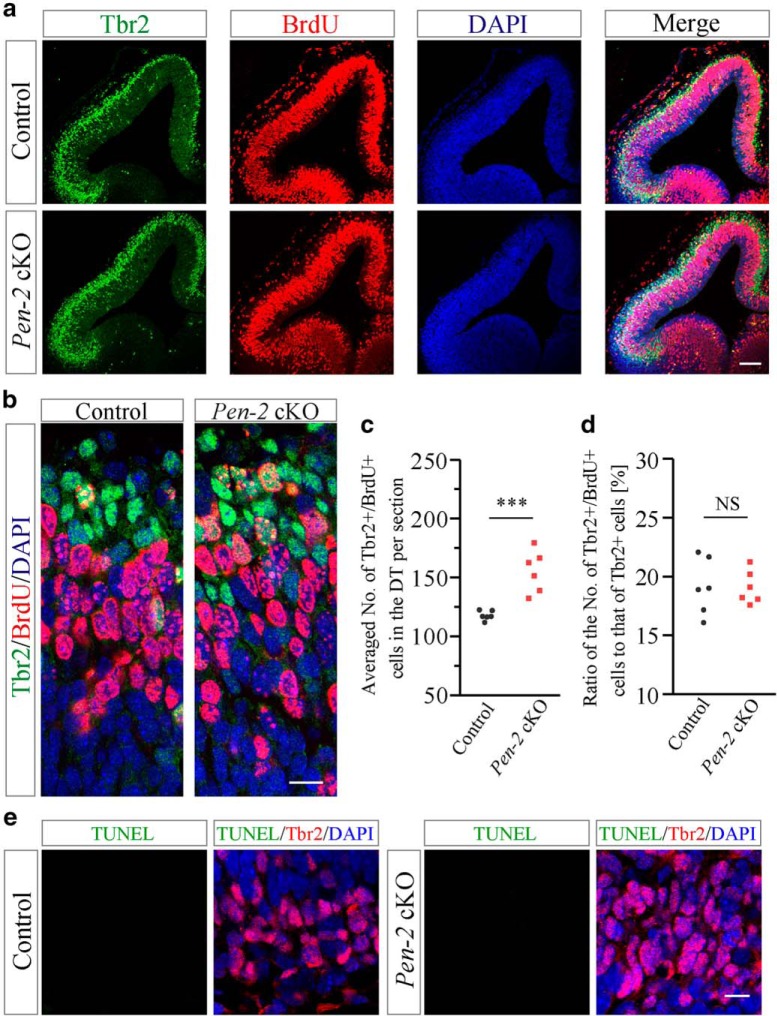
To study whether BPs exhibited abnormal proliferation in Pen-2 cKO embryos, BrdU pulse-labeling experiments were conducted. Double staining of Tbr2 and BrdU showed significant increase on the total number of Tbr2+/BrdU+ cells in E12.5 Pen-2 cKO cortices compared with controls (Fig. 4a–c). However, the ratio of the number of Tbr2+/BrdU+ cells to that of Tbr2+ cells was not increased in Pen-2 cKO cortices (Fig. 4d: p > 0.1), suggesting that the proliferation rate of BPs was not enhanced in Pen-2 cKO cortices. We further performed costaining for Tbr2/TUNEL or Tbr2/CC3. We did not observe TUNEL+/Tbr2+ (Fig. 4e) or CC3+/Tbr2+ cells (data not shown) in control or Pen-2 cKO cortices at E12.5, suggesting no abnormal apoptosis in BPs.
Figure 4.
Unchanged proliferation rate in BPs in Pen-2 cKO cortices. a, Representative images for costaining of Tbr2/BrdU/DAPI. Tbr2+/BrdU+ cells were observed in E12.5 control and Pen-2 cKO cortices. Scale bar, 100 μm. b, Images for costaining of Tbr2/BrdU/DAPI at large scale. Scale bar, 12.5 μm. c, Averaged number of cells positive for Tbr2/BrdU in the dorsal telencephalon per section. There was significant difference on the number of Tbr2+/BrdU+ cells between control and Pen-2 cKO cortices: ***p < 0.005 (n = 6 embryos per group). d, Percentage of Tbr2+/BrdU+ cells to Tbr2+ cells. There was no significant difference between control and Pen-2 cKO cortices (p > 0.9; n = 6 embryos per group). e, Costaining of TUNEL/Tbr2/DAPI using E12.5 brain sections. There were no cells doubly positive for TUNEL/Tbr2 in control and Pen-2 cKO cortices. Scale bar, 10 μm.
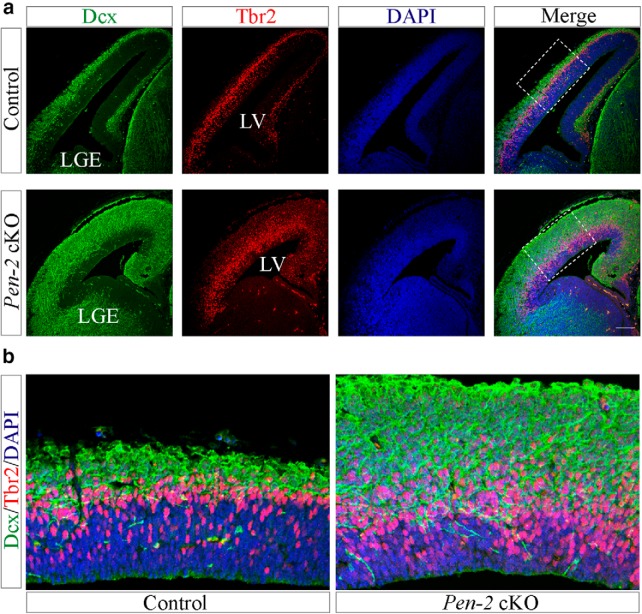
To find out why there was quick decrease on Tbr2+ cells in Pen-2 cKO cortices at E14.5, we performed double staining of Tbr2 and doublecortin (Dcx), a marker for immature neurons. First, we found that the immunoreactivity of Dcx was markedly increased in Pen-2 cKO cortices at E13.5 (Fig. 5a), suggesting precocious neurogenesis. Second, Pen-2 cKO cortices exhibited a large amount of Tbr2+/Dcx+ cells at E13.5 (Fig. 5a,b), indicating rapid differentiation of neurons from Tbr2+ BPs compared with controls.
Figure 5.
Precocious neurogenesis in Pen-2 cKO cortices. a, Double-immunostaining of Dcx/Tbr2. There were massively increased Dcx+/Tbr2+ cells in the dorsal telencephalon in Pen-2 cKO mice at E13.5 compared with controls. Scale bar, 100 μm. b, Boxed areas in a were enlarged.
Impaired γ-secretase activity in Pen-2 cKO cortices
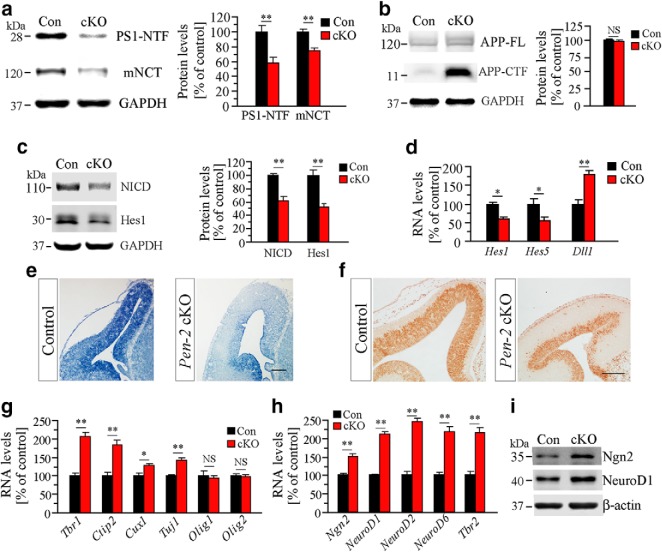
To investigate molecular mechanisms, biochemical analyses were conducted using E13.5 cortical samples. Both N-terminal fragment of PS1 (PS1-NTF) and mature NCT (mNCT) were decreased in Pen-2 cKO cortices (Fig. 6a). These results were in agreement with the notion that Pen-2 is required for the endoproteolysis of PS (Luo et al., 2003). In contrast, qPCR results revealed unchanged RNA levels for PS1 and Aph-1a in Pen-2 cKO cortices (data not shown). Therefore, loss of Pen-2 does not affect the expression of other γ-secretase subunits.
Figure 6.
Changes on γ-secretase downstream pathways in Pen-2 cKO cortices. a, Western analysis on PS1-NTF and mNCT using E13.5 cortical samples. There were significant differences between control and Pen-2 cKO: **p < 0.01 (n = 3 embryos per group). b, Western analysis on APP-CTF and APP-FL. There was increased APP-CTF in E13.5 Pen-2 cKO cortices (n = 3 embryos per group). c, Western analysis on NICD and Hes1. There were significant differences between E13.5 control and Pen-2 cKO: **p < 0.01 (n = 3 embryos per group). d, qPCR analysis on Hes1/5 and Dll1 using E13.5 total cortical RNA samples. There were significant differences between control and Pen-2 cKO: *p < 0.05; **p < 0.01 (n = 4 embryos per group). e, ISH of Hes1 on E13.5 brain section. There was different expression of Hes1 transcripts in Pen-2 cKO. Scale bar, 100 μm. f, IHC on Hes1. There was diminished expression of Hes1 in Pen-2 cKOs. Scale bar, 100 μm. g, RNA levels for layer-related genes. There was significant increase on Tbr1, Ctip2, and Tuj1 in E13.5 Pen-2 cKO cortices: *p < 0.05; **p < 0.01. h, RNA levels for neurogenic transcriptional factors. There was significant increase on Ngn2 and NeuroD1/2/6 in E13.5 Pen-2 cKO cortices: **p < 0.01. i, Western analysis on Ngn2 and NeuroD1. There were increased levels in E13.5 Pen-2 cKO: **p < 0.01 (n = 3 embryos per group).
We found that levels of full-length APP (APP-FL) were not changed in Pen-2 cKO cortices compared with controls, and that those of APP-CTF were increased (Fig. 6b). qPCR analysis showed that Notch1 mRNA levels were not different between control and Pen-2 cKO cortices (control = 100 ± 12.5%, n = 5; cKO = 118.0 ± 7.0%, n = 4; p > 0.2). Overall, deletion of Pen-2 does not affect the expression of APP or Notch1. Furthermore, Western blotting, qPCR analysis, ISH, and IHC experiments revealed decreased levels of Hes1 in E13.5 Pen-2 cKO cortices (Fig. 6c–f). Overall, these findings confirmed that loss of Pen-2 causes decreased γ-secretase activity
qPCR analyses showed that levels for Tbr1, Ctip2, or Cux1 were increased in Pen-2 cKO cortices, and that those for Olig1 and Olig2 were not changed (Fig. 6g). It is believed that neurogenic transcription factors, such as Ngn2 and NeuroD1, play critical roles in NSC fate determination (Ge et al., 2006; Imayoshi and Kageyama, 2014a; Zhao et al., 2015). Consistent with this notion, our qPCR and Western analyses showed that levels of Ngn2 and NeuroD1 were significantly increased in E13.5 Pen-2 cKO cortices compared with controls (Fig. 6h,i: p < 0.01).
The above RNA or protein samples used for molecular analyses were prepared from tissues containing cells expressing and not expressing the Cre recombinase. Because a mixture of non-KO and KO cells might mask KO effects in quantitative results, to overcome this problem, FACS was used to purify Pen-2 KO cells and discard non-KO NPCs. E12.5 and E13.5 cortices of Pen-2f/+;Emx1IREScre;mTmG and Pen-2f/f;Emx1IREScre;mTmG were used for cell sorting (Fig. 7a,b). Only Cre+ cells were collected for RNA analysis. Indeed, Pen-2 mRNAs were undetectable in Pen-2 KO cells at either E12.5 or E13.5 (Fig. 7c), confirming high efficiency for Pen-2 inactivation. Because results in Figures 1e, h, 2a, and 4a revealed that the majority of cells in the VZ at E12.5 are APs, extremely low Pen-2 mRNA levels in FACS-purified Pen-2f/f;Emx1IREScre;mTmG cells at E12.5 (Fig. 7c) suggest that Pen-2 is abundantly expressed in WT APs and is efficiently inactivated in Pen-2 cKO NPCs. Moreover, qPCR analysis revealed decreased RNA levels for Hes1 and Hes5 in Pen-2 KO cells (Fig. 7d). Levels of Tbr2 mRNA were increased in Pen-2 KO cells at E12.5 and E13.5, but those for Pax6 were decreased at E13.5 (Fig. 7e: p < 0.005). Levels for Ngn2, NeuroD1, and NeuroD2 were all increased in E13.5 Pen-2 KO cells (Fig. 7f: p < 0.005).
Figure 7.
Molecular analysis on FACS-purified Pen-2 KO cells. a, b, Purification of E12.5 and E13.5 Pen-2 KO cells by FACS. Control embryo was Pen-2f/+;Emx1IREScre;mTmG and Pen-2 KO was Pen-2f/f;Emx1IREScre;mTmG. Scale bar, 250 μm. Total number of Cre+ cells (GFP+) was comparable between control and Pen-2 cKO cortices. Cre+ cells expressing GFP (in green ellipse) were collected for RNA preparation, but Cre− cells expressing tdTomato (in red ellipse) were not. At E12.5 or E13.5, the sample size for each group was 12 or 10 embryos, respectively. c, qPCR analysis of Pen-2. There was significant reduction on Pen-2 levels in FACS-purified Pen-2 KO cells at E12.5 or E13.5: ***p < 0.005. d, RNA levels for Hes1 and Hes5. There were significant differences between control and Pen-2 cKO cells: ***p < 0.005. e, RNA levels for Pax6, Tbr2, and Tuj1. There were significant differences between control and Pen-2 KO cells: ***p < 0.005. f, RNA levels for neurogenic transcription factors. There were significant differences on Ngn2 and NeuroD1/2 between control and Pen-2 KO cells: ***p < 0.005.
Rescue effect on the population of APs and BPs in Pen-2 cKO by NICD
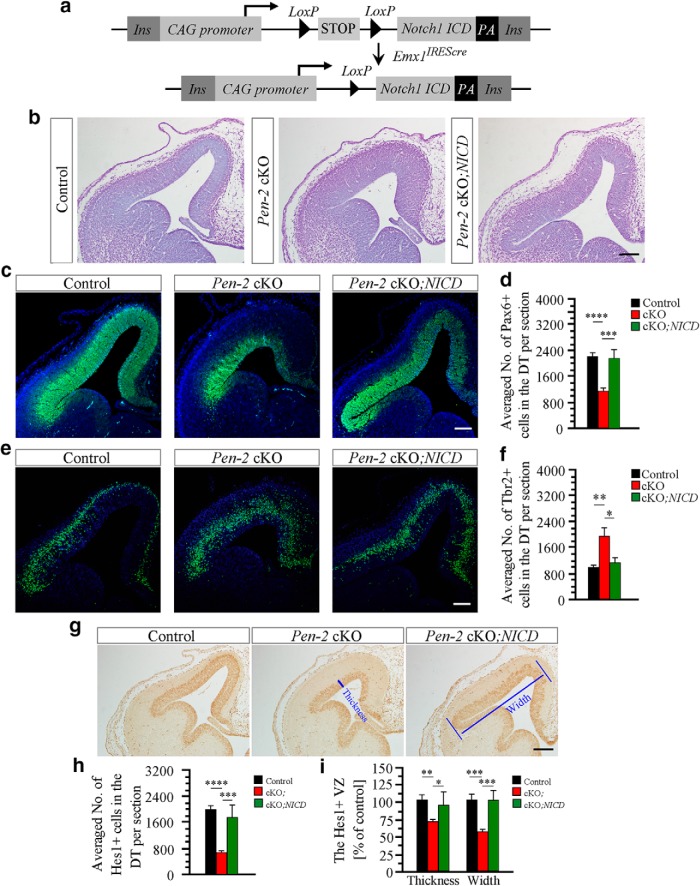
To investigate whether the Notch signaling is crucial for Pen-2-dependent maintenance of NSCs, we generated an NICD Tg (Fig. 8a), which expresses the mouse Notch1 ICD (Ong et al., 2006) upon Cre-mediated recombination. Brain sections at E13.5 were used for phenotypic analyses. First, Nissl staining showed that the dorsal telencephalon for control or Pen-2 cKO;NICD was thinner than that for Pen-2 cKO (Fig. 8b). Second, the immunoreactivity of Pax6 was comparable between control and Pen-2 cKO;NICD cortices (Fig. 8c). The averaged number of Pax6+ cells per section in Pen-2 cKO;NICD was not different from that in control, but it was significantly larger than that in Pen-2 cKO (Fig. 8d: p < 0.005). Third, the immunoreactivity of Tbr2 was reduced in Pen-2 cKO;NICD compared with Pen-2 cKO (Fig. 8e). The total number of Tbr2+ cells in control and Pen-2 cKO;NICD was less than that in Pen-2 cKO (Fig. 8f: p < 0.05). Therefore, the population of APs or BPs was restored in Pen-2 cKO by the expression of NICD.
Figure 8.
Restoration of the population for APs and BPs in Pen-2 cKO cortices by NICD. a, Schematic diagram for the generation of NICD cTg (CAG-LSL-N1ICD) mouse. Two loxP sites and the N1ICD sequence were inserted into the construct. Ins, Insulator. b, Nissl staining on brain sections at E13.5. Pen-2f/+;Emx1IREScre;NICD and Pen-2f/+;Emx1IREScre served as the control, as they did not exhibit morphological difference. Pen-2f/f;Emx1IREScre served as Pen-2 cKO and Pen-2f/f;Emx1IREScre;NICD as Pen-2 cKO;NICD. Scale bar, 100 μm. c, Pax6 IHC. The immunoreactivity of Pax6 in Pen-2 cKO;NICD was not different from that in control. Scale bar, 100 μm. d, Averaged number of Pax6+ cells in the dorsal telencephalon per section at E13.5. The difference was not significant between control and Pen-2 cKO;NICD: ***p < 0.005; ****p < 0.001. n = 5 embryos per group. e, Tbr2 IHC. The immunoreactivity of Tbr2 in Pen-2 cKO;NICD was not different from that in control. Scale bar, 100 μm. f, Averaged number of Tbr2+ cells in the dorsal telencephalon. *p < 0.05, **p < 0.01. The difference was not significant between control and Pen-2 cKO;NICD (n = 5 embryos per group). g, Hes1 IHC. The immunoreactivity of Hes1 in Pen-2 cKO;NICD was not different from that in control. Scale bar, 100 μm. h, Averaged number of Hes1+ cells in the dorsal telencephalon. ***p < 0.005, ****p < 0.001. The difference was not significant between control and Pen-2 cKO;NICD (n = 5 embryos per group). i, Thickness and width of the Hes1+ area. *p < 0.05, **p < 0.01, ***p < 0.005. ****p < 0.001. There were no significant differences between control and Pen-2 cKO;NICD (n = 5 embryos per group).
There was decreased immunoreactivity of Hes1 in Pen-2 cKO compared with control and Pen-2 cKO;NICD (Fig. 8g). We found that the difference on the total number of Hes1+ cells was not significant between control and Pen-2 cKO;NICD but was significant between Pen-2 cKO and Pen-2 cKO;NICD mice (Fig. 8h: p < 0.005). Moreover, the thickness or the width of the Hes1-positive area was smaller in Pen-2 cKO than in control or in Pen-2 cKO;NICD (Fig. 8i: p < 0.05).
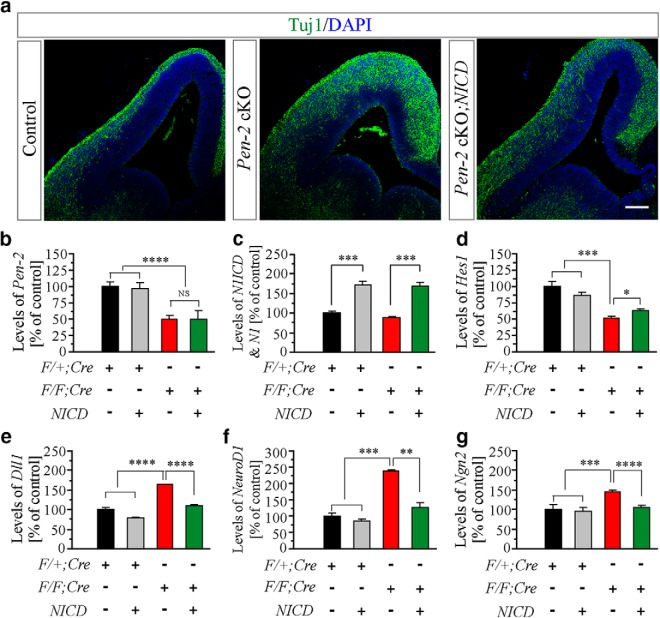
To determine the effect of NICD on neurogenesis, IHC on Tuj1 was conducted. We found that the immunoreactivity of Tuj1 was reduced in Pen-2 cKO;NICD compared with Pen-2 cKO (Fig. 9a), suggesting that NICD inhibited premature neurogenesis in Pen-2 cKO. We next examined mRNA levels for several molecules in the Notch pathway using E13.5 cortical samples. First of all, levels of Pen-2 mRNAs were reduced in Pen-2 cKO and Pen-2 cKO;NICD cortices compared with controls (Fig. 9b). As expected, levels of NICD were increased in Pen-2 cKO;NICD compared with Pen-2 cKO (Fig. 9c). Whereas levels of Hes1 were increased in Pen-2 cKO;NICD compared with Pen-2 cKO (Fig. 9d), those of Dll1 were reduced (Fig. 9e). In addition, levels for NeuroD1 and Ngn2 in Pen-2 cKO;NICD were not significantly different from those in controls (Fig. 9f,g).
Figure 9.
Rescue effects on expression levels of neurogenic transcription factors in Pen-2 cKO cortices by NICD. Genotype information for different columns (b–g) was as follows. Black column represents the group for Pen-2f/+;Cre (or F/+;Cre). Gray column represents the group for Pen-2f/+;Cre;NICD. Red column represents the group for Pen-2f/f;Cre (or F/F;Cre). Green column represents the group for Pen-2f//f;Cre;NICD. a, Tuj1 IHC. The immunoreactivity of Tuj1 in Pen-2 cKO;NICD was different from that in Pen-2 cKO mice at E13.5. Scale bar, 100 μm. b, RNA levels of Pen-2. RNA samples were prepared from the dorsal telencephalon of mice at E13.5 (4 embryos in each group). There was a significant difference between control and Pen-2 cKO-expressing NICD: ****p < 0.001. There was no difference between Pen-2 cKO and Pen-2 cKO-expressing NICD (not significant, p > 0.2). c, RNA levels of N1ICD and Notch1. There was a significant difference in Pen-2 cKO mice expressing or not expressing NICD: ***p < 0.005. d–g, RNA levels for Hes1, Dll1, NeuroD1, and Ngn2. There were significant differences on Hes1 (d), Dll1 (e), NeuroD1 (f), and Ngn2 (g) between Pen-2 cKO and Pen-2 cKO-expressing NICD: *p < 0.05; **p < 0.01; ****p < 0.001.
Discussion
Pen-2 lies in the deleted region in the 19q13 microdeletion syndrome (Kulharya et al., 1998; Malan et al., 2009; Forzano et al., 2012; Gana et al., 2012; Lin et al., 2012). The main goal of this study was to investigate the role of Pen-2 in the fate determination of NSCs. Through comprehensive analysis of NPC-specific Pen-2 cKO mice, we demonstrate that loss of Pen-2 causes depletion of APs, altered number of BPs (Fig. 1), and accelerated switch of APs to BPs (Fig. 3) in the dorsal telencephalon. We report that loss of Pen-2 does not affect the proliferation rate of APs (Fig. 2) or BPs (Fig. 4). We show that loss of Pen-2 leads to impaired γ-secretase activity (Figs. 6, 7). Finally, we find that NICD rescues the number of APs and inhibits premature neurogenesis in Pen-2 cKO cortices (Figs. 8, 9).
One major conclusion to be drawn from this study is that Pen-2 is a key regulator to govern the switch of APs to BPs in the developing neocortex. Evidence to support this view is as follows. First, there is rapid depletion of Pax6+ cells in Pen-2 cKO cortices. Second, there is temporarily increased number of Tbr2+ cells in Pen-2 cKOs. Third, there is dramatic increase on the total number of Sox2+/Tbr2+ cells in Pen-2 cKOs. Our molecular analyses on Pen-2 cKO cortical samples and FACS-purified Pen-2 KO cells reveal that loss of Pen-2 causes decreased levels of NICD, Hes1, and Hes5. Thus, the Notch signaling may be critically involved in Pen-2-dependent maintenance of NSCs. Moreover, we show that loss of Pen-2 leads to increased levels of Ngn2 and NeuroD1. This observation is in agreement with previous studies showing that Ngn is negatively regulated by Hes (Shimojo et al., 2008; Imayoshi and Kageyama, 2014b), and that Ngn is important for neural progenitor fate determination (Sun et al., 2001; Ge et al., 2006). Very importantly, levels for Hes1, Hes5, Ngn2, and NeuroD1 are rescued in Pen-2 cKO cortices by NPC-specific expression of NICD. We proposed the following working model. First, loss of Pen-2 in NPCs causes downregulation of Hes1/Hes5 but upregulation of Ngn2. Second, sustained levels of Ngn2 in APs may accelerate the switch of APs to BPs in Pen-2 cKO cortices likely through promoting the expression of Tbr2. Third, high levels of NeuroD1/2 in NPCs drive them to differentiate into neurons.
The second conclusion from this study is that Pen-2 is not essential for the proliferation of NPCs in the developing neocortex. We obtained two lines of evidence for it. First, the ratio of the number of Pax6+/BrdU+ cells to that of total Pax6+ cells is not changed in Pen-2 cKO cortices. Second, the ratio of the number of Tbr2+/BrdU+ cells to that of total Tbr2+ cells is not different between control and Pen-2 cKO mice. Thus, the imbalance on APs and BPs in Pen-2 cKO cortices is likely caused by abnormal progenitor switch. This finding is somehow consistent with previous studies reporting that Notch and presenilins are required for the maintenance of NSCs (Kim and Shen, 2008; Ehm et al., 2010; Imayoshi et al., 2010; Gadadhar et al., 2011). Moreover, we show that loss of Pen-2 does not cause increased number of TUNEL+/Pax6+ cells or decreased number of TUNEL+/Tbr2+ cells. Thus, apoptosis is unlikely involved in Pen-2-dependent NSC maintenance. Overall, the above findings suggest that the Pen-2-Notch signaling pathway regulates the balance on APs and BPs independent of the proliferation of NSCs and apoptosis.
The third conclusion from this study is that, compared with numerous other γ-secretase substrates, Notch may play a central role in Pen-2-dependent switch of APs to BPs. First, we find that loss of Pen-2 in the developing cortex causes impairment in the Notch signaling (e.g., decreased levels for Hes1 and Hes5). Second, we demonstrate that the reintroduction of NICD into the cortex not only restores levels of Notch-targeted genes but also rescues the population of NSCs in Pen-2 cKO cortices. The NICD rescue experiment provides strong support on the view that the Pen-2-Notch signaling inhibits the switch of APs to BPs to maintain the population of NSCs. Because the rescue effect on APs or BPs in Pen-2 cKO cortices by NICD is significant but not complete, this may reflect a possibility that ICDs from other Notch receptors, such as Notch2–4, may be essential as well. The second possibility is that other γ-secretase substrates may also be involved in Pen-2-dependent specification of NPCs. This remains to be determined in future studies.
Footnotes
This work was supported by National Natural Science Foundation of China Grants 31271123, 91849113, and 31800862, National Basic Research Program of Ministry of Science and Technology of China Grant 2014CB942804, Natural Science Foundation of Jiangsu Province Grants BK20140018 and BK20170703, Jiangsu Provincial Key Medical Discipline Grant ZDXKA2016020, Fundamental Research Funds for the Central Universities Grant 0903-14380021, Priority Academic Program Development of Jiangsu Higher Education Institutions, and Jiangsu Province 2016 “333 Project” Award.
The authors declare no competing financial interests.
References
- Ables et al., 2011. Ables JL, Breunig JJ, Eisch AJ, Rakic P (2011) Not(ch) just development: notch signalling in the adult brain. Nat Rev Neurosci 12:269–283. 10.1038/nrn3024 [DOI] [PMC free article] [PubMed] [Google Scholar]
- Acx et al., 2017. Acx H, Serneels L, Radaelli E, Muyldermans S, Vincke C, Pepermans E, Müller U, Chávez-Gutiérrez L, De Strooper B (2017) Inactivation of γ-secretases leads to accumulation of substrates and non-Alzheimer neurodegeneration. EMBO Mol Med 9:1088–1099. 10.15252/emmm.201707561 [DOI] [PMC free article] [PubMed] [Google Scholar]
- Ahn et al., 2010. Ahn K, Shelton CC, Tian Y, Zhang X, Gilchrist ML, Sisodia SS, Li YM (2010) Activation and intrinsic gamma-secretase activity of presenilin 1. Proc Natl Acad Sci U S A 107:21435–21440. 10.1073/pnas.1013246107 [DOI] [PMC free article] [PubMed] [Google Scholar]
- Bammens et al., 2011. Bammens L, Chávez-Gutiérrez L, Tolia A, Zwijsen A, De Strooper B (2011) Functional and topological analysis of pen-2, the fourth subunit of the γ-secretase complex. J Biol Chem 286:12271–12282. 10.1074/jbc.M110.216978 [DOI] [PMC free article] [PubMed] [Google Scholar] [Retracted]
- De Strooper, 2003. De Strooper B. (2003) Aph-1, Pen-2, and nicastrin with presenilin generate an active gamma-secretase complex. Neuron 38:9–12. 10.1016/S0896-6273(03)00205-8 [DOI] [PubMed] [Google Scholar]
- Ehm et al., 2010. Ehm O, Göritz C, Covic M, Schäffner I, Schwarz TJ, Karaca E, Kempkes B, Kremmer E, Pfrieger FW, Espinosa L, Bigas A, Giachino C, Taylor V, Frisén J, Lie DC (2010) RBPJ kappa-dependent signaling is essential for long-term maintenance of neural stem cells in the adult hippocampus. J Neurosci 30:13794–13807. 10.1523/JNEUROSCI.1567-10.2010 [DOI] [PMC free article] [PubMed] [Google Scholar]
- Fiddes et al., 2018. Fiddes IT, Lodewijk GA, Mooring M, Bosworth CM, Ewing AD, Mantalas GL, Novak AM, van den Bout A, Bishara A, Rosenkrantz JL, Lorig-Roach R, Field AR, Haeussler M, Russo L, Bhaduri A, Nowakowski TJ, Pollen AA, Dougherty ML, Nuttle X, Addor MC, et al. (2018) Human-specific NOTCH2NL genes affect notch signaling and cortical neurogenesis. Cell 173:1356–1369.e22. 10.1016/j.cell.2018.03.051 [DOI] [PMC free article] [PubMed] [Google Scholar]
- Fietz and Huttner, 2011. Fietz SA, Huttner WB (2011) Cortical progenitor expansion, self-renewal and neurogenesis: a polarized perspective. Curr Opin Neurobiol 21:23–35. 10.1016/j.conb.2010.10.002 [DOI] [PubMed] [Google Scholar]
- Forzano et al., 2012. Forzano F, Napoli F, Uliana V, Malacarne M, Viaggi C, Bloise R, Coviello D, Di Maria E, Olivieri I, Di Iorgi N, Faravelli F (2012) 19q13 microdeletion syndrome: further refining the critical region. Eur J Med Genet 55:429–432. 10.1016/j.ejmg.2012.03.002 [DOI] [PubMed] [Google Scholar]
- Francis et al., 2002. Francis R, McGrath G, Zhang J, Ruddy DA, Sym M, Apfeld J, Nicoll M, Maxwell M, Hai B, Ellis MC, Parks AL, Xu W, Li J, Gurney M, Myers RL, Himes CS, Hiebsch R, Ruble C, Nye JS, Curtis D (2002) Aph-1 and pen-2 are required for notch pathway signaling, γ-secretase cleavage of βAPP, and presenilin protein accumulation. Dev Cell 3:85–97. 10.1016/S1534-5807(02)00189-2 [DOI] [PubMed] [Google Scholar]
- Fukumori and Steiner, 2016. Fukumori A, Steiner H (2016) Substrate recruitment of gamma-secretase and mechanism of clinical presenilin mutations revealed by photoaffinity mapping. EMBO J 35:1628–1643. 10.15252/embj.201694151 [DOI] [PMC free article] [PubMed] [Google Scholar]
- Gadadhar et al., 2011. Gadadhar A, Marr R, Lazarov O (2011) Presenilin-1 regulates neural progenitor cell differentiation in the adult brain. J Neurosci 31:2615–2623. 10.1523/JNEUROSCI.4767-10.2011 [DOI] [PMC free article] [PubMed] [Google Scholar]
- Gana et al., 2012. Gana S, Veggiotti P, Sciacca G, Fedeli C, Bersano A, Micieli G, Maghnie M, Ciccone R, Rossi E, Plunkett K, Bi W, Sutton VR, Zuffardi O (2012) 19q13.11 cryptic deletion: description of two new cases and indication for a role of WTIP haploinsufficiency in hypospadias. Eur J Hum Genet 20:852–856. 10.1038/ejhg.2012.19 [DOI] [PMC free article] [PubMed] [Google Scholar]
- Ge et al., 2006. Ge WH, He F, Kim KJ, Blanchi B, Coskun V, Nguyen L, Wu XB, Zhao J, Heng JIT, Martinowich K, Tao JF, Wu H, Castro D, Sobeih MM, Corfas G, Gleeson JG, Greenberg ME, Guillemot F, Sun YE (2006) Coupling of cell migration with neurogenesis by proneural bHLH factors. Proc Natl Acad Sci U S A 103:1319–1324. 10.1073/pnas.0510419103 [DOI] [PMC free article] [PubMed] [Google Scholar]
- Gorski et al., 2002. Gorski JA, Talley T, Qiu M, Puelles L, Rubenstein JL, Jones KR (2002) Cortical excitatory neurons and glia, but not GABAergic neurons, are produced in the emx1-expressing lineage. J Neurosci 22:6309–6314. 10.1523/JNEUROSCI.22-15-06309.2002 [DOI] [PMC free article] [PubMed] [Google Scholar]
- Götz and Huttner, 2005. Götz M, Huttner WB (2005) The cell biology of neurogenesis. Nat Rev Mol Cell Biol 6:777–788. 10.1038/nrm1739 [DOI] [PubMed] [Google Scholar]
- Greig et al., 2013. Greig LC, Woodworth MB, Galazo MJ, Padmanabhan H, Macklis JD (2013) Molecular logic of neocortical projection neuron specification, development and diversity. Nat Rev Neurosci 14:755–769. 10.1038/nrn3586 [DOI] [PMC free article] [PubMed] [Google Scholar]
- Guillemot and Hassan, 2017. Guillemot F, Hassan BA (2017) Beyond proneural: emerging functions and regulations of proneural proteins. Curr Opin Neurobiol 42:93–101. 10.1016/j.conb.2016.11.011 [DOI] [PubMed] [Google Scholar]
- Ho et al., 2006. Ho A, Morishita W, Atasoy D, Liu X, Tabuchi K, Hammer RE, Malenka RC, Südhof TC (2006) Genetic analysis of Mint/X11 proteins: essential presynaptic functions of a neuronal adaptor protein family. J Neurosci 26:13089–13101. 10.1523/JNEUROSCI.2855-06.2006 [DOI] [PMC free article] [PubMed] [Google Scholar]
- Holmes et al., 2014. Holmes O, Paturi S, Wolfe MS, Selkoe DJ (2014) Functional analysis and purification of a pen-2 fusion protein for gamma-secretase structural studies. J Neurochem 131:94–100. 10.1111/jnc.12772 [DOI] [PMC free article] [PubMed] [Google Scholar]
- Hu et al., 2017. Hu C, Xu J, Zeng LL, Li T, Cui MZ, Xu X (2017) Pen-2 and presenilin are sufficient to catalyze notch processing. J Alzheimers Dis 56:1263–1269. 10.3233/JAD-161094 [DOI] [PMC free article] [PubMed] [Google Scholar]
- Imayoshi and Kageyama, 2014a. Imayoshi I, Kageyama R (2014a) bHLH factors in self-renewal, multipotency, and fate choice of neural progenitor cells. Neuron 82:9–23. 10.1016/j.neuron.2014.03.018 [DOI] [PubMed] [Google Scholar]
- Imayoshi and Kageyama, 2014b. Imayoshi I, Kageyama R (2014b) Oscillatory control of bHLH factors in neural progenitors. Trends Neurosci 37:531–538. 10.1016/j.tins.2014.07.006 [DOI] [PubMed] [Google Scholar]
- Imayoshi et al., 2010. Imayoshi I, Sakamoto M, Yamaguchi M, Mori K, Kageyama R (2010) Essential roles of notch signaling in maintenance of neural stem cells in developing and adult brains. J Neurosci 30:3489–3498. 10.1523/JNEUROSCI.4987-09.2010 [DOI] [PMC free article] [PubMed] [Google Scholar]
- Kim and Shen, 2008. Kim WY, Shen J (2008) Presenilins are required for maintenance of neural stem cells in the developing brain. Mol Neurodegener 3:2. 10.1186/1750-1326-3-2 [DOI] [PMC free article] [PubMed] [Google Scholar]
- Kimberly et al., 2003. Kimberly WT, LaVoie MJ, Ostaszewski BL, Ye W, Wolfe MS, Selkoe DJ (2003) Gamma-secretase is a membrane protein complex comprised of presenilin, nicastrin, Aph-1, and Pen-2. Proc Natl Acad Sci U S A 100:6382–6387. 10.1073/pnas.1037392100 [DOI] [PMC free article] [PubMed] [Google Scholar]
- Kopan and Ilagan, 2009. Kopan R, Ilagan MX (2009) The canonical notch signaling pathway: unfolding the activation mechanism. Cell 137:216–233. 10.1016/j.cell.2009.03.045 [DOI] [PMC free article] [PubMed] [Google Scholar]
- Kulharya et al., 1998. Kulharya AS, Michaelis RC, Norris KS, Taylor HA, Garcia-Heras J (1998) Constitutional del(19)(q12q13.1) in a three-year-old girl with severe phenotypic abnormalities affecting multiple organ systems. Am J Med Genet 77:391–394. [DOI] [PubMed] [Google Scholar]
- Lin et al., 2012. Lin S, Lee C, Chen T, Tu M, Lin C, Chang T, Su Y (2012) A fetus with 19q13.11 microdeletion presenting with intrauterine growth restriction and multiple cystic kidney. Case Rep Perinat Med 1:69–74. 10.1515/crpm-2012-0001 [DOI] [Google Scholar]
- Luo et al., 2003. Luo WJ, Wang H, Li H, Kim BS, Shah S, Lee HJ, Thinakaran G, Kim TW, Yu G, Xu H (2003) PEN-2 and APH-1 coordinately regulate proteolytic processing of presenilin 1. J Biol Chem 278:7850–7854. 10.1074/jbc.C200648200 [DOI] [PubMed] [Google Scholar]
- Malan et al., 2009. Malan V, Raoul O, Firth HV, Royer G, Turleau C, Bernheim A, Willatt L, Munnich A, Vekemans M, Lyonnet S, Cormier-Daire V, Colleaux L (2009) 19q13. 11 deletion syndrome: a novel clinically recognisable genetic condition identified by array comparative genomic hybridisation. J Med Genet 46:635–640. 10.1136/jmg.2008.062034 [DOI] [PubMed] [Google Scholar]
- Ong et al., 2006. Ong CT, Cheng HT, Chang LW, Ohtsuka T, Kageyama R, Stormo GD, Kopan R (2006) Target selectivity of vertebrate notch proteins: collaboration between discrete domains and CSL-binding site architecture determines activation probability. J Biol Chem 281:5106–5119. 10.1074/jbc.M506108200 [DOI] [PubMed] [Google Scholar]
- Pierfelice et al., 2011. Pierfelice T, Alberi L, Gaiano N (2011) Notch in the vertebrate nervous system: an old dog with new tricks. Neuron 69:840–855. 10.1016/j.neuron.2011.02.031 [DOI] [PubMed] [Google Scholar]
- Shimojo et al., 2008. Shimojo H, Ohtsuka T, Kageyama R (2008) Oscillations in notch signaling regulate maintenance of neural progenitors. Neuron 58:52–64. 10.1016/j.neuron.2008.02.014 [DOI] [PubMed] [Google Scholar]
- Sousa et al., 2017. Sousa AM, Meyer KA, Santpere G, Gulden FO, Sestan N (2017) Evolution of the human nervous system function, structure, and development. Cell 170:226–247. 10.1016/j.cell.2017.06.036 [DOI] [PMC free article] [PubMed] [Google Scholar]
- Steiner et al., 2002. Steiner H, Winkler E, Edbauer D, Prokop S, Basset G, Yamasaki A, Kostka M, Haass C (2002) PEN-2 is an integral component of the gamma-secretase complex required for coordinated expression of presenilin and nicastrin. J Biol Chem 277:39062–39065. 10.1074/jbc.C200469200 [DOI] [PubMed] [Google Scholar]
- Sun et al., 2001. Sun Y, Nadal-Vicens M, Misono S, Lin MZ, Zubiaga A, Hua X, Fan G, Greenberg ME (2001) Neurogenin promotes neurogenesis and inhibits glial differentiation by independent mechanisms. Cell 104:365–376. 10.1016/S0092-8674(01)00224-0 [DOI] [PubMed] [Google Scholar]
- Suzuki et al., 2018. Suzuki IK, Gacquer D, Van Heurck R, Kumar D, Wojno M, Bilheu A, Herpoel A, Lambert N, Cheron J, Polleux F, Detours V, Vanderhaeghen P (2018) Human-specific NOTCH2NL genes expand cortical neurogenesis through δ/Notch regulation. Cell 173:1370–1384.e16. 10.1016/j.cell.2018.03.067 [DOI] [PMC free article] [PubMed] [Google Scholar]
- Zhao et al., 2015. Zhao J, Lin Q, Kim KJ, Dardashti FD, Kim J, He F, Sun Y (2015) Ngn1 inhibits astrogliogenesis through induction of miR-9 during neuronal fate specification. Elife 4:e06885. 10.7554/eLife.06885 [DOI] [PMC free article] [PubMed] [Google Scholar]


