Abstract
The present study investigated the dynamic expression and regulatory mechanism of transforming growth factor β (TGF-β) signaling involved in embryonic stem cells (ESCs) differentiation into male germ cells. Candidate genes involved in TGF-β signaling pathway were screened from RNA-sequencing (RNA-seq), which were further validated by quantitative real-time PCR (qRT-PCR). Bone morphogenetic protein 4 (BMP4) was used to induce differentiation of ESCs in vitro. Inhibition of TGF-β signaling pathway was reflected by Western blot of SMAD2 and SMAD5 expression. Differentiating efficiency of germ cells was evaluated by immunofluorescence and fluorescence-activated cell sorting (FACS). Germ cell marker genes were assessed by qRT-PCR in the differentiation process, with activation or inhibition of TGF-β signaling pathway. In the process of in vitro induction, SMAD2 and SMAD5 were found to significantly up-regulated in BMP4 group versus the control and inhibition groups after 4 and 14 days. Expression of CKIT, CVH, DAZL, STRA8, and INTEGRIN α6 were significantly increased in the BMP4 group compared with the control group, while down-regulated in the inhibition groups. The proportion of germ cell-like cells was decreased from 17.9% to 2.2% after 4 days induction, and further decreased from 14.1% to 2.1% after 14 days induction. Correspondingly, expression of marker genes in germ cells was significantly lower. In vivo inhibition of TGF-β signaling pathway reduced germ cells formation from 5.5% to 1.6%, and down-regulated the expression of CKIT, CVH, DAZL, STRA8, and INTEGRIN α6. In conclusion, our study reveals the mechanism regulating spermatogonial stem cells (SSCs) and lays the basis for further understanding of the regulatory network.
Keywords: Embryonic stem cells, Primordial germ cells, RNA-seq, Spermatogonial stem cells, TGF-β signaling
Introduction
Spermatogonial stem cells (SSCs), the basis for spermatogenesis in males, are the only adult stem cells known to pass male genetic information to the next generation [1]. However, the mechanism of differentiation is unclear and germ cell induction efficiency is very low. Therefore, understanding the differentiation of embryonic stem cells (ESCs) into the male reproductive cells is important to offer a theoretical basis for male infertility treatment and regenerative therapy. A variety of intracellular cytokines and the extracellular matrix regulate the process of ESCs differentiation into SSCs, which directly or indirectly contribute to germ line development through different signaling pathways. Previous research on the regulatory signaling pathways has given a preliminary understanding of these mechanisms. For example, some signaling pathways, such as transforming growth factor β (TGF-β)/bone morphogenetic protein (BMP), NOTCH, and WNT, have been reported to regulate physiological behaviors of SSCs (Table 1) [2]. However, to date, no study has systematically profiled the regulatory signaling networks involved in differentiation of ESCs into SSCs.
Table 1. Signaling pathways regulating germ cell fate.
| Molecule | Signaling pathway | Physiological role | Reference(s) |
|---|---|---|---|
| BMP4 | Smad4/5 | Specialized and migration of primordial germ cell (PGC), proliferation, and differentiation of SSCs | Pellegrini et al. (2003) |
| GDF9 | Smad4/5 | Migration and the elongation of circular sperm | Kawase et al. (2004) |
| TGFΒ2 | Smad2/3 | The proliferation and differentiation of SSCs | James et al. (2005) |
| ACTIVIN | Smad2/3 | SSCs self-renewal | He et al. (2007) |
| NODAL | Smad2/3 | PGCs specialized, SSCs self-renewal | He et al. (2007) |
| RA/CYP26B1 | RA | The formation and differentiation of SSCs | MacLean et al. (2007) |
| WNT3A | Wnt, Bmp | PGCs specialized | Ohinata et al. (2009) |
| NOTCH1 | Notch | The proliferation and differentiation of SSCs | Dirami et al. (2001) |
| JAGGED/DELTA | Notch | The formation and differentiation of SSCs | Dirami et al. (2001) |
| UPD (UNPAIRED) | JAK/STAT | SSCs self-renewal | Tulina and Matunis (2001) |
| GDNF | PI3K/Akt, Ras/Erk1/2, Src | Self-renewal and differentiation of SSC | Trupp et al. (1999) |
| SCF | PI3K/Akt, Ras/Erk1/2, Kit-L | Formation, proliferation, and differentiation of SSC | Feng et al. (2000) |
| FGF2 | PI3K/Akt | The proliferation and differentiation of SSCs | Kubota et al. (2004) |
| ECM | Integrin, FAK, MAPK | The formation and proliferation of the SSCs | Dolci et al. (2001); Yoon and Seger (2006) |
| DHH/PTC1 | Hedgehog | Spermatogenesis | Clark et al. (2016) |
Our previous RNA-sequencing (RNA-seq) data [3] indicated that the TGF-β signaling pathway was involved in the development of SSCs from ESCs. The TGF-β super family is composed of three subgroups of conserved proteins, including TGF-βs, BMPs, and ACTIVIN [4]. SMADs are the major downstream signaling molecules [5]. In previous studies, TGF-β2 was found to variously express in different stages of mouse testis development. TGFβRII knockout confirmed the function of TGF-β signaling in regulating the proliferation of germ cells and apoptosis [6]. Meanwhile, BMPs have been demonstrated to be essential for germ cell formation [7]. Knockout of BMP4, BMP8b, and BMPZ resulted in the loss of PGCs [8]. Furthermore, SMAD4 was found to be widely expressed in the cytoplasm of germ cells, and may regulate testicular development and spermatogenesis through BMP signaling [9]. Although recent advances show the importance of TGF-β signaling in the maintenance of SSCs, the regulation mechanism of the process of ESCs differentiation into SSCs remains unclear. However, exploring the mechanisms of SSCs development thoroughly is logistically difficult. Nevertheless, the differentiation of chicken ESCs into SSCs provides an ideal model to investigate the molecular mechanisms of germ cell cytogenesis, proliferation, and differentiation. In the present study, we explored the dynamic expression and regulatory mechanism of the TGF-β signaling pathway that was identified in our previous study [3] of chicken ESCs differentiation into SSCs. This study lays the foundation for further exploration of the regulatory network involved in germ cell differentiation, and provides the basis for revealing the mechanism of germ cells formation.
Results
Isolation, culture, purification, and identification of ESCs, PGCs, and SSCs
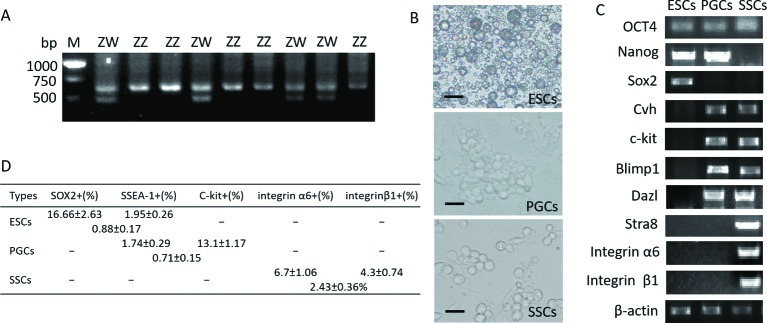
In the present study, we used only cultures of the same type of male cells. Sex determination in chickens can be achieved by identification of the chromo-helicase-DNA binding gene on chromosome W (CHD-W) that is present only in females (Figure 1A). Fluorescent inverted microscope visualization suggested that ESC clones resemble a bird’s nest with clear edges. PGCs were larger than ESCs with more obvious nuclei and clearly visible areas around the cells. SSCs were large and clumped masses that resembled a bunch of grapes (Figure 1B). Marker gene expression in ESCs, PGCs, and SSCs was identified by quantitative real-time PCR (qRT-PCR). NANOG, SOX2, and OCT4 (totipotency marker genes) were all expressed in ESCs. PGCs expressed NANOG and OCT4, while SSCs only expressed OCT4. Genes that mark germ cells including CVH, C-KIT, BLIMP1, and DAZL were identified in PGCs and SSCs, while STRA8, integrin α6, and integrin β1 were only expressed in SSCs (Figure 1C). All cells were double labeled by antibodies and then sorted using fluorescence-activated cell sorting (FACS) (n=3). The proportion of SSEA 1+/Sox2+ cells was 0.88% in ESCs. The proportion of SSEA 1+/C-kit+ cells was 0.71% in PGCs. The proportion of integrin β1+/integrin α6+ cells was 2.43% (Figure 1D).
Figure 1. Results are shown for cell isolation, culture, sorting, and identification.
(A) The sex of chicken ESCs and PGCs was determined. Samples 1, 3, 5, 7, 8, and 10 were females of genotype ZW with two DNA fragments at 600 and 450 bp. Samples 2, 4, 6, and 9 were males of genotype ZZ with only one fragment at 600 bp (M: 100 bp marker). (B) ESC, PGC, and SSC clones are shown. ESC clones resemble a bird’s nest with clear edges; PGC clones are larger than ESCs with more obvious nuclei and clearly visible areas around the cells; SSC clones are large and clump into a mass that resembles a bunch of grapes, scale bar: 68.8 μm. (C) Gene expression in ESCs, PGCs, and SSCs was detected by qRT-PCR. (D) Cell sorting results are shown for chicken ESCs, PGCs, and SSCs.
Differentially expressed genes in the TGF-β signaling network involved in the differentiation of ESCs into SSCs
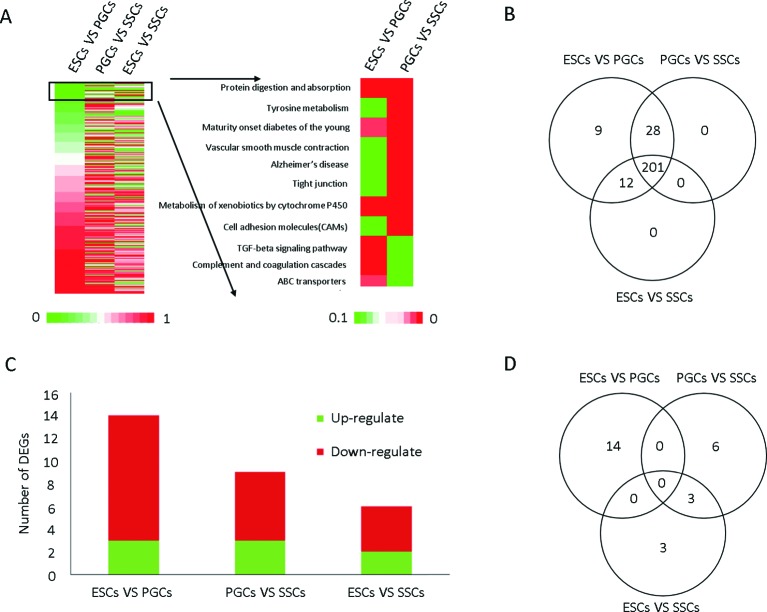
To analyze the signaling pathways involved in the differentiation of ESCs into SSCs, Venny analysis was performed. A total of 258 signaling pathways were enriched in the process of ESCs differentiation into SSCs (Figure 2A), while 250 signaling pathways were enriched in all the ESCs versus PGCs, PGCs versus SSCs, and ESCs versus SSCs groups (Figure 2B), including the TGF-β signaling pathway. A total of 26 differential expression of genes (DEGs) were enriched in the TGF-β signaling pathway. Three in the ESCs versus PGCs and PGCs versus SSCs groups, and two in the ESCs versus SSCs group were up-regulated. Eleven in the ESCs versus PGCs group, six in the PGCs versus SSCs group, and four in the ESCs versus SSCs group were down-regulated (Figure 2C and D). The values of gene expression and gene ID in the three types of male germ cells were shown in Table 2.
Figure 2. Venny analysis of TGF-β signaling pathway genes involved in the process of ESCs differentiation into SSCs.
(A) Cluster analysis of the differential expression of genes (DEGs) in ESCs, PGCs, and SSCs and the DEGs in the key signaling pathway (P<0.05). (B) Venny analysis of signaling pathways involved in the process of ESCs differentiation into SSCs. (C) Twenty-six DEGs in the TGF-β signaling pathway are shown, red represents down-regulated genes, and green represents up-regulated genes. (D) Venny analysis for DEG in ESC, PGC, and SSC.
Table 2. Gene expression in candidate DEGs in RNA-seq.
| Name | Gene ID | PGC-RPKM | ES-RPKM | SSC-RPKM |
|---|---|---|---|---|
| LOC428957 | XM_426514.2 | 0.2615316 | 7.9319858 | 0.6992365 |
| TGFBR1 | NM_204246.1 | 12.03498 | 35.603308 | 23.870031 |
| LOC420783 | XM_418878.2 | 16.011875 | 57.815212 | 27.316224 |
| ID4 | NM_204282.1 | 409.18312 | 23.451504 | 105.67738 |
| LOC424261 | XM_422108.2 | 16.746617 | 1.1608169 | 35.198991 |
| EVC | NM_001005347.1 | 6.9683479 | 1.6706692 | 14.274811 |
| THBS1 | XM_421205.2 | 52.401243 | 19.336218 | 258.73535 |
| TGFBR2 | NM_205428.1 | 10.809397 | 0.7589806 | 9.1517417 |
| DCN | NM_001030747.1 | 77.117439 | 0.347929 | 252.23439 |
| SMAD3 | NM_204475.1 | 44.019642 | 6.7470138 | 59.564046 |
| TGFB2 | NM_001031045.1 | 13.271512 | 2.0175816 | 12.869093 |
| SMAD6 | NM_204248.1 | 74.430471 | 16.64992 | 45.766524 |
| LOC427689 | NM_001039604.1 | 11.141167 | 0.5306836 | 1.2216177 |
| FST | NM_205200.1 | 13.47304 | 2.0215341 | 11.959137 |
| PITX2 | NM_205010.1 | 32.760948 | 17.659924 | 2.5180006 |
| BMP7 | XM_417496.2 | 5.1906818 | 25.747059 | 1.6204359 |
| AMH | NM_205030.1 | 3.0086921 | 5.7712117 | 2769.0292 |
| NELL2 | NM_001030740.1 | 16.279439 | 6.3415645 | 187.80838 |
| VWC2 | XM_419028.2 | 5.0086891 | 11.553585 | 68.623922 |
| SMAD1 | XM_420428.2 | 32.353393 | 24.324285 | 84.278137 |
| LOC423756 | XM_421631.2 | 5.1638772 | 1.6591893 | 0.3031273 |
| LOC777130 | XM_001236601.1 | 659.39145 | 200.97169 | 201.94203 |
| SMAD9 | NM_001024826.1 | 1.6616052 | 4.7827217 | 5.2427059 |
| LOC417326 | XM_415594.2 | 0.092275 | 0.0206579 | 0.5887629 |
| LOC421765 | XM_419795.2 | 0.06848 | 0.0394222 | 0.4825528 |
| E2F5 | NM_001030942.1 | 9.0192535 | 11.045055 | 16.795122 |
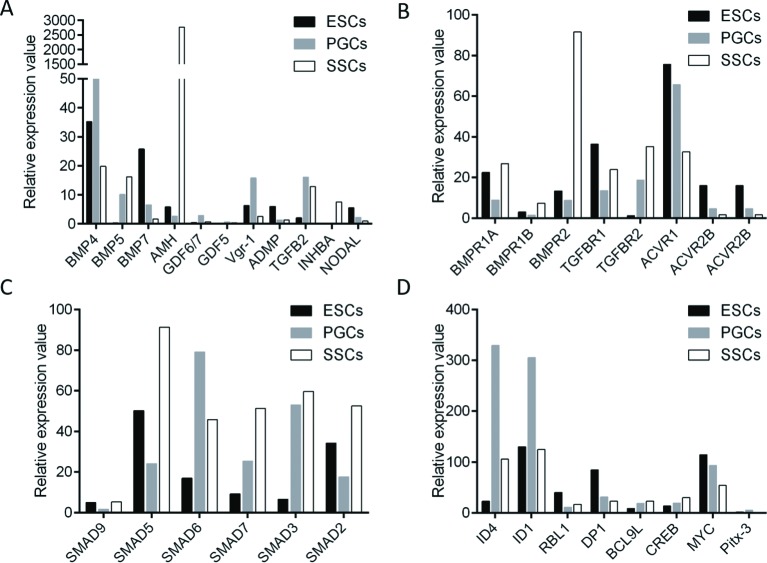
The molecules involved in the TGF-β signaling pathway were classified by their functions, including ligands, receptors, regulators, and downstream molecules. Dynamic expression patterns of the major molecules were shown in Figure 3. In the BMP subgroup, eight ligands were involved in the regulation process. The expression of BMP4, BMP5, AMH, and ADMP was continuously up-regulated during the differentiation process, while BMP7 expression was down-regulated. The expression of GDF6/7, GDF5, and VGR1 increased in PGCs, and then decreased slightly when differentiating into SSCs. In the TGF-β subgroup, TGF-β2 was the only ligand found to vary in expression in different stages of male germ cell differentiation, and its expression increased significantly in PGCs and SSCs compared with that in ESCs. In the ACTIVIN subgroup, INHBA expression increased from ESCs to SSCs. NODAL, a repressor of ESCs differentiation, was down-regulated from ESCs to SSCs. In BMP subgroups, the expression of BMPRΙA, BMPRΙB, and BMPRΙΙ was largely reduced in PGCs, and increased slightly in SSCs. In the TGF-β subgroup, TGFβRΙ expression showed a similar pattern as that in the BMP subgroup, while TGFβRΙΙ expression successively increased from ESCs to SSCs. In the Activin subgroup, the expression of ActivinRI and ActivinRII declined gradually. SMADs are the major regulators in TGF-β signaling. Similar to their receptor BMPRΙ, the expression pattern of SMAD5 and SMAD9 fluctuated. The expression of SMAD2 and SMAD3 was significantly higher in SSCs than that in ESCs and PGCs, while SMAD6 and SMAD7 expression was increased in PGCs and SSCs. For the downstream molecules, RBL1 is the negative regulator of cell cycles, and its expression decreased from ESCs to SSCs. Inhibitor of DNA binding (ID) belongs to the dominant-negative helix–loop–helix transcription family. ID1 and ID4 were more highly expressed in PGCs than in ESCs. HISTONE DEACETYLASE, P300, expression steadily increased throughout the entire differentiation process. The expression of CMYC, which is known to drive stem cell self-renewal, gradually declined in PGCs and SSCs. These results strongly indicate that TGF-β signaling is active in the process of ESCs differentiation into SSCs.
Figure 3. Dynamic expression patterns of the molecules involved in TGF-β signaling pathway during ESCs differentiation into SSCs.
Major molecules in the TGF-β signaling pathway were classified based on their functions. The dynamic expression of TGF-β signaling ligands (A), receptors (B), regulators (C), and downstream molecules (D) involved in ESCs differentiation into SSCs was derived from the RNA-seq data. Black represents ESCs, Gray represents PGCs, and White represents SSCs.
Validation of TGF-β signaling pathway-related genes expression in ESCs, PGCs, and SSCs
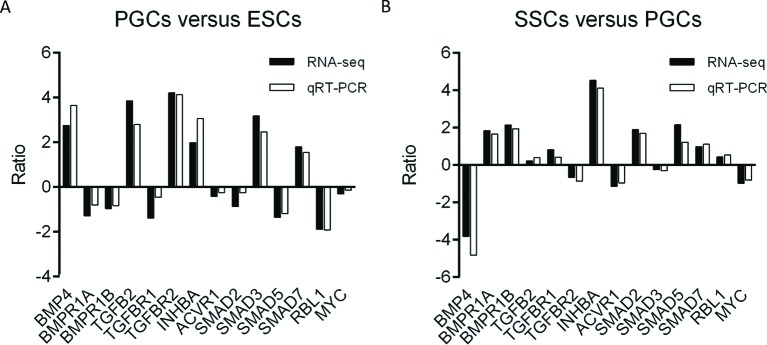
As shown in Figure 4, 14 genes with major expression differences were selected from the three subgroups for further validation. Results of qRT-PCR confirmed that, from ESCs to PGCs, the expression of BMP4, TGF-β2, TGFβR2, INHBA, SMAD3, and SMAD7 increased, while the expression of BMPR1A, BMPR1B, TGFβR1, SMAD2, SMAD5, and RBL1 decreased. In the differentiation phase of PGCs to SSCs, the expression of BMPR1A, BMPR1B, TGFβR1, INHBA, SMAD2, SMAD5, SMAD7, and RBL1 was up-regulated, whereas the expression of BMP4, TGF-β2, TGFβR2, ACVR1, and MYC was down-regulated. The qRT-PCR results were consistent with RNA-seq data from our previous study.
Figure 4. qRT-PCR validation of key TGF-β signaling genes expressed in ESCs, PGCs, and SSCs.
Fourteen genes with major expression differences were selected for qRT-PCR validation. (A) Ratio of relative expression value of the gene in PGCs versus SSCs. (B) The ratio of relative expression values of the genes in PGCs versus SSCs.
In vitro inhibition of TGF-β signaling interfered with SSCs formation
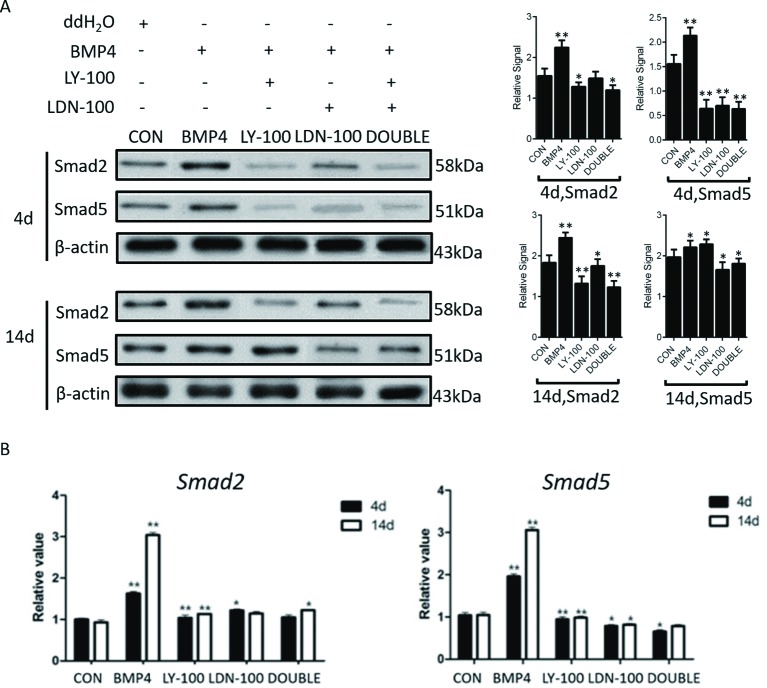
To explore the function of TGF-β signaling in the regulation of male germ cell formation, TGF-β signaling pathway specific inhibitors, LY-100 (100 nM LY2109761—antagonist to the TGF-β subgroup) and LDN-100 (100 nM LDN193189—antagonist to the BMP subgroup), were added to the BMP4 induction medium. Western blot assays showed that expression of SMAD2 and SMAD5 was significantly increased in the BMP4 group on days 4, and was dramatically decreased in the corresponding inhibition groups. Moreover, the expression of SMAD2 and SMAD5 in the double inhibition group was further reduced compared with the single inhibition groups (Figure 5). Concurrently, we found that the expression of SMAD2 and SMAD5 was significantly down-regulated.
Figure 5. Inhibition efficiency of TGF-β signaling in vitro.
Western blot and qRT-PCR were performed to evaluate the inhibition efficiency of TGF-β signaling in vitro. (A) Smad2 and Smad5 expression in control and inhibition groups on differentiation days 4 and 14 (CON: control group; LY-100༚100 nM TGF-β subgroup inhibitor LY2109761; LDN-100: 100 nM BMP4 subgroup inhibitor LDN193189). (B) Quantitative evaluation of Smad5 expression in different groups on differentiation days 4 and 14. Statistical difference was assessed by comparing the BMP4 group with the control group, and the sample treated with H2O was regard as Blank Control (*P<0.05, **P<0.01).
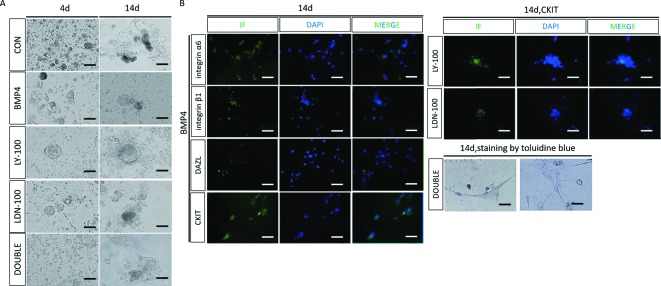
In the BMP4 group, numerous embryoid bodies appeared on day 4, and a few spermatogonial stem-like cells appeared between day 12 and 14. In contrast with the BMP4 induction group, the cells in the LY-100 group and LDN-100 groups displayed no changes on day 4, a few embryoid bodies were observed on day 10, whereas no spermatogonial stem-like cells were seen on or after day 14. Instead, many mast cells were observed in the double suppression group, which were positively stained by Toluidine Blue on day 14 (Figure 5A). Immunofluorescence performed on day 14 showed that a large amount of cells in the BMP4 group expressed INTEGRIN α6, INTEGRIN β1, DAZL, and CKIT, while only a small proportion of CKIT positive cells were observed in the single inhibition group (Figure 6B).
Figure 6. Morphology and cell marker identification of the BMP4-induced male germ cells differentiation.
(A) Morphological changes in the cells under BMP4 induction with or without TGF-β signaling inhibitors (LY: TGF-β subgroup inhibitor LY2109761; LDN: BMP4 subgroup inhibitor LDN193189; DOUBLE: two inhibitors were used). Toluidine Blue was used to stain the mast cells in the DOUBLE inhibition group, scale bar: 68.8 μm. (B) Immunocytochemical staining of the germ cell markers was used to identify the germ cells. Integrin α6, integrin β1, DAZL, and C-kit were used as the germ cells markers.
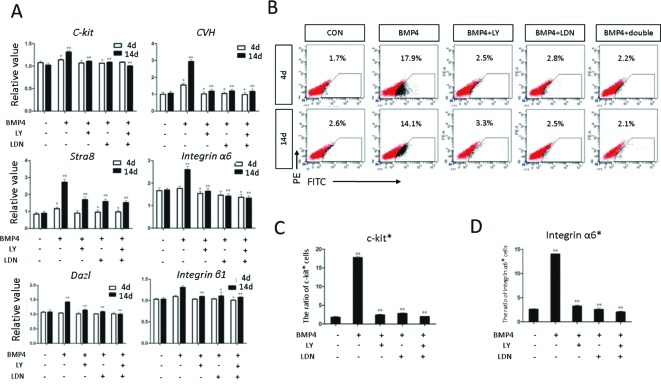
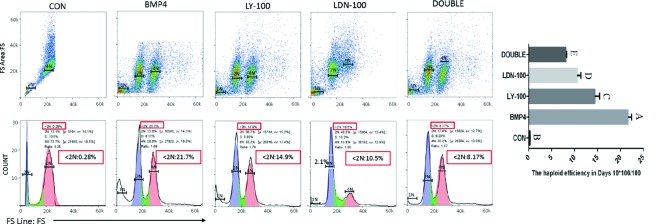
Moreover, CKIT expression was not detected in the double inhibition group. Expression of the germ cell marker genes, evaluated by qRT-PCR, was significantly increased in the BMP4 group compared with the control group; however, the same germ cell marker genes showed no obvious changes in the inhibition groups (Figure 7A). With FACS, we confirmed that the percentage of CKIT positive cells in the BMP4 group was 17.9% on day 4. However, in the control and inhibition groups, only a small amount of CKIT positive cells (CON: 1.7%; BMP4 + LY-100: 2.5%; BMP4 + LDN-100: 2.8%; and BMP4 + DOUBLE: 2.2%) were counted (Figure 7B and C). On day 14, the percentage of INTEGRIN α6 positive cells in the inhibition groups (BMP4 + LY-100: 3.3%; BMP4 + LDN-100: 2.5%; and BMP4 + DOUBLE: 2.1%) was significantly lower than that in the BMP4 group (14.1%) (Figure 7B and D). The result of haploid generation efficiency detection shown that the percentage of haploid in BMP4 group from 21.7% (BMP group) down to 14.9% (BMP4 + LY-100), 10.5 % (BMP4 + LDN-100), and 8.17% (BMP4 + DOUBLE), when LY-100 and LDN-100 were added into the induced system (Figure 8). These results demonstrated that induction of ESCs to SSCs could be sufficiently blocked by inhibition of the TGF-β signaling pathway in vitro.
Figure 7. Evaluation of the germ cell marker genes expression in vitro by qRT-PCR and FACS.
(A) Expression of germ cell marker genes, including C-Kit, CVH, DAZL, STRA8, integrin α6, and integrin β1 in different treatment groups was evaluated by qRT-PCR. Expression relative to β-actin is presented. (B) The PGC marker C-kit and the SSC marker integrin α6 were used to identify the male germ cells with FACS. A positive rate was shown in each group. (C) Quantification of the C-kit positive rate in each group based on FACS analysis. (D) Quantification of the integrin α6 positive rate in each group based on FACS analysis. Statistical significance was assessed by comparing the BMP4 group with the control group, and the other groups with the BMP4 group (*P<0.05, **P<0.01). The expression of genes in BMP4 group was regarded as positive Control, and the sample treated with H2O were regarded as Blank Control.
Figure 8. Haploid generation on day 14 during in vitro induction.
The result of haploid generation efficiency detection showed that the percentage of haploid in BMP4 group from 21.7% (BMP group) down to 14.9% (LY-100 group), 10.5 % (LDN-100 group), and 8.17% (DOUBLE group), when LY-100 and LDN-100 were added into the induced system. Quantitative evaluation of haploid efficiency in different groups on differentiation day 14 (capital letters represent high significant differences).
In vivo inhibition of TGF-β signaling impeded ESCs differentiation into SSCs
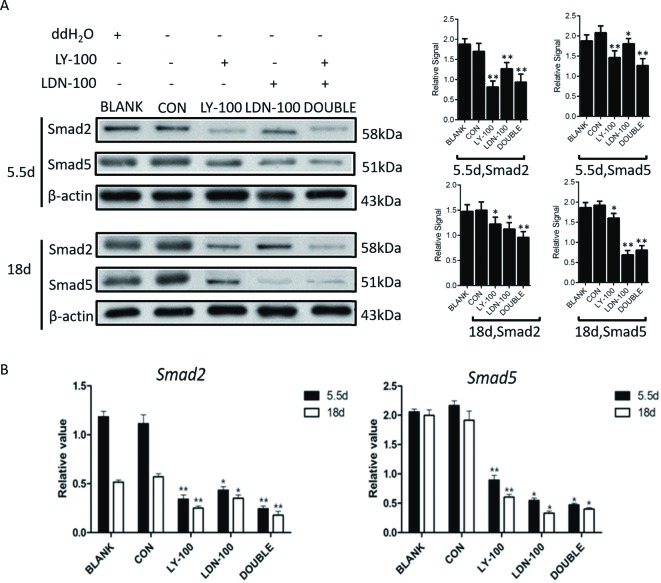
To further verify the regulatory mechanism of TGF-β signaling in germ cell generation in vivo, LY-100 and LDN-100 were injected into chicken blastoderms as described previously. Western blot assays confirmed that the expression of SMAD2 and SMAD5 in the LY-100 and LDN-100 groups was significantly suppressed compared with the control group. Meanwhile, the expression of SMAD2 and SMAD5 in the double inhibition group was even lower than in the single inhibition group (Figure 9A and B).
Figure 9. Inhibition efficiency of TGF-β signaling in vivo. qRT-PCR and Western blot were performed to evaluate the inhibition efficiency of TGF-β signaling in vivo.
(A) The expression of Smad2 and Smad5 in different groups on embryo development days 5.5 and 18 by Western blot. (B) Quantitative evaluation of the expression of Smad2 and Smad5 in different groups on embryo development days 5.5 and 18. Statistical significance was assessed by comparing each group with the control group (*P<0.05, **P<0.01). The expression of Smad2 and Smad5 in Normal incubation process were regarded as Control, and the sample treated with H2O was regarded as Blank Control.
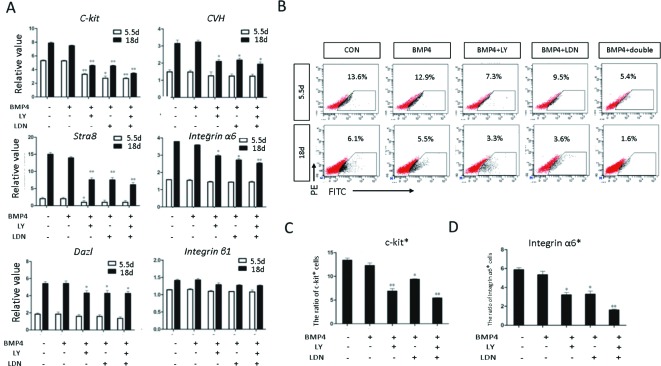
The expression of germ cell marker genes was evaluated by qRT-PCR on days 5.5 and 18. The expression of CKIT, CVH, DAZL, STRA8, and INTEGRIN α6 decreased significantly in the inhibition groups versus the control and blank groups. There was no difference between the double and single inhibition groups. Expression of INTEGRIN β1 did not change across different groups (Figure 10A). FACS analysis showed that, on day 5.5, the amount of CKIT positive cells in the inhibition group was significantly reduced (CON: 12.9%; LY-100: 7.3%; LDN-100: 9.5%; and DOUBLE: 5.4%) (Figure 10B and C), while the number of INTEGRIN α6 positive cells in the inhibition group decreased dramatically on day 18 (CON: 5.5%; LY-100: 3.3%; and LDN-100: 3.6%) (Figure 10B and D). In addition, the proportion of INTEGRIN α6 positive cells in the double inhibition group (DOUBLE: 1.6%) was even smaller than in the single inhibition groups. These results suggested that inhibition of TGF-β signaling arrests the differentiation of ESCs into SSCs.
Figure 10. Evaluation of the expression of germ cells marker genes in vivo by qRT-PCR and FACS.
(A) Expression of germ cell marker genes, including C-Kit, CVH, DAZL, STRA8, integrin α6, and integrin β1, in different treatment groups was evaluated by qRT-PCR. Their expression relative to β-actin is presented. The expression of genes in Normal incubation process was regarded as Control, and the sample treated with H2O was regard as Blank Control (B). The PGC marker C-kit and the SSC marker integrin α6 were used to identify the male germ cells with FACS. The positive rate was shown in each group. (C) Quantification of the C-kit positive rate in each group based on FACS analysis. (D) Quantification of the integrin α6 positive rate in each group based on FACS analysis. Statistical significance was assessed by comparing each group with the control group (*P<0.05, **P<0.01).
Discussion
TGF-β signaling is known to perform pivotal functions in the differentiation, proliferation, migration, and apoptosis of reproductive cells. In the present study, we analyzed RNA-seq data [3] to profile the dynamic expression pattern of signaling pathways involved in the differentiation of ESCs into SSCs. We identified that TGF-β signaling plays a key role in inducing ESCs differentiation into SSCs. In the BMP subgroup, eight molecules, including BMP4, BMP5, SMAD5, and SMAD9, were involved and in the TGF-β subgroups, TGF-β2, TGFβR2, SMAD2, and SMAD3 were found to be involved in the regulation of SSCs formation.
BMP4 is a multifunctional cytokine belonging to the TGF-β superfamily. It is released from early the extraembryonic ectoderm, and performs a fundamental function in reproductive cells [10]. Dudley [11] revealed that the production of PGCs was affected by BMP4. Shimasaki [12] observed that the synergistic effect of BMP4 and BMP8b promoted primordial germ cell (PGCs) formation in epiblasts. Toyooka [13] co-cultured the M15 cells that persistently expressed BMP4, with ESCs isolated from Mvh transgenic mice and derived sperms differentiated from the ESCs. Subsequently, several studies have attempted to induce ESCs differentiation to male germ cells by BMP4 [14,15]. However, in their study, the male germ cell induction efficiency was low and the characterization of the cells acquired was not sufficient. More importantly, the mechanism by which BMP4 regulates germ cell formation had not been elucidated. In our previous study, different concentrations of BMP4 were used to induce ESCs to differentiate into SSCs, and the optional concentration was determined at 40 ng/ml [16]. Compared with the control group, germ cells appeared after 12 days with a 40 ng/ml BMP4 induction, and the cell number expanded after 2 days. As previously reported, CVH is one of the marker genes for SSCs. DAZL and STRA8 are able to initiate the process of meiosis, and CKIT is largely expressed in PGCs. INTEGRIN Α6 is one of the markers for SSCs. We identified the cells by immunocytochemical staining of the above-mentioned markers, and confirmed that the cells we acquired possessed germ cell-like characteristics.
TGF-β1, 2, and 3 were expressed in mouse fetal testis. Analysis of functional defects in mouse testes revealed that TGF-β1 mutant mice had a decreased number of germ cells at birth. TGF-β2 mutant mice had a decreased number of seminiferous cords [17]. Mutations in BMP7, BMP8A, BMP8B, or BMP4 were also observed to block spermatogenesis [18]. In our study, single or double TGF-β signaling inhibitors were injected into chicken embryos. Expression of the germ cell markers in the inhibition group at day 5.5 in the genital ridge and day 18 in the testis was significantly suppressed. FACS analysis revealed that the proportions of PGCs marked by CKIT and SSCs marked by INTEGRIN Α6 were also significantly reduced after TGF-β signaling inhibition. Therefore, we further confirmed the role of the TGF-β signaling pathway in germ cell differentiation. In BMP4-induced germ cell formation assays, spermatogonia-like cells appeared 14 days after induction. However, those cells were no longer visible at 14 days after TGF-β inhibition, and the quantity of CKIT positive PGCs and INTEGRIN α6 positive SSCs also decreased dramatically. Hence, the in vitro BMP4 induction assay further demonstrated that activation of the TGF-β signaling pathway was necessary to promote SSCs differentiation and production. These results are supported by a study by Chen et al. [19] showing that an Smad-dependent pathway is also involved in retinoic acid-induced germ cell differentiation in mouse ESCs. The results showed treatments of ovaries with BMP4 resulted in a significant (P<0.05) increase on the primordial-to-primary follicle transition. The oocytes of primordial follicles treated with BMP4 were also less likely to undergo apoptosis. TGF-β1, 2, and 3 were observed to express in mouse fetal testis. Analysis of functional defects in mouse revealed that TGF-β is required for testicular development [17]. Mutations in BMP7, BMP8A, BMP8B, or BMP4 can block spermatogenesiss [18]. Therefore, we further confirmed the role of TGF-β signaling in germ cell differentiation. BMP4 was used to induce germ cell differentiation in vitro, and it is reported that spermatogonia-like cells can be observed after 14 days induction [16]. However, those cells were no longer observed at day 14 after TGF-β inhibition, and the quantity of CKIT positive PGCs and INTEGRIN α6 positive SSCs also decreased dramatically. The in vitro BMP4 induction assay further demonstrated that activation of TGF-β is necessary in promoting male germ cell differentiation and production.
Interpretation of the present study is limited by the use of germ cell markers, as cells marked by DAZL, STRA8, INTEGRIN α6, and INTEGRIN β1 were not only confined to be SSCs after 14 days of induction. Therefore, we further detected the efficiency of haploid formation in each of these groups to precisely illustrate the effect of inhibitors on the differentiation of ESCs into SSCs. The results showed that BMP4 can significantly induce ESCs to SSCs differentiation and a small number of cells went into meiosis, indicating the increase in haploid formation efficiency. At this time point, the expression of DAZL and STRA8 was high. When the inhibitors of the TGF-β signaling pathway were added, it showed a decrease in haploid generation efficiency, and the expression of DAZL and STRA8 was low in contrast with the BMP4 induction group. These results were consistent with the normal physiological processes.
In conclusion, the TGF-β signaling pathway is influential in directing the differentiation of ESCs into SSCs. Our study contributes toward revealing the mechanism of regulating SSCs formation, and lays the foundation for further construction of the regulatory networks involved in this process.
Materials and methods
Ethics statement
All procedures involving the care and use of animals conformed to U.S. National Institute of Health guidelines (NIH Pub. No. 85-23, revised 1996) and were approved by the Laboratory Animal Management and Experimental Animal Ethics Committee of Yangzhou University.
Materials
Eggs were collected shortly after fertilization from the poultry institute of the Chinese Academy of Agricultural Sciences Experimental Poultry Farm. A total of 18,340 eggs were collected and used for isolation of three different experimental groups: (1) ESCs, which were used immediately, and (2) PGCs, and (3) SSCs, which were both incubated at 37°C and 75% relative humidity for 5.5 and 18 days respectively, prior to use.
Dulbecco’s modified eagle medium (DMEM) and fetal bovine serum (FBS) were obtained from Gibco (U.S.A.). Mitomycin-C was obtained from Roche. β-Mercaptoethanol, chicken serum, L-glutamine, sodium pyruvate, trypsin, collagen enzyme I, human stem cell factor (HSCF), basic fibroblast growth factor (BFGF), human insulin-like growth factor (HIGF), and murine leukemia inhibitory factor (mUF) were acquired from Sigma–Aldrich. Antibodies specific to the following proteins were purchased: SSEA-1 (Biolegend, San Diego, CA, U.S.A.; dilution ratio 1:1000), Sox2 (abcam, Cambridge, England; dilution ratio 1:1000), SSEA1 (abcam, Cambridge, England; dilution ratio 1:1000), C-kit (SouthernBiotech, Birmingham, AL, U.S.A.; dilution ratio 1:1000), integrin α6 and integrin β1 (Millipore; dilution ratio 1:1000), and goat anti-mouse IgM (flourescein isothyocyanate [FITC] labeled; Bio-Synthesis, Inc., Texas, U.S.A.; dilution ratio 1:1000).
Methods
Isolation and culture of ESC, PGC, and SSC
Separation and cultivation of ESCs, PGCs, and SSCs were performed as described previously [14–16].
Sex determination
Genomic DNA from ESCs and PGCs was extracted to identify the sex of the germ cells through polymerase chain reaction (PCR) amplification using the primer sequences: F: GTTACTGATTCGTCTACGAGA and R: ATTGAAATGATCCAGTGCTTG. The PCR cycle consisted of 30 cycles of 98°C for 10 s, 49°C for 5 s, 72°C for 30 s followed by long-term storage at 4°C. Only male germ cells were used in RNA-seq analyses.
Flow cytometry cell sorting
Highly purified cells were acquired through cell sorting using two antibodies in combination to label and select cells. Antibodies to SSEA-1(dilution ratio 1:1000) and Sox2 (dilution ratio 1:1000) were used to identify ESCs, antibodies to C-kit (dilution ratio 1:1000) and SSEA-1 (dilution ratio 1:1000) were used to identify PGCs, and antibodies to the α-6 and β-1 integrins (dilution ratio 1:1000) were used to identify SSCs.
RNA-seq and analysis
ESCs, PGCs, and SSCs were collected by cell sorting, total RNA of which were extracted according to mirVana™ RNA Isolation Kit (Applied Biosystem p/n AM1556) kit, and total RNA was purified using QIAGEN RNeasy™ Kit. Illumina Inc.’s (U.S.A.). mRNA-seq procedures were followed for RNA-seq. A total of 50 ng of cell tissue was sequenced using the HiSeq 2000 system (Illumina, Inc., U.S.A.) by Shanghai OE Biotech. Co., Ltd. Results were compared against the database to obtain annotations for every identified gene. An enrichment analysis of the significance of gene ontology (GO) function and pathway was based upon the log2 value of the DEGs by DAVID (http://david.abcc.ncifcrf.gov/home.jsp), FunNet (http://www.funnet.info/), and WEGO (http://wego.genomics.org.cn/cgi-bin/wego/index.pl). Hierarchical cluster was conducted by the Eisende Cluster based upon the log2 value of the DEGs. The distance of the hierarchical clusters was determined by Euclidean distance and calculated by mean distance. The regulating network of candidate key genes was analyzed by the FUNNET database (http://www.funnet.info/). The data of RNA-seq were uploaded to the SPA database, and the reference numbers are SRR3720923, SRR3720924, and SRR3720925.
In vitro mutagenesis
The 2-d development stage of the ESCs was selected for the experiment following the methods established in previous work [20]. Cells were seeded into 24-well plates with a cell density of 105 cells per well. Cell treatment groups were as follows: control group: with no treatment; BMP4 group: induction with 40 ng/ml BMP4; LY-100 group: induction with BMP4 and 100 nM LY2109761; LDN-100 group: induction with BMP4 and 100 nM LDN193189; DOUBLE group: induced with BMP4 and equal concentrations of both of the inhibitors. The gene expression of C-KIT, DAZL, integrin α6, and integrin β1. Smad2, Smad5, and Notch1 were detected by qRT-PCR and Western blot. LDN-193189 (Gene Operation, ITB1003-0002MG, U.S.A.) is inhibitor for TGF-β/Smad; LY2109761(Gene Operation, ITB1006-0002MG, USA) is inhibitor for TGF-β/Smad.
Chicken embryo injections
Fertilized embryos were grouped as follows: blank group: without any treatment during the incubation process; control group (CON): injection with 100 μl of ddH2O; LY-100 group: injection with 100 μl of LY2109761 (100 nM); LDN-100 group: injection with 100 μl of LDN193189 (100 nM/l); dual inhibitor group (DOUBLE): injection with 50 μl of LDN193189 (200 nM); and 50 μl of LY2109761 (200 nM). Eggs were injected at the top with a TGF-β signaling pathway inhibitor as described previously [21]. They were then sealed with paraffin and incubated at 38.5°C. Samples were collected after 5.5 and 18 days of incubation. Smad2, Smad5, C-kit, Dazl, CVH, and Stra8 gene and protein expression was detected by qRT-PCR and Western blot.
qRT-PCR validation
Total RNA was extracted with an RNEasy kit (QIAGEN). Reverse transcription was performed to establish cDNA. qRT-PCR was performed according to the instructions provided in the fluorescence quantitative PCR kit, using SYBR as the fluorescence reagent and a fluorescence ration PCR instrument (7500 System fluorescence quantitative instrument, Applied Biosystems, Carlsbad, California). Data were analyzed using the 2−ΔΔ Ct relative quantitative method in Microsoft Excel. The primers used are listed in Table 3,4
Table 3. Primers information for qRT-PCR in TGF-β pathway.
| Gene name | Genbank accession number | Primers for qPCR | Tm (°C) | Size (bp) |
|---|---|---|---|---|
| BMP4 | NM_205237 | F: TGGTAACCGAATGCTGATGG | 58 | 232 |
| R: GATGACGGCTGATTTGCTG | ||||
| BMPR1A | NM_205357 | F: GGATTTACAGCCGACAT | 58 | 275 |
| R: GTAGCCCTGAGCCACT | ||||
| BMPR1B | NM_205132 | F: ATTAGAGGGCTCGGACTT | 58 | 246 |
| R: GCTTCTTGCCGCTTG | ||||
| BMPRII | NM_001001465.1 | F: AAGGACCCGTATCAGC | 59 | 299 |
| R: TCAGGAGGTGGGAAGT | ||||
| TGF-β2 | NM_001031045.1 | F: AAATGCCATCCCACCA | 55 | 158 |
| R: GCTCTATCCGCTGCTCC | ||||
| TGFβR1 | NM_204246 | F: TGCGGACAACAAAGAC | 55 | 281 |
| R: GCCTAACTGCCAACCC | ||||
| TGFβR2 | NM_205428 | F: GCCTACCGCACTCACA | 55 | 177 |
| R: TTCAATGGGCAGCAAT | ||||
| INHBA | NM_205396 | F: AGCCGAAAGGCAACTC | 55 | 190 |
| R: CAGGCAATCCGCACA | ||||
| ACVR1 | NM_204560 | F: GGGGTCTTTGTATGACTATCT | 60 | 238 |
| R: CTGGTTCGTGCTTTGG | ||||
| SMAD2 | NM_204561 | F: GCCATTACCACTCAGAAC | 55 | 174 |
| R: TTTACGATGCGACACCT | ||||
| SMAD3 | NM_204475 | F: GGCACATCGGAAGAGGA | 55 | 210 |
| R: GGTTTACAGACTGAGCCAAGA | ||||
| SMAD5 | NM_001014968 | F: TCGCCAAACAGTCCC | 55 | 230 |
| R: GCAACAGGCTGAACATC | ||||
| SMAD7 | XM_427238.2 | F: CAGTTCCTGATGGGTTATGG | 55 | 240 |
| R: GCTTCTGTTGTCCGAGTTGA | ||||
| RBL1 | XM_417312.2 | F: AGATGAAAGCCTCAGAAGA | 58 | 237 |
| R: CAAAGTCACCCACTGTTAGA | ||||
| MYC | NM_001030952 | F: CCCAGCAAGAACTACGATTACG | 55 | 223 |
| R: CGGTGGAAGGGAAGCAG |
Table 4. Primers information for qRT-PCR detected ESCs differentiation in vitro.
| Gene | Genbank accession number | Primers for qPCR | Tm (°C) | Size (bp) |
|---|---|---|---|---|
| CVH | NM_001146142.1 | F: TGGTTTCAGAACCAACGAATGAAG | 64 | 180 |
| R: TGCACTGGTCACAGCCTGAAG | ||||
| CKIT | D13225.1 | F: GCGAACTTCACCTTACCCGATTA | 64 | 150 |
| R: TGTCATTGCCGAGCATATCCA | ||||
| DAZL | NM_204218.1 | F: TGTCTTGAAGGCCTCGTTTG | 61 | 138 |
| R: CATATCCTTGGCAGGTTGTTGA | ||||
| INTEGRIN α6 | NM_205289.1 | F: GCTGGAAACATGGACCTGGATAA | 64 | 145 |
| R: TTCAGGTCAAGTTTGTCAGGCTGTA | ||||
| STRA8 | JX204292.1 | F: CCACGGCTATTTCACACCTCTG | 64 | 114 |
| R: GCTCTTGGCAAGCATCCGTA | ||||
| β-ACTIN | L08165.1 | F: CAGCCATCTTTCTTGGGTAT | 60 | 164 |
| R: CTGTGATCTCCTTCTGCATCC |
Western blotting
We collected genital ridges and testes from the chicken embryos unhatched at 5.5 and 18 days, as well as cell groups that were inducted at 4 and 14 days. Then RIPA buffer was used to lyse cells and extract proteins. Protein concentration was determined; 20 μg of total cellular protein was mixed with 5 μl of sample buffer and boiled for 3–5 min to denature the proteins. Proteins were separated by SDS/PAGE (10% gel), and transferred to nitrocellulose membranes, which were then semi-dried and blocked with tris-buffered saline with Tween containing 5% fetal calf serum for 1 h at room temperature. The membranes were incubated in the primary antibodies (SMAD2, SMAD5, and β-ACTIN) overnight at 4°C. After washing by PBS Tween (PBST), the corresponding secondary antibodies were added and incubated at 37°C for 2 h. Bands were visualized using a DAB Substrate Kit to detect horseradish peroxidase.
Immunocytochemistry
After induction, cells in 24-well plate were fixed with 4% paraformaldehyde for 30 min, rinsed with phosphate-buffered saline (PBS) three times, and then permeabilized in 0.5% TritonX-100 for 10 min. Cells were then washed with PBS three times and blocked with 10% bovine serum albumen (BSA) in PBS for 30 min at room temperature. The primary antibodies of CKIT (dilution ratio 1:1000), DAZL (dilution ratio 1:1000), INTEGRIN α6 (dilution ratio 1:1000), and INTEGRIN β1 (dilution ratio 1:1000) were added into the cells, and the plate with cells was incubated overnight at 4°C. Samples in 24-well plate were rinsed three times in PBS Tween (PBST) before the corresponding secondary antibody was applied and sections were incubated in the dark at 37°C for 1 h. Samples in 24-well plate were then rinsed three times with PBST, and DAPI was applied to stain the nuclei. Samples were observed using fluorescence microscopy.
Haploid generation
The samples of different groups were collected on the 14th day in the induction process, and the cell suspension was made. The cells were sorted by flow cytometry with staining by PI. The experiment was carried out three times, and the difference of haploid efficiency between different groups was analyzed by Spss17.0.
Statistical analysis
All data are presented as mean ± standard error (X ± SEM), and the differences between groups were analyzed by t-test and one-way ANOVA. P values of 0.05 or less were considered as statistically significant.
Acknowledgments
We thank the Poultry Institute of the Chinese Academy of Agricultural Sciences Experimental Poultry Farm for providing experimental materials.
Abbreviations
- BFGF
basic fibroblast growth factor
- BMP4
bone morphogenetic protein 4
- DEG
differentially expressed gene
- ESC
embryonic stem cell
- FACS
fluorescence-activated cell sorting
- GO
gene ontology
- HIGF
human insulin-like growth factor
- HSCF
human stem cell factor
- mUF
murine leukemia inhibitory factor
- PBST
PBS Tween
- PGC
primordial germ cell
- qRT-PCR
quantitative real-time-polymerase chain reaction
- RNA-seq
RNA-sequencing
- SSC
spermatogonial stem cell
- TGF-β
transforming growth factor β
Funding
This work was supported by the National Natural Science Foundation of China [grant numbers 31472087 and 31272429], High level talents support program of Yangzhou University [grant numbers 11117], and the Project Funded by the Priority Academic Program Development of Jiangsu Higher Education Institutions [grant numbers 090501].
Competing Interests
The authors declare that there are no competing interests associated with the manuscript.
Author Contribution
L.B.C. conceived and designed the experiments. Z.Q.S. performed the experiments. Z.Q.S. and Z.Y.N. collected the data. J.K. contributed reagents, materials, and analysis tools. Z.Q.S. wrote the manuscript. S.J.Z. modified the manuscript.
References
- 1.Oatley J.M. and Brinster R.L. (2008) Regulation of spermatogonial stem cell self-renewal in mammals. Ann. Rev. Cell Dev. Biol. 24, 263–286 [DOI] [PMC free article] [PubMed] [Google Scholar]
- 2.He Z., Kokkinaki M. and Dym M. (2009) Signaling molecules and pathways regulating the fate of spermatogonial stem cells. Microsc. Res. Tech. 72, 586–595 [DOI] [PMC free article] [PubMed] [Google Scholar]
- 3.Zhang Z., Elsayed A.K., Shi Q., Zhang Y., Zuo Q. and Li D. (2015) (Crucial genes and pathways in chicken germ stem cell differentiation. J. Biol. Chem. 290, 13605–13621 [DOI] [PMC free article] [PubMed] [Google Scholar]
- 4.Yue J., Mulder K.M., Yue J. and Mulder K.M. (2001) Transforming growth factor-β signal transduction in epithelial cells. Pharmacol. Ther. 91, 1–34 [DOI] [PubMed] [Google Scholar]
- 5.Nohe A., Keating E., Knaus P. and Petersen N.O. (2004) Signal transduction of bone morphogenetic protein receptors. Cell. Signal. 16, 291–299 [DOI] [PubMed] [Google Scholar]
- 6.Moreno S.G., Attali M., Allemand I., Messiaen S., Fouchet P. and Coffigny H. (2010) TGFβ signaling in male germ cells regulates gonocyte quiescence and fertility in mice. Dev. Biol. 342, 74–84 [DOI] [PubMed] [Google Scholar]
- 7.Kawase E., Wong M.D., Ding B.C. and Xie T. (2004) Gbb/Bmp signaling is essential for maintaining germline stem cells and for repressing bam transcription in the Drosophila testis. Development 131, 1365–1375 [DOI] [PubMed] [Google Scholar]
- 8.Ohinata Y., Ohta H., Shigeta M., Yamanaka K., Wakayama T. and Saitou M. (2009) A signaling principle for the specification of the germ cell lineage in mice. Cell 137, 571–584 [DOI] [PubMed] [Google Scholar]
- 9.Zhang X.J., Wen X.X., Zhao L. and He J.P. (2012) Immunolocalization of Smad4 protein in the testis of domestic fowl (Gallus domesticus) during postnatal development. Acta. Histochem. 114, 429–433 [DOI] [PubMed] [Google Scholar]
- 10.Geijsen N., Horoschak M., Kim K., Gribnau J., Eggan K. and Daley G.Q. (2004) Derivation of embryonic germ cells and male gametes from embryonic stem cells. Nature 427, 148–154 [DOI] [PubMed] [Google Scholar]
- 11.Dudley B.M., Runyan C., Takeuchi Y., Schaible K. and Molyneaux K. (2007) BMP signaling regulates PGC numbers and motility in organ culture. Mech. Dev. 124, 68–77 [DOI] [PubMed] [Google Scholar]
- 12.Shimasaki S., Moore R.K., Otsuka F. and Erickson G.F. (2004) The bone morphogenetic protein system in mammalian reproduction. Endocr. Rev. 25, 72–101 [DOI] [PubMed] [Google Scholar]
- 13.Toyooka Y., Tsunekawa N., Akasu R. and Noce T. (2003) Embryonic stem cells can form germ cells in vitro. Proc. Natl. Acad. Sci. U.S.A. 100, 11457–11462 [DOI] [PMC free article] [PubMed] [Google Scholar]
- 14.West F.D., Rocherios M.I., Abraham S., Rao R.R., Natrajan M.S. and Bacanamwo M. (2010) KIT ligand and bone morphogenetic protein signaling enhances human embryonic stem cell to erm-like cell differentiation. Hum. Reprod. 25, 168–178 [DOI] [PubMed] [Google Scholar]
- 15.Makoolati Z., Movahedin M. and Forouzandeh M. (2011) Bone morphogenetic protein 4 is an efficient inducer for mouse embryonic stem cell differentiation into primordial germ cell. In Vitro Cell Dev. Biol. Anim. 47, 391–398 [DOI] [PubMed] [Google Scholar]
- 16.Shi Q.Q., Sun M., Zhang Z.T., Zhang Y.N., Elsayed A.K. and Zhang L. (2014) A screen of suitable inducers for germline differentiation of chicken embryonic stem cells. Anim. Reprod. Sci. 147, 74–85 [DOI] [PubMed] [Google Scholar]
- 17.Memon M.A., Anway M.D., Covert T.R., Uzumcu M. and Skinner M.K. (2008) Transforming growth factor beta (TGFbeta1, TGFbeta2 and TGFbeta3) null-mutant phenotypes in embryonic gonadal development. Mol. Cell Endocrinol. 294, 70–80 [DOI] [PMC free article] [PubMed] [Google Scholar]
- 18.Jie H., Chen Y.X., Dan W., Qi X., Li T.G. and Jing H. (2004) Developmental expression and function of Bmp4, in spermatogenesis and in maintaining epididymal integrity. Dev. Biol. 276, 158–171 [DOI] [PubMed] [Google Scholar]
- 19.Chen W., Jia W., Wang K., Zhou Q., Leng Y., Duan T. et al. (2012) Retinoic acid regulates germ cell differentiation in mouse embryonic stem cells through a Smad-dependent pathway. Biochem. Biophys. Res. Commun. 418, 571–577 [DOI] [PubMed] [Google Scholar]
- 20.Sun M. (2012) Chicken Embryonic Stem Cells Induced into Male Reproductive Cells and the Preparation of Transgenic Chicken. Ph.D. Thesis, YangZhou University, Jiangsu, China
- 21.Bannister S.C., Smith C.A., Roeszler K.N., Doran T.J., Sinclair A.H. and Tizard M.L.V. (2011) Manipulation of estrogen synthesis alters MIR202 Expression in embryonic chicken gonads. Biol. Reprod. 85, 22–30 [DOI] [PubMed] [Google Scholar]


