Abstract
Near Infrared Reflectance (NIR) is a new imaging technology that detects dental caries (decay) on tooth occlusal surfaces and in the interproximal contact sites between teeth. Conventional techniques, mostly dental x-rays, do not provide the high sensitivity and specificity at the vulnerable pits and fissure regions. The contrast of demineralization on tooth surfaces changes with increasing severity and the magnitude of that change with depth depends on the wavelength. The purpose of this study is to determine how the contrast changes with depth as a function of wavelength. Demineralization of varying depth was produced in 1.5 × 1.5 mm exposed windows after 1, 2, 3, 4, and 5 days of exposure to a demineralizing solution at pH 4.5. Lesions were imaged at 405, 630, 850, 1300, 1460, 1535, 1675, and 1950-nm with multiple imaging systems. The highest lesion contrast was measured at 1950-nm.
Keywords: NIR imaging, SWIR imaging, occlusal lesions, dental, reflectance imaging
1. INTRODUCTION
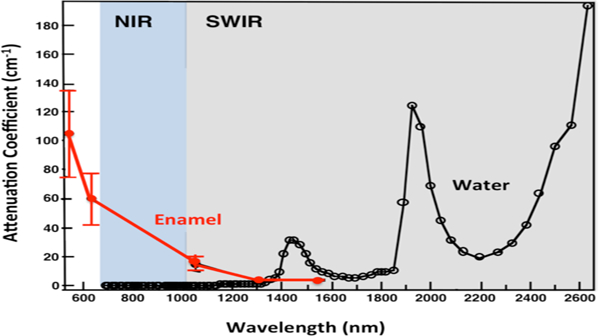
Studies indicate that light scattering in dental enamel decreases with increasing wavelength and increased water absorption decreases the backscattered light (reflectance) from sound tooth structure [1, 4, 5]. Short wavelength IR (SWIR) imaging allows greater diagnostic capabilities than the current standard of bitewing radiographs for both interproximal and occlusal carious lesions [6–12]. Therefore, higher contrast between sound and demineralized enamel is expected at longer SWIR wavelengths and reflectance measurements support this hypothesis. Hyperspectral measurements by Zakian et al. [13] showed the tooth continuing to get darker and darker with increasing wavelength. The magnitude of absorption by water at 1940-nm (120 cm−1) is 4 times higher than at 1450-nm (29 cm−1) [2], see Fig. 1. Higher contrast translates to higher diagnostic performance and earlier detection of demineralization. Previous studies demonstrated that SWIR reflectance measurements at wavelengths coincident with higher water absorption yield higher contrast than other existing methods including QLF [14]. Even though light scattering in enamel is at a minimum in the SWIR, light scattering in sound dentin is high. At wavelengths highly absorbed by water, i.e., 1450 and 1940-nm, deeply penetrating light is absorbed by the water in the surrounding/underlying sound enamel and dentin, thus increasing lesion contrast. The scattering coefficient of enamel is 20 to 30 times higher in the visible versus the SWIR at 1300 nm [1, 3]. SWIR imaging allows greater diagnostic capabilities than the current standard of bitewing radiographs for both interproximal and occlusal carious lesions [6–12, 15]. The principal reason there has been limited success for caries-detection schemes such as fiber optic transillumination [16–21] and the optical caries monitor [22], along with fluorescence based methods is that stains interfere to produce false positives and prevent accurate measurement of lesion severity. Both in vitro and in vivo studies show that stains completely mask demineralization in the pits and fissures [23–25].
Fig. 1.

The attenuation coefficient for dental enamel (red) and the absorption coefficient of water (black) in the visible to IR [1–3]. NIR range is 700–1000 nm (blue) and SWIR range is 1000–2500 nm (gray).
The purpose of this study is to determine the influence of the depth of demineralization on the contrast of demineralization on tooth occlusal surfaces at wavelengths from the visible to 1950-nm.
2. MATERIALS AND METHODS
2.1. Sample preparation
Twenty-five sound teeth extracted from patients in the San Francisco Bay Area were collected, cleaned, sterilized with gamma radiation, and stored in a 0.1% thymol solution. The teeth were mounted on 1.2 × 3 cm rectangular blocks of black orthodontic composite resin with the tooth occlusal surface facing up. Each rectangular block fit precisely in an optomechanical assembly that could be positioned with micron accuracy. Two windows 1.5 × 1.5 mm were cut into the occlusal surface of the tooth to serve as sample and reference windows using a CO2 laser as can be seen in Fig. 3. The entire tooth was covered with acid resistant varnish from Revlon (New York, NY) leaving only the sample window exposed. Artificial lesions were created in the sample windows by exposing them to a demineralizing solution for periods of 1, 2, 3, 4 & 5 days for n=5 teeth per group. Artificial lesions were prepared using a demineralization solution maintained at 37°C at pH 4.5. The solution consists of 40 mL aliquots of 2.0 mmol/L phosphate, 2.0 mmol/L calcium, and 0.075 mol/L acetate. After the time was up, the varnish was removed with acetone and the teeth were refrigerated and stored in a 0.1% thymol solution.
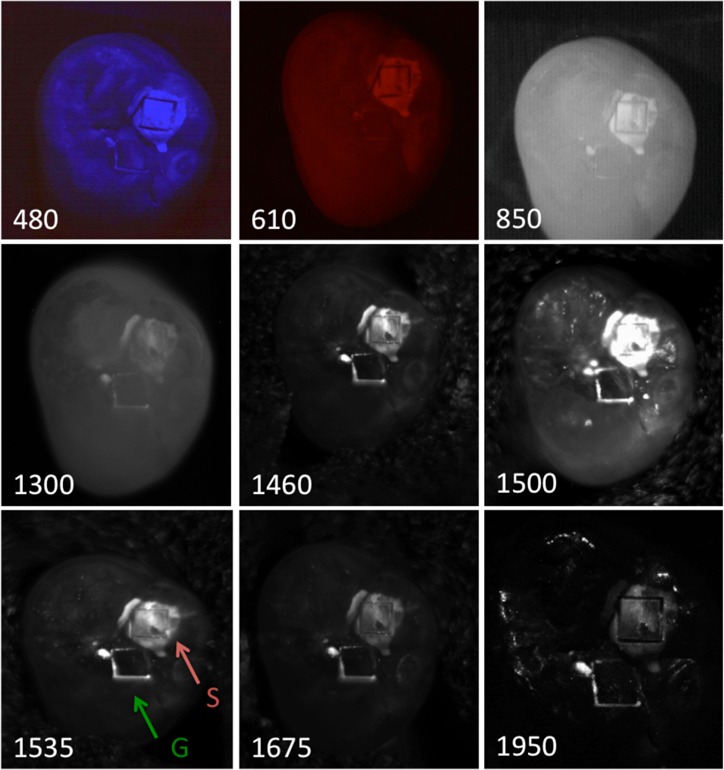
Fig 3.

Reflectance images acquired for one of the samples at all the wavelengths investigated. The red and green arrows indicated the boxes cut into the occlusal surface for the samples and reference windows.
2.2. Reflectance Measurements
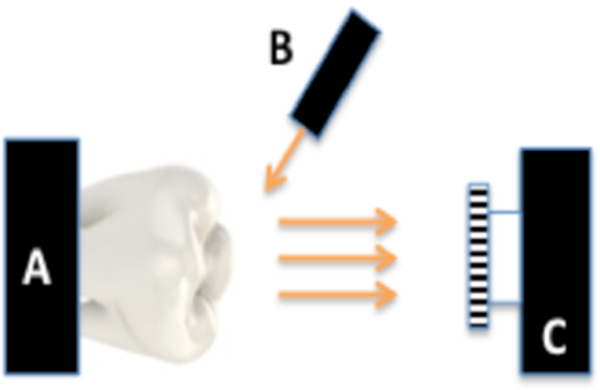
The setup of Fig. 2 was used for reflectance measurements. Light from various light sources was directed towards the tooth at a 30 degree angle and the reflected NIR light transmitted from the tooth was captured by the imager. Crossed polarizers were used to remove specular reflection (glare) that interferes with measurements of the lesion contrast at the NIR and SWIR wavelengths.
Fig 2.

Imaging configuration for cross-polarized reflectance with (A) tooth, (B) light source and (C) imaging cameras.
Blue and red light reflectance images were acquired using three USB microscopes from BigC (Torrance, CA). One microscope Model AM4113T was used to acquire images while the LEDs on the other two microscopes were used for illumination, Model AM4115TW-GFBW and AM4115T-DFRW each with 7 LEDs centered at 480-nm and at 620-nm. A DMK-3002–IR near-IR sensitive CCD camera from the Imaging Source (Charlotte, NC) equipped with an Infinity Infinimite lens was used to acquire 850-nm images. A 150-W fiber-optic illuminator FOI-1 from E Licht Company (Denver, CO) coupled to an adjustable aperture was used as a light source and a 850-nm filter with a 70-nm bandwidth was used for the 850-nm images.
SWIR reflectance images from 1300–1750-nm were captured using a 12-bit Model GA1280J from Sensors Unlimited (Princeton, NJ) with a 1280 × 1024 pixel format and 15-µm pixel pitch with ISR-P lens. A stabilized Tungsten IR light source, Model SLS202, from Thorlabs (Newton, NJ) with a peak output at 1500-nm and collimating optics. Several bandpass [BPwavelength(bandwidth)] and longpass [LPwavelength] filters were used to select wavelength intervals in the NIR and SWIR including: BP1300(90), BP1460(85), BP1535(80), LP1500(1500–1750), BP1675(90).
In order to acquire images at 1950-nm a single point scanning system was used as described in reference [26]. Collimated light from a linearly polarized 200-mW 1950-nm fiber laser, Model AP-CW from AdValue Photonics (Tucson, AZ) was focused onto the tooth samples with an f=100-mm lens. Computer-controlled XY motion control system ESP-301 and UTM150 stages from Newport (Irvine, CA) were used to scan the samples for NIR reflectance image acquisition. Cross-polarized backscattered light from the tooth surface was collected with a Model PDA10DT extended range InGaAs detector from Thorlabs (Newton, NJ).
All image analysis was carried out using the Igor pro software from Wavemetrics (Lake Oswego, OR). The mean values of the intensity of the pixels in the sample or demineralized box (IS) and sound reference box (IR) were determined and the following formula was used to calculate the reflectance contrast (IS-IR)/IS which varies from 0 to 1 for positive contrast, where 1 is the maximum achievable contrast and 0 is no contrast. A repeated measures one-way analysis of variance (ANOVA) followed by the Tukey-Kramer post-hoc multiple comparison test was used to compare the contrast measurements between groups using the Prism statistical software from GraphPad (San Diego, CA).
3. RESULTS AND DISCUSSION
Reflectance images taken of one of the samples is shown in Fig. 3. The mean contrast between the sample and reference windows increases from the visible to 1950-nm. The highest contrast is at 1950-nm where the water absorption is high and light scattering is low [26]. The contrast at 480-nm was fairly low for the shallow demineralization in the sample windows which was less than 150-µm deep even after five days. Studies have suggested that the contrast of demineralization can be very high at blue wavelengths [27]. Our primary goal in this study was to examine how the lesion contrast varies with lesion depth and wavelength. However, the lesion depth in the sample windows was highly variable and highly non-uniform and the only wavelength for which we could establish a significant correlation between the lesion contrast and the lesion depth was for 1950-nm where there was a slight but significant positive linear correlation R2=0.15, P<0.05. We plan to reanalyze the lesion contrast and lesion depth data using optical coherence tomography to map out the lesion depth in the future.
4. ACKNOWLEDGMENTS
This work was supported NIH/NIDCR Grant R01-DE027335.
5. REFERENCES
- [1].Fried D, Featherstone JDB, Glena RE, and Seka W, “The nature of light scattering in dental enamel and dentin at visible and near-IR wavelengths,” Appl Optics, 34(7), 1278–1285 (1995). [DOI] [PubMed] [Google Scholar]
- [2].Hale GM, and Querry MR, “Optical constants of water in the 200-nm to 200-µm wavelength region.,” Appl Optics, 12, 555–563 (1973). [DOI] [PubMed] [Google Scholar]
- [3].Jones RS, and Fried D, “Attenuation of 1310-nm and 1550-nm Laser Light through Sound Dental Enamel,” Lasers in Dentistry VIII. Proc SPIE, Vol. 4610 187–190 (2002). [Google Scholar]
- [4].Chung S, Fried D, Staninec M, and Darling CL, “Near infrared imaging of teeth at wavelengths between 1200 and 1600 nm,” Lasers in Dentistry XVII. Proc SPIE, Vol. 7884 X:1–6 (2011). [DOI] [PMC free article] [PubMed] [Google Scholar]
- [5].Simon JC, Chan KH, Darling CL, and Fried D, “Multispectral near-IR reflectance imaging of simulated early occlusal lesions: variation of lesion contrast with lesion depth and severity,” Lasers Surg Med, 46(3), 203–15 (2014). [DOI] [PMC free article] [PubMed] [Google Scholar]
- [6].Lee C, Darling CL, and Fried D, “In vitro near-infrared imaging of occlusal dental caries using a germanium enhanced CMOS camera,” Lasers in Dentistry XVI. Proc SPIE, Vol. 7549 K:1–7 (2010). [DOI] [PMC free article] [PubMed] [Google Scholar]
- [7].Buhler C, Ngaotheppitak P, and Fried D, “Imaging of occlusal dental caries (decay) with near-IR light at 1310-nm,” Optics Express, 13(2), 573–82 (2005). [DOI] [PubMed] [Google Scholar]
- [8].Fried D, Featherstone JDB, Darling CL, Jones RS, Ngaotheppitak P, and Buehler CM, “Early Caries Imaging and Monitoring with Near-IR Light,” Incipient and Hidden Caries, Dental Clin North Amer 49(4), 771–794 (2005). [DOI] [PubMed] [Google Scholar]
- [9].Hirasuna K, Fried D, and Darling CL, “Near-IR imaging of developmental defects in dental enamel.,” J Biomed Opt, 13(4), 044011 (2008). [DOI] [PubMed] [Google Scholar]
- [10].Lee D, Fried D, and Darling C, “Near-IR multi-modal imaging of natural occlusal lesions,” Lasers in Dentistry XV. Proc SPIE, Vol. 7162 X:1–7 (2009). [DOI] [PMC free article] [PubMed] [Google Scholar]
- [11].Staninec M, Lee C, Darling CL, and Fried D, “In vivo near-IR imaging of approximal dental decay at 1,310 nm,” Lasers Surg Med, 42(4), 292–8 (2010). [DOI] [PMC free article] [PubMed] [Google Scholar]
- [12].Jones G, Jones RS, and Fried D, “Transillumination of interproximal caries lesions with 830-nm light,” Lasers in Dentistry X. Proc SPIE, Vol. 5313 17–22 (2004). [Google Scholar]
- [13].Zakian C, Pretty I, and Ellwood R, “Near-infrared hyperspectral imaging of teeth for dental caries detection,” J Biomed Optics, 14(6), 064047 (2009). [DOI] [PubMed] [Google Scholar]
- [14].Fried WA, Darling CL, Chan K, and Fried D, “High Contrast Reflectance Imaging of Simulated Lesions on Tooth Occlusal Surfaces at Near-IR Wavelengths,” Lasers Surg Med, 45(8), 533–541 (2013). [DOI] [PMC free article] [PubMed] [Google Scholar]
- [15].Jones RS, Huynh GD, Jones GC, and Fried D, “Near-IR Transillumination at 1310-nm for the Imaging of Early Dental Caries,” Optics Express, 11(18), 2259–2265 (2003). [DOI] [PubMed] [Google Scholar]
- [16].Barenie J, Leske G, and Ripa LW, “The use of fiber optic transillumination for the detection of proximal caries,” Oral Surg, 36, 891–897 (1973). [DOI] [PubMed] [Google Scholar]
- [17].Pine CM, “Fiber-Optic Transillumination (FOTI) in Caries Diagnosis,” Early Detection of Dental Caries I Indiana University, 51–66 (1996). [Google Scholar]
- [18].Holt RD, and Azeevedo MR, “Fiber Optic transillumination and radiographs in diagnosis of approximal caries in primary teeth,” Community Dent Health, 6, 239–247 (1989). [PubMed] [Google Scholar]
- [19].Mitropoulis CM, “The use of fiber optic transillumination in the diagnosis of posterior approximal caries in clinical trials,” Caries Res, 19, 379–384 (1985). [DOI] [PubMed] [Google Scholar]
- [20].Hintze H, Wenzel A, Danielsen B, and Nyvad B, “Reliability of visual examination, fibre-optic transillumination, and bite-wing radiography, and reproducibility of direct visual examination following tooth separation for the identification of cavitated carious lesions in contacting approximal surfaces,” Caries Res, 32(3), 204–9 (1998). [DOI] [PubMed] [Google Scholar]
- [21].Schneiderman A, Elbaum M, Schultz T, Keem S, Greenebaum M, and Driller J, “Assessment of Dental caries with Digital Imaging Fiber-Optic Transillumination (DIFOTI): In vitro Study,” Caries Res, 31, 103–110 (1997). [DOI] [PubMed] [Google Scholar]
- [22].ten Bosch JJ, van der Mei HC, and Borsboom PCF, “Optical monitor of in vitro caries,” Caries Res, 18, 540–547 (1984). [DOI] [PubMed] [Google Scholar]
- [23].Chung S, Fried D, Staninec M, and Darling CL, “Multispectral near-IR reflectance and transillumination imaging of teeth “ Biomed Opt Express, 2(10), 2804–2814 (2011). [DOI] [PMC free article] [PubMed] [Google Scholar]
- [24].Almaz EC, Simon JC, Fried D, and Darling CL, “Influence of stains on lesion contrast in the pits and fissures of tooth occlusal surfaces from 800–1600-nm,” Lasers in Dentistry XXII. Proc SPIE, Vol. 9692 X:1–6 (2016). [DOI] [PMC free article] [PubMed] [Google Scholar]
- [25].Ng C, Simon JC, Fried D, and Darling CL, “SWIR reflectance imaging of demineralization on the occlusal surfaces of teeth beyond 1700-nm,” Lasers in Dentistry XXIV. Proc SPIE Vol. 1047 U:1–6 (2018). [DOI] [PMC free article] [PubMed] [Google Scholar]
- [26].Chan KH, and Fried D, “Multispectral cross-polarization reflectance measurements suggest high contrast of demineralization on tooth surfaces at wavelengths beyond 1300-nm due to reduced light scattering in sound enamel “ J Biomed Opt, 23(6), 060501 (2018). [DOI] [PMC free article] [PubMed] [Google Scholar]
- [27].Zhang L, Nelson LY, and Seibel EJ, “Spectrally enhanced imaging of occlusal surfaces and artificial shallow enamel erosions with a scanning fiber endoscope,” J Biomed Opt, 17(7), 076019 (2012). [DOI] [PMC free article] [PubMed] [Google Scholar]


